Data Issues
Data Issues
Waves 1 to 9

This paper provides a summary of data-related issues that have emerged over the life of Growing up in Australia: The Longitudinal Study of Australian Children (LSAC). The chapters were initially published on the LSAC website as a series of Issues Papers designed to assist users of the LSAC data as they undertake research and analysis of the LSAC datasets.
The paper is to be used in conjunction with the Data User Guide available on the LSAC website.
Read the publication
1. Introduction
This paper provides a summary of data-related issues that have emerged over the life of Growing up in Australia: The Longitudinal Study of Australian Children (LSAC). The chapters were initially published on the LSAC website as a series of Issues Papers designed to assist users of the LSAC data as they undertake research and analysis of the LSAC datasets.
The paper is to be used in conjunction with the Data User Guide.

2. Cleaning of time use diary data
2.1 Background
The LSAC time use diary (TUD) is a diary consisting of 96 15-minute time intervals or bubbles with pre-coded activity (e.g. sleeping, eating, bathing) and context (e.g. where they were and who they were with) information. Parents are asked to mark which of the pre-coded activities were done during each of the 96 time intervals. The diary begins at 4 am. Time interval 1 is from 4 am to 4:14 am, time interval 2 is from 4:15 am to 4:29 am, etc. For the B cohort at Wave 1 there were 22 pre-coded activities, five context locations and seven 'who else was present' context options. Additionally, the diarists were asked whether they had paid for the activity that the child was doing. For the Wave 1 B cohort the total matrix size was 3,360, consisting of the 35 activities and context descriptors by 96 time intervals. The Wave 1 K cohort had 26 pre-coded activities. Otherwise, the diary was the same as for the B cohort. The matrix size for the K cohort was 3,744.
The data entry used scanning technology. For Wave 1, few checks were made at the time of data entry and subsequently it has been found that the scanner was sensitive to rub outs and other marks that appeared in the bubbles on the paper files. This resulted in false data (false positives) that exists in the electronic data files but does not exist on the paper files.
For Wave 2 various procedures were implemented to ensure that these problems did not recur. These procedures involved changes to the data capture and data validation stages.
To reduce problems associated with capturing the data, changes were made to the scanner settings. Through the Intelligent Forms Processing (IFP) system it is possible to define the minimum character/mark size that will be registered by the system. Testing of TUD capture confirmed that oversensitivity of scanning equipment can produce a high rate of false positive responses on the TUD. Following iterative testing of LSAC dress rehearsal (DR) TUD forms, it was determined that the character size for the TUD 'bubbles' should be increased from 2 x 2 pixels to 2 x 5 pixels. Testing showed that this setting allowed the IFP system to disregard very small specs of dust, etc. (thereby greatly reducing false positives) without any impact on the false negative rate.
A second setting that impacts on the registration of marks is the size of field that is 'scanned' for a character/mark. Often this field size is expanded slightly beyond the expected capture area to allow marks falling slightly outside the response box to be registered. However, in the case of the TUD, the extremely close arrangement of the response bubbles meant that such an expansion led to false positives from slight (and unintended) continuation of marks beyond one response bubble but not quite into the subsequent one. For this reason, horizontal margins for the capture area have been strictly limited to the intended response area (i.e. the border of the response bubble). However, vertical (top/bottom) margins of 6 pixels outside the response bubble have been retained to ensure that marks made slightly above/below a response bubble are captured.
Following capture, forms are forwarded for inspection and repair by a trained operator. The process outlined below is performed on all TUD forms, with the majority expected to contain at least one response mark that will need to be investigated.
The first repair process conducted on scanned forms is the on-screen inspection of mosaics of scanned response marks known as carpets. Carpets display images of all marks from the same form that have been recognised by the system. Depending on the system's confidence in the validity of a particular response, the mark will be displayed in a green, yellow or red shaded box. At this stage the operator is able to confirm or correct a response or, alternatively, select responses for further investigation through the form process (see below).
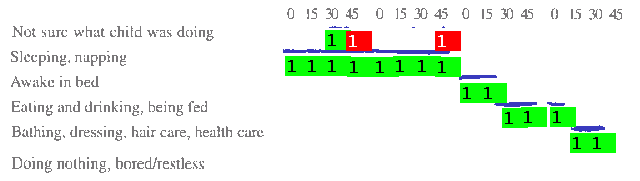
In the example below (Figure 1) the carpet displays images of eight response marks, all of which were confidently identified by the system as valid responses. In two cases the respondent has clearly attempted to correct a response by crossing out the original mark. While the Optical Mark Reader (OMR) scanner is unable to distinguish these responses from the valid responses, the analysis of carpets gives the operator an opportunity to correct the data, thereby avoiding potential false positives. Operators conducting repair of LSAC forms are trained to examine carpets for these types of responses.
Figure 1: Example of 'carpets' from time use diary scanning

Forms containing at least one mark queried by the system or the operator progress to the forms stage of repair. At this stage the operator is able to see the queried response in the context of the form and other responses.
In the test example below (Figure 2) the operator has queried the two marks highlighted in red during the earlier examination of carpets for this form. The ability to further examine these marks then enables the operator to make a more informed decision regarding its validity.
Figure 2: Example of in-context diary data display
The processes outlined above have been developed as a result of the experience of the Australian Bureau of Statistics (ABS) in the capture of LSAC TUD forms during the Wave 2 dress rehearsal and more recent testing of final forms. It should be noted, however, that these processes do not address data quality issues associated with respondent error nor will they fully overcome capture difficulties associated with formatting features of the TUD such as the extremely close arrangement of response bubbles and the sheer volume of information recorded on each page.
The rest of this section reports on the extent of the Wave 1 false positives and provides a description of attempts to electronically remove the false positives, as well as other measures to improve data quality. A number of strategies were used to recode the data, working off the premise that most implausible data combinations are likely to be false positives. For example, if it is late in the evening or early in the morning, a child is likely to be either in bed or asleep, not simultaneously sleeping and walking (not for extended periods of time at least). The rules for the electronic recodes are outlined in more detail below. These corrections were applied only to the early wave TUD data.1
In recoding the data it is important that the amount of real data being incorrectly removed (false negatives) is minimised. It is expected that this incorrect coding was most likely to occur when there were transitions between activities. In order to protect against this, sequences of events were often considered. That is, comparisons were often made with the preceding and following time interval. However, it must be realised that from time to time diarists unintentionally provide information on implausible events.
In addition to the recoding of false positives, other data cleaning strategies or imputations are employed. These recodes are potentially important, as it is common in time use analysis to exclude data with more than 90 minutes of missing data. Thus, if the number of missing bubbles can be minimised, less data is lost. These imputations are performed on the data from all three waves.
2.2 Assessing the extent of the false positives
In order to estimate the extent of the false positives and to ascertain whether corrections could be made electronically, a random sample was drawn from both the B cohort (n = 51) and the K cohort (n = 49). One diary was excluded from the B cohort as the diary was returned blank, and two diaries were excluded from the K cohort, one because only one activity was given for the whole diary and the other because it did not match the electronic file at all. These forms were manually checked against the electronic records so that false positives were identified and given a unique code on the electronic record. These files are known throughout this report as the 'corrected files'. The files of these cases before they are checked are known as the 'original files'.
K cohort, Wave 1
A summary of false positives by data type for the K cohort is presented in Table 1. Over the random sample of 47 children and over the 96 time intervals, there were 16,248 positive responses in the original file. This file had 882 'extra' bubbles or units of data than was provided in the 'corrected file'. Thus, the false positive rate is 6% (876/(876 + 15,366)*100). It should be noted that there was one diary that had a false positive rate of 30%, while the next highest figure was 14%. If these cases were to be excluded, the false positive rate would drop to 5%.
For the K cohort, the highest aggregate false positive rate was for the 'with whom' context data (7%), while for the activity data and 'where' context data, the false positive rate was around 5%. The light diary also asked whether someone was paid for the activity. There was only one false positive associated with this data.
The general trend was that the more real data there was the greater the number of false positives. This is not surprising given that much of the false positive data was due to rub-outs.
B cohort, Wave 1
A summary of false positives by data type for the B cohort is given in Table 2. Over the random sample of 50 children over the 96 time intervals, there were 17,703 units or bubbles of data in the original file. This file had 723 false positive values or 'extra' bubbles or units of data than was provided in the 'corrected file'. Thus, the total false positive rate was 4% (723/17703*100).
2.3 Recoding to reduce false positives
K cohort, Wave 1
A number of recodes were experimented with to reduce the rate of false positives. Table 3 gives a summary of the impact of electronic recodes on the original file in terms of both reducing the number of false positives as well as introducing false negatives into the data. These recodes reduced the false positive for the test file to 5%. The recodes are described in greater detail below.
Notes: a Imputed true negatives are those cells that were imputed as '0' where the corrected file had indicated that the positive response was a false positive. b Imputed false negatives are those cells that were imputed to '0' where the corrected file indicated that the positive response was a true positive.
Correction 1: Being asleep and doing other activities at the same time
In order to reduce the likelihood of recoding a transitional phase, the child had to be asleep in a given interval and in the preceding and following intervals. Three separate time periods were tested: morning (4 am to 9 am), nighttime (9 pm to 4 am) and daytime (9 am to 9 pm).
For the morning and nighttime periods, if an activity occurred simultaneously with sleep, non-sleep activity time was coded as zero. The recoding of activities occurring simultaneously with sleep in the morning and in the evening was relatively successful, with an aggregate number of 84 correct recodes and 12 incorrect recodes. In the full Wave 1 file (i.e. n = 7,449) this resulted in 23,216 recodes of positive responses. This correction was not performed on the Wave 2 data (n = 6,906); however, if it had been it would have only resulted in 4,498 recodes. This provides further evidence that this correction removed many more false positives than true ones.
In the period between 9 am and 9 pm, children were most likely to be periodically transitioning between sleep and other activities. Attempting to recode activities occurring simultaneously with sleep, in this period, yielded no corrections to false positives and resulted in eight true positives being recoded. Alternatively, an attempt to recode sleep resulted in recoding four false positives and five true positives. Given that both these alternatives resulted in more incorrect recodes than correct ones, neither was performed on the main data file.
Correction 2: Being awake in bed and doing other unlikely activities at the same time
Other unlikely activities are defined as:
- bathing, dressing, hair care, health care
- using computer/computer games
- walking for travel or fun
- riding bicycle, trike, etc. (travel or fun)
- other exercise - swim/dance/run about
- travelling in pusher or on bicycle seat
- travelling in car/other household vehicle
- travelling on public transport, ferry, plane
- taken places with adult (e.g. shopping)
- organised lessons activities.
If the children were doing these activities as well as being awake in bed, other activities were coded as zero. Again, in order to reduce the likelihood of recoding a transitional phase, the child had to be awake in bed in a given interval, while in the following and preceding interval they had to be either asleep or awake in bed.
The impact of recoding activities occurring simultaneously with the child being awake in bed was relatively minor, with only one false positive being recoded in the 47 diaries in the original file, and 1,225 positive responses being recoded in the full file. This is not surprising given that 4-5 year old children are not often awake in bed for long periods of time unless they are ill or are having trouble getting to sleep. In Wave 2, 1,077 positive responses would have been recoded due to this correction.
Correction 3: A child cannot be travelling and be inside at home or be alone
A child cannot be travelling (travelling in a pusher/ travelling in a car/ travelling on public transport/taken places with an adult) and be simultaneously at home inside (or in someone else's home) or be alone, if travelling was their sole activity for the time period. Recoding the context data as 0 where this occurred resulted in slightly more false positives being altered than true ones. In the full file this resulted in 4,111 positive responses being recoded. In Wave 2, 1,359 responses would have been recoded.
Correction 4: A child cannot be walking/riding and be inside a home
A child cannot be walking for travel or fun or riding a bike or trike, etc. and be inside their own or someone else's home if this is their only activity for the time period. Recoding all incidences of being inside as zero resulted in many more false positives being altered than true ones. In the full file this resulted in 1,996 positive responses being recoded. In Wave 2, only 282 responses would have been recoded.
Correction 5: A child cannot be watching television or using a computer and be outside
A child cannot be watching television or using the computer and be outside. Recoding being outside as zero in this situation resulted in only one false positive correction for these 47 diaries but no alterations to true positives. In the full file this correction resulted in the recoding of 430 positive responses. In Wave 2, 157 responses would have been recoded.
Correction 6: A child cannot be sleeping or awake in bed and be outside
If a child was awake in bed or asleep and this was their only activity they cannot be outside. While this does exclude any children who were camping (assuming a tent doesn't count as indoors), in the test cases available this correction eliminated 12 false positives without altering a true positive. In the full file this resulted in 2,459 positive responses being recoded. In Wave 2, 535 responses would have been recoded.
Correction 7: A child cannot be at a day care centre/play group outside the hours of 7 am to 7 pm
If a response was given outside of these hours it was recoded to zero. In the original file this resulted in four corrections to false positives without creating any false negatives, while in the full file 1,417 responses were recoded by this correction. In Wave 2, 610 responses would have been recoded.
B cohort, Wave 1
Table 4 gives a summary of the impact of electronic recodes on the original file for the infants in terms of both reducing the number of false positives as well as introducing false negatives into the data. In summary, the recoding resulted in a reduction of 121 of the 723 false positive data, with little creation of false negatives. As a result of these recodes, the false positive rate fell from 4% to 3%. The recodes are described in greater detail below.
Notes: a Imputed true negatives are those cells that were imputed as '0' where the corrected file had indicated that the positive response was a false positive. b Imputed false negatives are those cells that were imputed to '0' where the corrected file indicated that the positive response was a true positive.
Correction 1: Being asleep and doing other activities at the same time
Children should not be asleep and also be active in another activity in the same time interval unless the child was in transition between activities. For this recode, activities that were indicated in the same time period of sleep were recoded for intervals where the child was also asleep in the preceding and following interval. This recode was tried for a number of different time periods but was only successful at the start of the day between 4 am and 7 am, where it recoded 28 false positives and eight true ones. In the full file (n = 7,782) this recode resulted in 11,278 positive responses being altered. As for the K cohort, these corrections were not repeated in Wave 2; however, if they had been, only 1,464 responses would have been recoded, suggesting that most Wave 1 responses recoded were false positives.
Correction 2: Being asleep alone and with someone at the same time
If the child was sleeping alone in a time period as well as the one preceding and following it, all other data in the 'in the same room as' section was recoded to zero. The only time period this didn't work for was the evening between 3 pm and 10 pm, so this period was excluded from this recode. Outside of these times it resulted in 60 corrections to false positives while introducing only 15 false negatives. In the full file this recode resulted in 29,016 responses being altered. In Wave 2, 8,618 responses would have been recoded.
Correction 3: A child cannot be travelling and be inside at home or be alone
A child cannot be travelling (travelling in a pusher/ travelling in a car/ travelling on public transport/taken places with an adult) and be simultaneously at home inside or be alone. A child was identified as travelling if they are travelling in a given interval and the preceding and following interval. In this situation, the 'at home' or 'alone' response would be removed. This correction removed 27 false positives while introducing nine false negatives. In the full file, it led to 6,303 positive responses being removed. In Wave 2, 1,098 positive responses would have been removed.
Correction 4: Being alone and with improbable activities
If a child's only activities are breastfeeding, being held, having personal grooming tasks performed, or being read a story or talked or sung to, any response that the child was alone for the period was recoded to zero. Correcting this removed four false positives and produced one false negative, while in the full file this recode led to the removal of 1,031 responses of 'alone'. In Wave 2, 420 responses would have been removed.
Correction 5: Being at a day care centre/playgroup at improbable hours
Any response indicating that the child was at a day care centre outside the hours of 7 am to 7 pm was recoded to zero. This recode corrected two false positives and produced no false negatives, while in the full file, 593 positive responses were removed. In the Wave 2 file, 301 responses would have been removed.
2.4 Coding to improve data quality
A number of further recodes were undertaken to improve other aspects of data quality, such as reducing missing or contradictory data.
B and K cohorts
These operations were performed on all three waves of diary data for both cohorts.
Improvement 1: Recoding not sure when other activities given in the same time interval
Ideally, respondents should only have given 'not sure' as a response if they were unable to report any of the child's activities in a 15-minute block. Where this has happened the 'not sure' response was coded to zero. For Wave 1, this removed 12,770 'not sure' responses from the K cohort file and 10,026 'not sure' responses from the full infant file. For Wave 2, these figures were 4,678 for the K cohort and 3,717 for the B cohort and, in Wave 3, they were 5,380 for the K cohort and 3,759 for the B cohort.
Improvement 2: Imputing not sure or missing activity data as sleep and the early morning
If the parent was not sure of what the child was doing or activity data was missing in the early morning (4 am to 9 am) and the sequence of not sure/missing ended with either the child being awake in bed or sleeping, the not sure/missing was recoded as sleep. In Wave 1, these changes created an extra 984 sleep responses in the full K cohort file and 1,292 extra sleep responses in the full B cohort file. In Wave 2, these figures were 1,036 for the K cohort and 1,002 for the B cohort and, in Wave 3, they were 943 for the K cohort and 566 for the B cohort.
Improvement 3: Imputing not sure or missing activity data as sleep at nighttime
If the parent was not sure of what the child was doing or activity data was missing at nighttime (9 pm to 4 am) and this sequence began following the child being either awake in bed or sleeping, the not sure/missing data was recoded as sleep. This created an extra 2,540 sleep responses in the full K cohort file and 4,101 in the full B cohort file. In Wave 2, the figures were 2,681 for the K cohort and 3,933 for the B cohort and, in Wave 3, they were 2,229 for the K cohort and 2,328 for the B cohort.
Improvement 4: Other missing data
If there was a single time period with missing activity data and the child remained in the same location, then either the activity before or after the missing bubble was randomly allocated to the missing bubble. This improvement imputed activities in 2,517 time periods in the full K cohort file and 3,022 time periods in the B cohort file. For Wave 2, these figures were 1,956 for the K cohort and 2,389 for the B cohort and, in Wave 3, they were 1,553 for the K cohort and 1,767 for the B cohort.
Improvement 5: Missing 'who' information in child care
If a child's 'where' information includes 'day care centre/playgroup', it can reasonably be assumed they are in the presence of other children and other adults when alternative information is missing. This improvement imputed data in 17,294 time periods in the full K cohort file and 3,169 time periods in the B cohort file. As might be expected given the rise in time in non-parental care for the children as they get older, these numbers were higher in Wave 2 with 35,097 time periods for the K cohort and 12,712 for the B cohort and, in Wave 3, they were 23,045 for the K cohort and 15,835 for the B cohort.
2.5 Exclusion of cases
It is common practice when analysing time use diary data to exclude cases with poor quality data, often indicated by rules of thumb such as more than 90 minutes of missing information (e.g. Egerton and Gershuny, 2004; Fisher, 2002). The LSAC time use diaries use a different response format than many other similar instruments (i.e. the use of scanned responses rather than coding of text responses) and this may have an effect on the quality of the diary data and on which cases should be excluded. Cases considered to be of poor quality were removed from the main diary dataset and placed in a separate file so that they could be re-included for any analysis where the user thought they might be valuable.
2.6 Criteria for exclusion
Three criteria were used to exclude cases from the dataset.
Cases with large amounts of missing data
As mentioned above, it is common practice to remove cases with more than 90 minutes missing activity data from analyses. However, analyses of the LSAC data suggested that using this rule of thumb might be inappropriate as children who spent time away from their parents (e.g. in child care) were more likely to have greater levels of missing activity data. Instead, a diary was deleted from the file if it had no data of any kind for more than 90 minutes (or six time intervals). In Wave 1, this criterion excluded 239 diaries (3%) from the B cohort file and 368 diaries (5%) from the K cohort file. For Wave 2, 235 (4%) diaries were deleted from the B cohort file and 268 (4%) were deleted from the K cohort file. For Wave 3, 147 (3%) diaries were deleted from the B cohort file and 233 (4%) were deleted from the K cohort file.
Cases with large numbers of simultaneous activities
Most time use diaries request respondents to describe their main activity for each time period, with limited opportunities to describe secondary activities. The format of the LSAC time use diary meant that a number of activities could be specified separately; however, where numbers were large, it often indicated that the respondent had trouble understanding the task. As such, it was decided to exclude any respondent that gave more than five simultaneous activities for more than six time periods. In Wave 1, this criterion excluded 78 diaries (1%) from the B cohort file and 55 diaries (1%) from the K cohort file, while in Wave 2, 26 (0.4%) B cohort diaries and 16 (0.2%) K cohort diaries were deleted. For Wave 3, 11 (0.2%) diaries were deleted from the B cohort file and 11 (0.2%) were deleted from the K cohort file.
Cases with few changes in activities
Diaries with few changes in activities tended to occur when the parent either did not have a good idea of the child's activity (e.g. large amount of time in non-parental care) or was not able to fill in the diary in detail. It was decided that fewer than 10 different activities over the 24-hour period represented an unacceptable lack of detail. This excluded 59 diaries (1%) from the B cohort file and 144 diaries (2%) from K cohort file. In Wave 2, these figures were 110 (2%) and 171 (3%) respectively. For Wave 3, 120 (2%) diaries were deleted from the B cohort file and 159 (3%) were deleted from the K cohort file.
There were some diaries excluded for more than one reason, so in total for Wave 1, 330 diaries (4%) were excluded from the B cohort file and 490 (7%) were excluded from the K cohort file. The effect of the exclusion of these diaries on the socio-demographic composition of the time use diary sample can be seen in Table 5. The deleted diaries tended to come from lower socio-economic status families.
Note: a TUD samples are larger than the LSAC sample as respondents were asked to complete two diaries.
In Wave 2, 335 (5%) were deleted from the B cohort file and 405 (6%) from the K cohort file. The effect of the exclusion of these diaries on the socio-demographic composition of the time use diary sample can be seen in Table 6. Again, the deleted diaries tended to come from lower socio-economic status families.
Note: a TUD samples are larger than the LSAC sample as respondents were asked to complete two diaries.
In Wave 3, 228 (4%) were deleted from the B cohort file and 339 (6%) from the K cohort file. The effect of the exclusion of these diaries on the socio-demographic composition of the time use diary sample can be seen in Table 7. Again, the deleted diaries tended to come from lower socio-economic status families.
Note: a TUD samples are larger than the LSAC sample as respondents were asked to complete two diaries.
2.7 Summary
Corrections to improve data quality and deletion of problem cases had some effect on the rate of false positives due to scanning errors in the corrected files (i.e. the cases that had been checked against the paper forms). When these improvements were performed on the corrected file, the false positive rate dropped to 5% for the K cohort file and 3% for the B cohort file. In Wave 2, these same recodes, when applied to more rigorously checked, scanned files, recoded far fewer responses. This adds further evidence that it was largely false positive responses that were being recoded in Wave 1. Tables 8a to 8f show the effect of the recodes on estimates produced by the full data file. In the final Wave 1 B cohort file (i.e. with cases deleted and all corrections made) 88% of cases had at least one correction made to them, while in the final K cohort file, 84% of cases had at least one correction. In Wave 2, these proportions were much lower: 41% for the B cohort and 48% for the K cohort. In Wave 3, they were 42% for the B cohort and 46% for the K cohort.
Note: a Analysis uses weights that adjust for general LSAC non-response as well as weighting each day of the week equally in the analysis. These weights are recalculated when the poor-quality cases are deleted.
Note: a Analysis uses weights that adjust for general LSAC non-response as well as weighting each day of the week equally in the analysis. These weights are recalculated when the poor-quality cases are deleted.
Note: a Analysis uses weights that adjust for general LSAC non-response as well as weighting each day of the week equally in the analysis. These weights are recalculated when the poor-quality cases are deleted.
Note: a Analysis uses weights that adjust for general LSAC non-response as well as weighting each day of the week equally in the analysis. These weights are recalculated when the poor-quality cases are deleted.
Note: a Analysis uses weights that adjust for general LSAC non-response as well as weighting each day of the week equally in the analysis. These weights are recalculated when the poor-quality cases are deleted.
Note: a Analysis uses weights that adjust for general LSAC non-response as well as weighting each day of the week equally in the analysis. These weights are recalculated when the poor-quality cases are deleted.
Acknowledgement
This chapter is largely based on the work of Jude Brown and Michael Bittman of the University of New England. David Zago of the Australian Bureau of Statistics provided the information on the process used to scan Waves 2 and 3 forms.
1 Note that at the time of the release of Wave 2 data the Wave 2 TUDs also had these processes applied to them in order to maximise consistency. For the release of the Wave 3 data this decision was reversed. It was felt that the corrections excluded some combinations of activities that were unlikely but possible, particularly as the children became older (e.g. sleeping outside).
3. Report on Adapted PPVT-III and 'Who Am I?'
3.1 Wave 1 scoring
The first wave of the Longitudinal Study of Australian Children (LSAC) used two tests with the four-year-old sample. The Adapted PPVT-III is a shortened version of the Peabody Picture Vocabulary Test, Third Edition (Dunn & Dunn, 1997), which is a test of receptive vocabulary used as a screening test of verbal ability. This adaptation is based on work done in the USA for the Head Start Impact Study, with a number of changes for use in Australia. 'Who Am I?' (de Lemos & Doig, 2000) assesses the cognitive processes that underlie the learning of early literacy and numeracy skills. One item was added to the standard 'Who Am I?' booklet for use in LSAC. Summary statistics for each test are shown in Table 9.
Note: For the adapted PPVT-III, it was assumed that children who were not required to answer 10 'basal' items had answered these items correctly. Reliability reported here is the person separation reliability (Wright & Masters, 1982).
Adapted PPVT-III
The PPVT-III was adapted for use in LSAC by altering the administration procedures, reducing the number of items administered during testing. To determine which items to retain for the adapted version, 215 children aged from 41 to 66 months (mean = 54.7 months) were given the PPVT-III, with test administrators following standard procedures. After testing, a one-parameter (Rasch) item response model was fitted to the data, which consisted of correct and incorrect responses. The person separation reliability was 0.88. After determining the 'best' 40 items for use in a shortened version, the remaining items were then fit again to a one-parameter item response model; the person separation reliability decreased to 0.78.
Development of the model suggested that 37% of children would require only the core set of items, 5% would require the core and basal sets, and 58% would require the core and ceiling sets, resulting in an average of 26.3 items administered. The Pearson product-moment correlation between the full PPVT-III and the adapted PPVT-III was 0.93 for all children, and 0.91 for four year olds (Rothman, 2013).
Scaling
The adapted PPVT-III was scaled using a two-stage process. In the first stage, only the core set of 20 items was used, as these items had been administered to all children. For these core items, Rasch estimates were determined for each item, providing an indication of their difficulty. In the second stage, all 40 items were fitted, using the item estimates for the core items as anchors. This gave item estimates for the basal and ceiling items relative to the core items. The final case estimates were then transformed to a scale with a mean of 64 and standard deviation of 8.
Results
In Wave 1, 4,407 children were administered the adapted PPVT-III. Children ranged in age from 43 months to 79 months (mean = 57.3); 21% were aged 60 months or older. Twenty-one per cent of children were administered only the core set, 1% were given the core and basal sets, and 78% were given the core and ceiling sets, resulting in an average of 27.9 items. The test had a person separation reliability of 0.76.
Quality of the PPVT test
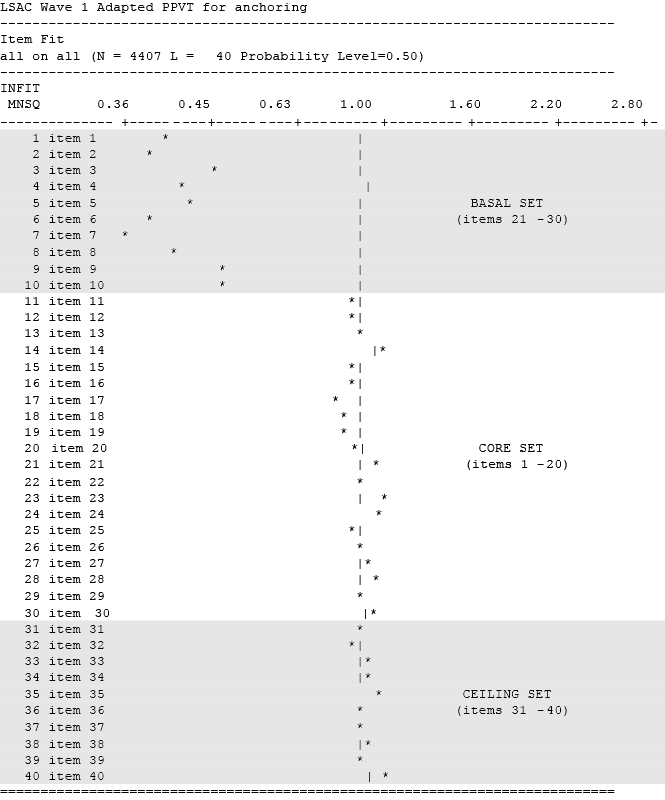
The statistics indicate that the core and ceiling items used for the adapted PPVT-III test fit the Rasch model well. This is shown in Figure 3, the item fit map. The infit mean square ranged from 0.86 to 1.17 for items 11-30 (the core set) and items 31-40 (the ceiling set). On each of the items in the basal set (items 1-10), the infit mean square was extremely low (0.49 or less) because only 30 children (1%) were administered these items; all other children were assumed to have correctly answered these items. The item map in Figure 3, which shows the item estimates (difficulties) mapped against the case estimates (children's ability levels), shows that the basal items were appropriate for children given that set but that the core and ceiling items were relatively easy for those who were given those sets.
Figure 3: Item fit map for all items on the Australian adaptation of the Peabody Picture Vocabulary Test (PPVT-III) calibrated with all cases anchored to core items
'Who Am I?'
'Who Am I?' consisted of 11 pages on which children were to write their names, copy shapes and write words and numbers. Each response was assessed on a four-point scale relating to the skill required for the task. A score of zero was assigned if no attempt was made on the item. The data were fit using a partial credit item response model. The final case estimates were transformed to a scale with a mean of 64 and standard deviation of 8. Summary statistics are shown in Table 9.
In Wave 1, 4,827 children were administered 'Who Am I?' The test had a person separation reliability of 0.89.
Quality of the 'Who am I' test
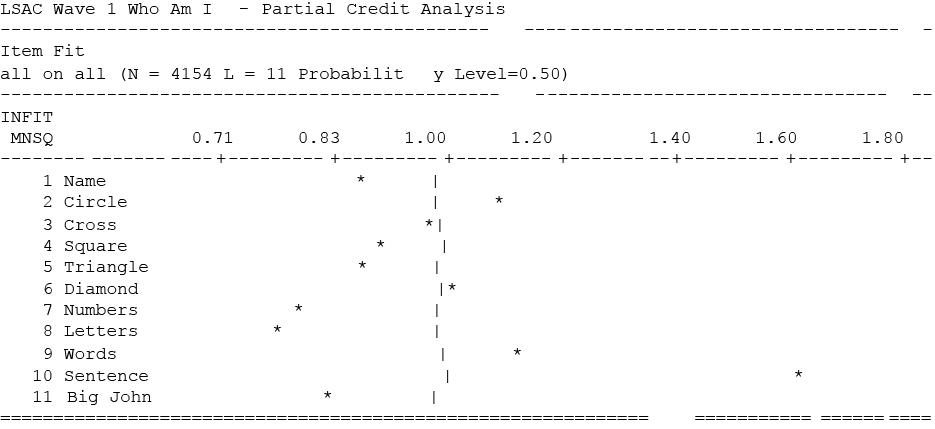
The statistics indicate that the 'Who Am I?' data fit the rating scale model well, with most items falling within acceptable ranges, as shown in Figure 4. The most difficult item on the test was item 10, in which children were asked to write a sentence. Only nine children received four points for their response; more than one-half of children made no attempt on this item. This is also shown in the item fit map (Figure 4): item 10 (Sentence) has an infit mean square of 1.67, while all other items ranged from 0.77 to 1.14.
Figure 4: Item fit map for all items on the 'Who Am I?' test
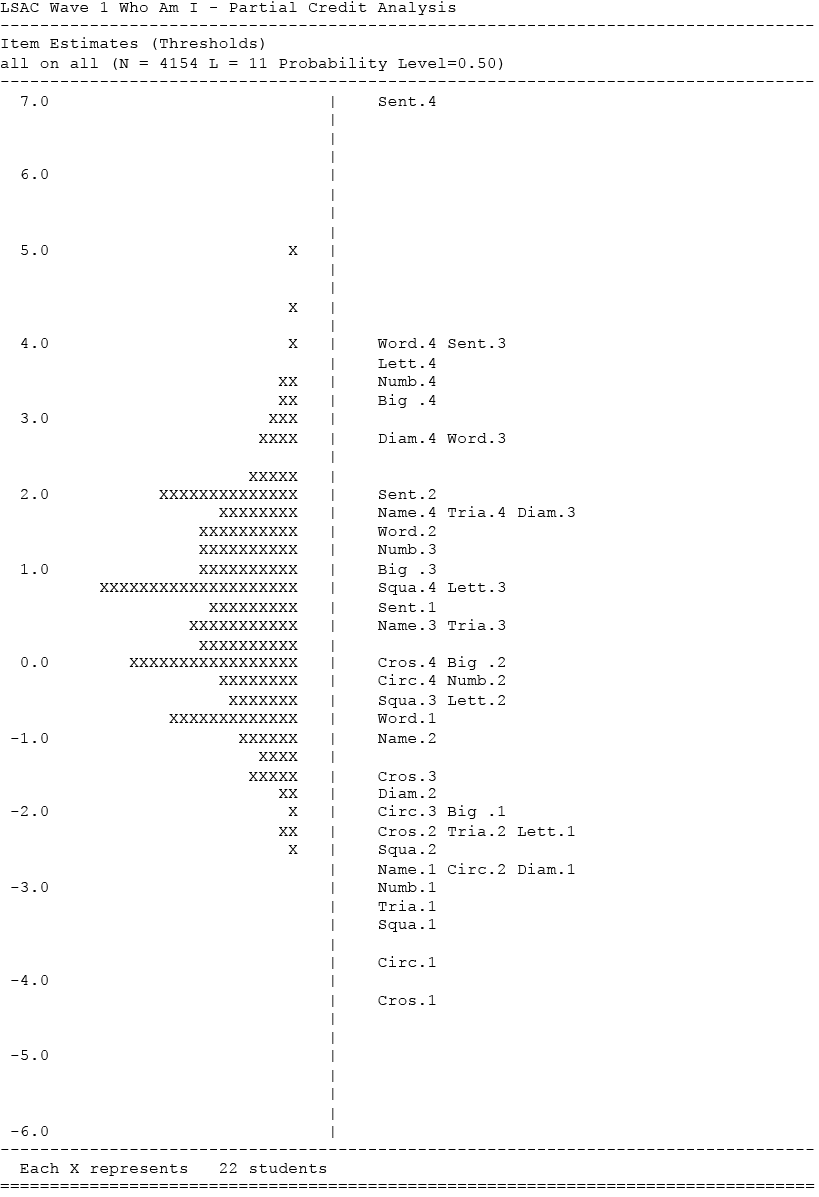
Analysis of a partial credit model provides information on the thresholds required to move from any score to a higher score on each item. This information is provided in Figure 5, the item map, and is plotted against the distribution of case estimates. For all items, higher scores had higher logit values, indicating that higher scores were achieved by children who had higher ability estimates. The item map also indicates that the distribution of children (on the left) was only slightly above the distribution of the items (on the right), indicating that there was a good match between the difficulty of the items and the children's ability levels.
Correlation between the adapted PPVT-III and 'Who Am I?'
The two tests had a Pearson product-moment correlation of 0.309, based on 4,386 children who received scores on both tests. While significant at the .01 level, this is considered a low-to-moderate correlation.
Figure 5: Item map for all cases on the 'Who Am I?' test
3.2 Wave 2 PPVT development
This paper describes the procedures used to develop a shortened version of the Peabody Picture Vocabulary Test (PPVT) for use in Growing Up in Australia: The Longitudinal Study of Australian Children (LSAC). This version of the test was developed to be used with six year olds as part of the second wave of LSAC and is linked to the shortened version developed in 2003 for use with four year olds as part of the first wave of LSAC (Rothman, 2013). The concept of a shortened version of the PPVT is from work done in the USA for the Head Start Impact Study. The original work was described in a draft paper by Philip Fletcher of Westat.
Procedures
All procedures described below are based on procedures used for the version used with four year olds. For that version, four alternative sets of items were tested; one set was developed for use in LSAC. For the six-year-old version, no alternative sets were used as the scope of the project was to develop a test that could be linked to the four-year-old version.
As done for the test administered to four year olds, the purpose was to develop a test that would consist of 40 items divided into a core set of 20 items, a basal set of 10 items for children who miss a minimum number of items on the core set, and a ceiling set of 10 items for children who correctly answer a minimum number of items on the core set. No child would take more than 30 items. It was also decided that at least 50% of children should be required to take the core set only.
Testing
A sample comprising 421 children was drawn from schools in New South Wales, Victoria and Queensland. During July and August 2005, the children were administered the full version of the PPVT-III, Form A, using the standard procedures for administering the test to six year olds. These children ranged in age from five years seven months to seven years 11 months. Seventy-eight per cent of the children were six years old, and 18% were seven years old. All children were in the same classes at the schools involved in the data collection. Subsequent examination of the data showed that the children from out-of-range ages did not appear as significantly different cases.
Analysis
Test items were examined using a one-parameter logistic IRT model with the software Quest. For items below the PPVT basal set that were not administered, all were marked as correct. Items with a low number of responses were eliminated from the IRT analysis. Overall, 132 items were used for analysis, as they covered a range that would allow 40 items to be selected and included the items administered in the four-year-old test.
Selection of items
The properties of the items were then determined, based on the data available from the Quest output. The first stage was to identify link items from the four-year-old test that could be used with the six year olds. For the 20 items of the core set, eight items that had appeared in the four-year-old test were selected. These items were selected on the basis of infit mean square and outfit mean square close to 1.00 in both administrations, the degree of difficulty on the items among both groups, the consistency of change between the administration to the groups, and the ability to provide a reasonable spread across the core set. Two items from the four-year-old test were selected for the basal set, and one item from the four-year-old test was selected for the ceiling set.
After the link items were selected, the remaining items were selected using those with infit mean square and outfit mean square close to 1.00, good discrimination and an ability to provide a reasonable range of item difficulties (-2.50 to +2.50). Items were also selected according to their position in the original PPVT sets and their parts of speech: nouns, verbs and adjectives. The final 20 core items were then positioned into two sets of 10 items, with the first 10 items generally easier than the second 10 items but with an overlap of item estimates. Similar analyses were done to select the 10 basal and 10 ceiling items.
Notes: Item threshold and infit mean square statistics are from the simulated test. *Link item included in test for four year olds.
Simulations
Simulation results were then calculated in SPSS. With the objective of having approximately 50% of children requiring only the core set of 20 items, the items were checked to determine percentages of children requiring the basal or ceiling sets. Rules governing the administration of the test, particularly those regarding the number of correct items required for administration of the basal or ceiling sets, also guided the selection of items. The simulation suggested that approximately 25% of children would require the ceiling set, 10% the basal set and 65% the core only. It should be noted that similar targets for the four year olds were not achieved in the first wave of LSAC, with more than 65% of children requiring the ceiling set.
Once the 40 items were selected, a new IRT analysis was conducted using only those items. Case and item estimates showed that the model fit the data well.
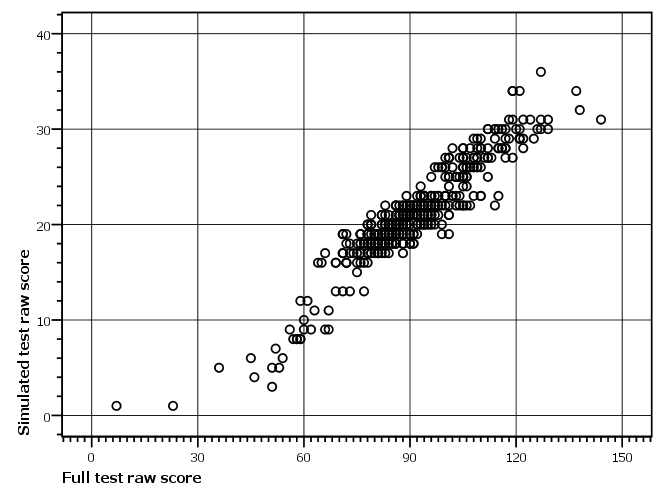
Results for the two versions - the full PPVT and the adapted version - were then compared: the full PPVT raw score with the case estimates from both the full test and the adapted test (Figure 6). The lowest correlation was 0.887, while most correlations were in the 0.93 to 0.97 range, suggesting that the adapted version of the PPVT provides similar results to the full PPVT.
Figure 6: Scatterplot showing joint distribution of scores on simulated adaptive PPVT-III and scores on full PPVT-III for six year olds
Comment
The six-year-old version of the adapted PPVT-III for use in LSAC was developed so that it can be linked with the four-year-old version of the test. This allows for the measurement of growth between administrations of the test. Forty items were selected for the test, with 20 items administered to all children as the core set (core sets 1 and 2). For children who made 15 to 20 errors, an additional basal set of 10 items would be administered and, for children who made 0 to 6 errors, an additional ceiling set of 10 items would be administered. Simulations showed that approximately two-thirds (67%) of children would require only the core sets, 7% would require the core and basal sets, and 26% would require the core and ceiling sets; this distribution was considered in the selection of items.
Acknowledgement
This chapter is largely based on the work of Australian Council for Educational Research.
7. Height differences
In the leave-behind questionnaires for both parents at Wave 1 and Wave 2, the parents were asked to report their height and weight so their body mass index (BMI) could be calculated. In cleaning Wave 2 data, it was discovered that there was a large number of discrepancies between the values reported by the same people at Wave 1 and at Wave 2. In fact, only 50% of respondents reported a value that was within 1% of their Wave 1 value.
Further investigation failed to find any explanation other than respondent error for the vast majority of these cases. In order that data analysts could assume that any observed changes in BMI were due to changes in reports of weight rather than height, it was decided to impute the value of height to be the average of the two reported values.
At Wave 3, the question on the Parent 1's height was asked of all new Parent 1's and those that had not returned a self-complete form at Wave 2, plus a handful of cases where Parent 1 had swapped places with Parent 2. However, for Parent 2, the height data was still collected by self-complete form, so sequencing cases around the question was not an option. Hence, for many,3 there are now three points of data collection.
When the study child's height is measured as part of the interview process, a third measurement is taken if the first two disagree by more than 0.5 cm. If this is the case, the estimate of the child's height is considered to be the average of the two that correspond the most closely. This method of estimation means that the least reliable estimate has no effect on the result. It is suggested that in cases with three data points for a parent's height, the 'clean' result provided on the data file could similarly be the average of the closest two responses. As is done currently, the values of parental height for each wave prior to this cleaning will remain on the data file if analysts wish to use their own approach.
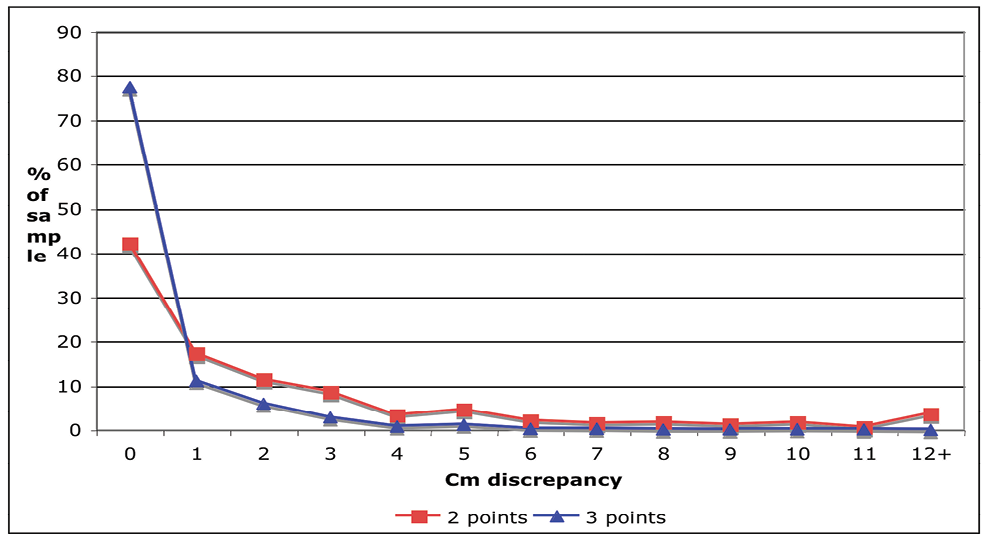
Figure 7 shows the discrepancy between the two values used to create the 'clean' result for those parents with two data points versus those with three. Those with three data points had two that agreed in 77% of cases. Those with two data points had agreement in only 42% of cases. It should be noted, however, that at Wave 2, 45% of cases had agreement between the two data points, so there is some evidence that those who were more likely to return self-complete questionnaires were more likely to give accurate data.
It was decided on inspection of Figure 7 that any case with more than a 10 cm discrepancy between the two closest values should be considered unreliable and therefore should be set to missing. This would affect 4% of Wave 3 parents with two data points and less than 0.1% of cases with three data points.
Outcome:
1.This problem with the height data was presented to the February 2009 data Expert Reference Group Meeting and the group decided that if the differences are less than 10 cm we would average all three, otherwise we would average the closest two. Consequently, this is how the height data have been adjusted.
Figure 7: Centimetre discrepancy in two closest data points for those with three vs two data points on parental height for Wave 3 respondents
3 72% of those who returned Parent 2 questionnaires at Wave 3 have data from all three waves. Of all Wave 3 Parent 2s, 11% had no height data, 16% had one data point, 22% had two data points and 51% had three data points.
9. Data issues in Wave 4
9.1 Instances of child but not parent participation
Ideally, it is expected that parents who provide consent to interview their children would agree to be interviewed themselves. However, this does not happen in 100% of cases. In Wave 3, there was only one case out of 8,718 home visits in which a parent was not interviewed but provided consent to interview a child. In Wave 4, there were five out of 8,405 cases where parents were not interviewed but agreed to their children being interviewed. The main reasons for parents to refuse a home interview but allow their child to be interviewed were lack of interest and time.
Parent 1's refusal to the home interview might lead to missing household information.4 If household information is not available this record is not included in the household file. As a result, in Wave 4, the household file hhgrk10 contains 4,164 records and main file lsacgrk10 contains 4,169 records. If data users intend to merge these datasets, they need to be aware that there is a mismatch between the datasets for five cases.
To help a data user identify cases with available household data the following variables were created: *hhresp for both cohorts. In variable names the asterisk refers to an age indicator (In Wave 4, d refers to the B cohort and f refers to the K cohort).
While in Waves 3 and 4 the discrepancy in child and parent participation is minor, it might increase in future waves due to: (1) changes to the interview procedure; or (2) children becoming more active participants/refusers in the study; or (3) increases in other activities of parents and children meaning fewer times when both are at home at the same time and available for interview.
Changes to the interview procedure
From Wave 4, interviewers were provided with two laptops and were able to conduct 'parallel interviewing'. The interview was split into two streams; all the Parent 1 (P1) questions were on laptop 1 and all the study child (SC) questions were on laptop 2. As a result, the interviewer had the flexibility to complete child and parent interviews either at the same time or at different times.
Children becoming active participants/refusers of the study
All cases where children were interviewed but parents were not belong to the K cohort in both Waves 3 and 4.
9.2 ACASI
The audio computer-assisted self-interview (ACASI) contains questions that are skipped if the study child has no mother and/or father figure in their life or does not attend school. As these circumstances were determined in the CATI component of the Parent 1 interview on laptop 1, they were not apparent in the interview on laptop 2 when the ACASI was conducted. Consequently, in order for the relevant questions to be skipped, prior to providing the laptop 2 to a study child to complete the ACASI, the interviewer was required to enter into the ACASI instrument whether there was 'Mum' and/or 'Dad' figures in the study child's life and whether the study child had been attending school. The interviewers were asked to use their knowledge of the family that they gained after completing the CATI component with the Parent 1.
When deciding if it would be appropriate to ask about a 'Mum' or 'Dad' the interviewers were asked to be sensitive towards the situation of the child as family structure can be complicated. The interviewers were instructed that if they were unsure whether there was a 'Mum' or 'Dad' in the child's life and/or whether a child had any contact with them to enter 'no father' or 'no mother' so as to not distress the child. For example, in the situation where the current Parent 1 and Parent 2 were not the biological parents, it was unclear as to who the child would be referring when asked about their mother or father. In just a few cases there was an interviewer's error and wrong information was rolled into the ACASI module.
In just a few cases there were inconsistencies between the household information and the interviewer's assessment of whether there was a mother in the child's life. As a result, there were 10 cases for which a mother was recorded in the household file but where all questions about the mother were skipped in the ACASI module. There were also 32 cases where all questions about the father in the ACASI module were skipped but a father was identified in the study child's life in the household file. To identify these problematic cases the following variables were created (asterisk refers to an age indicator):
- *mumsk - a mother is identified in the household but questions about 'Mum' figure are skipped in ACASI module
- *dadsk - a father is identified in the household but questions about 'Dad" figure are skipped in ACASI module
- *schsk - child is in school but questions about school are skipped in ACASI module.
With regards to school attendance, 40 children who were in school (as identified in the education module) skipped all the questions about school in the ACASI module. This mismatch was mainly due to manual errors and one of the problems of the method used; that is, information about the child's education is provided by Parent 1 and stored on the laptop 1 and the study child completes ACASI separately on the laptop 2. This information being stored on different computers means that these instruments do not talk to each other.
9.3 Matrix Reasoning
Matrix Reasoning (MR) is a test from the Wechsler Intelligence Scale for Children, 4th edition (WISC-IV) (Wechsler, 2004) for ages 6-7, 8-9 and 10-11 years. This test of non-verbal intelligence presents a child with an incomplete set (later referred to as item) of pictures and requires the child to select the picture that completes the set from five different options. The instrument is comprised of 35 items of increasing difficulty.
Administration rules
According to the WISC-IV manual, the administration of Matrix Reasoning should follow a set of rules. We are not going to discuss all the rules in detail but rather focus on the rules crucial for our purposes.
Administration of the test should start at the age-specific start-point, which is indicated in the WISC-IV manual. Item 4 is the start-point for children aged 6-7 (B cohort) and Item 7 is the start-point for children aged 10-11 (K cohort).
Items prior to age-appropriate start-points are called reversal items. Reversal items are asked only if a child provides incorrect answers on the first or second start-point item. If a child answers incorrectly either of the first two items from the start-point, the interviewer asks the preceding items (reversal items) in reverse sequence until the child answers correctly two consecutive items and then goes back to the age-appropriate items and proceeds with the rest of the test. This is called reverse administration. For example, if a 6-year-old child answered correctly on Item 4 and incorrectly on Item 5, an interviewer should reverse to Item 3, then Item 2. If Item 3 or Item 2 is incorrect then Item 1 is administered. If Items 3 and 2 are correct, Item 1 is not administered. After administering reversal items, the interviewer goes back to Item 6 and proceeds with the rest of the test.
Scoring rules
The total raw score of MR is equal to the number of correct items starting from an age-appropriate start-point plus the total score on the reversal items. For items administered from the age-appropriate start-point a raw score of 1 is assigned for each correct answer.
For reversal items the following scoring rules are applied:
- Rule 1 - Each reversal item gets a score of 1 if the reverse administration is not required (first two items from the start-point are answered correctly). For example, if a 6-year-old child answers correctly Items 4 and 5, the reversal Items 1, 2 and 3 are scored 1 each.
- Rule 2 - Each reversal item gets a score of 1 if a child correctly answers two consecutive reversal items. For example, if a 6-year-old child answers correctly on reversal Items 3 and 2 and Item 1 is not administered or answers incorrectly on Item 3 and correctly on Items 2 and 1, the reversal Items 1, 2 and 3 are scored 1 each.
- Rule 3 - Each correctly answered reversal item gets a score of 1 and each incorrectly answered reversal item gets a score of 0 if a child does not answer correctly on any two consecutive reversal items. For example, a 6-year-old child answers incorrectly on the reversal Items 3 and 1 but correctly on the reversal Item 2. Then, Items 3 and 1 are scored as 1 each and Item 2 is scored as 0.
Administration of MR in LSAC
Due to the technical difficulties in programming, the reverse administration was not implemented in the LSAC MR instrument; that is, if LSAC children answered either of the two items from the start-point incorrectly the reversal items were never administered. Table 14 shows a number of cases where the first two items from an age appropriate start-point were answered correctly and incorrectly for B and K cohorts.
It can be seen from Table 14 that 95% of children answered the first two items from the age-appropriate start-point correctly and did not require the reverse administration. The raw scoring for these children was based on Rule 1. The other 5% of children answered one of the first two administered items incorrectly and, therefore, required the reverse administration to identify which rule for scoring should be used - Rule 2 or Rule 3. Given that the reverse administration was not available, it was decided to assign all reversal items a raw score of 1 regardless of whether the first two administered items were answered correctly or not. As a consequence, some of the 5% of children might have had their MR scores overestimated. The following variable was created to identify these 216 cases in the B cohort and 195 cases in the K cohort:

where * refers to appropriate age indicator.
The MR scores on Items 1-6 from previous waves are examined below.
K cohort
Out of 195 children from the K cohort who did not answer either one of two first items from the start-point at Wave 4, 185 children did MR at Wave 3. While the reverse administration was not implemented in Wave 3, all items were administered; that is, Item 1 was the first administered item. This allows us to cross-check how many children out of 185 gave two consecutive correct answers on Items 1, 2, 3, 4, 5 and 6. There were 179 who answered correctly either on all Items 1, 2, 3, 4, 5 and 6 or answered correctly on two consecutive items. In this instance, at Wave 3, they were assigned the maximum possible score. Assuming that cognitive ability of children remains stable over time, we would expect these children would obtain the maximum possible score for the first six items at Wave 4 too.
B cohort
In Wave 4, B cohort children were administered the MR test for the first time. However, in Wave 2, K cohort children did the MR test and they were the same age as the B cohort children in Wave 4. Therefore, the relative comparison could be made against the K cohort children of the same age. In Wave 2, there were 269 (6%) of the K cohort children who answered Items 4 or/and 5 incorrectly. Out of these 269 children, only 16 children did not answer correctly Items 3 and 2 or Items 2 and 1.
Therefore, based on the data from previous waves, we would expect only a very small number of children in either cohort to have their MR ability overestimated through the changes in administration and scoring.
4 If a Parent 1 completes CATI prior to the home interview, household information is not missing.
38. Teacher Experience
In Wave 7 B cohort, teachers were asked about teaching experience and data were collected in years and months. In addition, the data are then also output as total year and total months, combining the two input items.

For the Wave 7 release there were two issues in the data for teaching experience for (b) as an English teacher at this year level and (c) as a teacher in this school.
- There was an error in the derive for total years and months due to incorrect use of rounding code.
- There was also a mapping issue where the collected years and months for (b) and (c) were shown on the released final file as the derived total years and total months and vice versa.
The variables affected were:
gpc32c1 - years teaching experience? as an English teacher at this grade level? Total years derived
gpc32c2 - years teaching experience? as an English teacher at this grade level? Total months derived
gpc32c2a - years teaching experience? as an English teacher at this grade level? Years part
gpc32c2b - years teaching experience? as an English teacher at this grade level? Months part
gpc32b2a - years teaching experience? as a teacher in this school? Total years derived
gpc32b2b - years teaching experience? as a teacher in this school? Total months derived
gpc32b2c - years teaching experience? as a teacher in this school? Years part
gpc32b2d - years teaching experience? as a teacher in this school? Months part
42. Academic Rating Scale score in Wave 8
The Longitudinal Study of Australian Children (LSAC) uses the Academic Rating Scale (ARS) as one measure of children's academic development. The ARS has been used in the Early Childhood Longitudinal Study (ECLS-K) in the United States (see NCES, 2002, 2004) in relation to study children in Years 1, 3 and 5. The ARS in the earlier years of ECLS-K is divided into three domains: Language and Literacy, Mathematical Thinking and General Knowledge. For children in secondary school (Year 8), the ECLS-K uses separate questionnaires with teachers of English, Mathematics and Science.
The original ARS was adapted for use with Australian children for LSAC. Only the Language and Literacy and Mathematical Thinking domains were used with the K cohort in Waves 2 through 6, and with the B cohort in Waves 4 through 6. In Waves 7 and 8, only the Language and Literacy domain has been used, and only with the B cohort, as many of the children in the K cohort had left school.
This paper describes the procedures followed to obtain scores for the Academic Rating Scale in Wave 8. The procedures remain unchanged since the ARS was first used in LSAC.
In LSAC, the ARS is administered as part of the Teacher Questionnaire. The nine Language and Literacy items in the questionnaire ask the study child's English teacher, or another teacher who has regular classroom contact with the child, about the child's skills, knowledge and behaviours as shown in the child's current achievement and motivation, compared to other children in the same year level. There are five levels of rating: Not yet, Beginning, In progress, Intermediate and Proficient. Teachers can also indicate if the skill has not yet been introduced at the year level7 .
42.1 Method
LSAC ARS scores were calculated in the same manner as the ARS scores in ECLS-K, using the Rasch rating score model. This is the procedure followed in previous waves of LSAC for both the K and B cohorts.
Only children who were rated on more than 60% of items were assigned rating scale scores. In Wave 8, the Language and Literacy domain comprised nine items; ratings were therefore required on six or more items. Children with scores on fewer items were not included in the analyses and were not assigned scores. The numbers of children who were and were not assigned scores in each wave are contained in Table 48.
Possible scores on each of the nine items are 1, 2, 3, 4 or 5, according to the skill level assigned by the teacher. The initial analyses indicated that there was no overlap of the steps within each item (see section 40.6, Appendix 1).
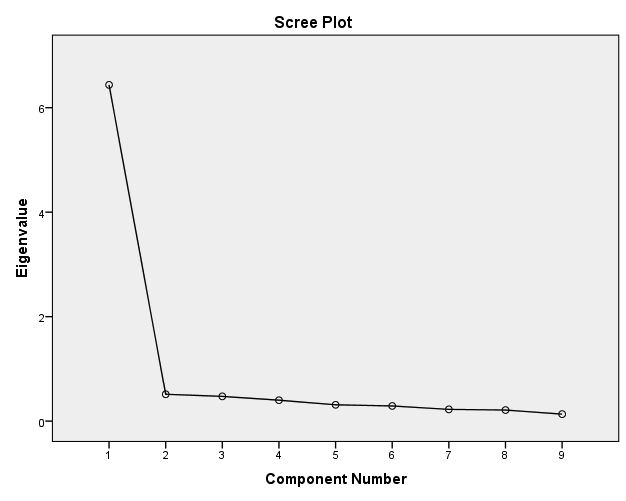
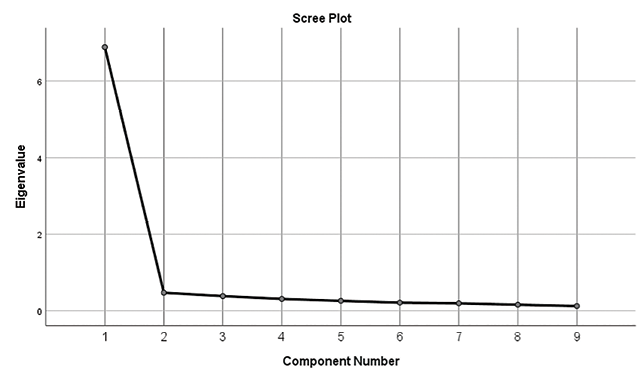
Principal component analysis indicated that a single component could be extracted from the nine items, accounting for 76.9% of the variance (see section 40.7, Appendix 2). Subsequent analysis used the rating scale option of the Rasch model, based on Wright and Masters (1982) and implemented in Quest (Adams & Khoo, 1996). The Rasch analysis showed that the reliability of the estimates of children's ability in Language and Literacy was very high (see Table 49). These estimates have remained above 0.90 for both cohorts, with decreases showing once the children have entered secondary school. The analysis assigned case estimates to each child.
Perfect scores were estimated by adding 1.1 logits to the Rasch estimate of the second highest score. 'Zero' scores were estimated by subtracting 1.1 logits from the Rasch estimate of the second lowest score. The Rasch model does not calculate estimates for perfect or zero scores - 'extreme scores' - so some estimation is required. Wright (1998) has suggested that these extreme scores should be at least 1.0 logit and no more than 1.2 logits away from the next scores, unless some justification can be made for using a greater distance. Examination of the distances between the near-perfect and near-zero scores showed that the addition/subtraction of between 1.0 and 1.2 logits for an extreme score was appropriate, and that 1.1 logits would provide a reasonable result.
Once case estimates were obtained for the pattern of ratings on the ARS items, the estimates were transformed to ARS scores that reflect the range of scores available to the children's teachers; that is, the lowest possible score on the ARS scale is 1 and the highest is 5. Rasch case estimates were then transformed to ARS scores using a linear transformation. Again, this is consistent with the procedures used in ECLS-K. The equation used to convert the Rasch estimates to ARS scores is:
ARS = 2.9065 + (0.2876 x estimate)
Table 50 presents the conversion data for the ARS in each domain for children who obtained scores on all items in the scale. The table shows the raw score, the ARS score and the standard error associated with each score. As noted above, ARS scores were assigned to children with ratings on at least 60% of the items in a scale.
Notes: Extreme scores are indicated with E; standard errors not available for extreme scores.
42.2 Results and using ARS scores
Summary statistics for the final ARS Language and Literacy scores are shown in Table 51, for all waves in which the ARS was administered with the B cohort. Scores are determined independently for each wave, as each score is based on the teacher's evaluation of how well the student is achieving against his or her peers at the same year level.
The mean score in the Language and Literacy domain for each wave in Table 51 indicates that, on average, members of the B cohort have been rated between 'In progress' and 'Intermediate'.
Distribution of the ARS scores in Language and Literacy are highly skewed, with 512 children (22% of children receiving scores) receiving rating scale scores of 5 across all items on the scale (Figure 8). One-half of all children who received scores were rated at 4 or above.
Figure 8: Distribution of Academic Rating Scale scores, Language and Literacy, B cohort, Wave 8
The ARS is a measure on an interval scale enabling comparisons between groups. Items in the ARS from earlier waves are not comparable to items in later waves. The following advice has been provided to users of ECLS-K data, and it applies to LSAC data:
The ARS scale was designed to provide information on children's abilities at a given point in time, not necessarily over time. In addition, although some item stems are similar to those used in the kindergarten and first grade teacher questionnaires, the actual items include performance criteria that increase in difficulty from one time to the next. Moreover, the ARS scores are placed on different metrics relative to the item difficulty in a given grade. Therefore, change scores should not be calculated between time points. However, covariance models may be used to compare teacher's ratings of performance in different grades. Before using these variables in such analyses, the distribution of the samples should be assessed to determine if the assumption of normal distribution is met. (NCES, 2004, p. 3-33; emphasis added)
In the case of LSAC, the items used in Wave 8 were not changed from previous waves; however, as noted above, the reference point in each wave is other children in the same year level.
We also note that scores on the ARS are highly skewed, with one-half of children receiving a score of 4 or above, and that the ARS is no longer used as part of the ECLS-K in the United States for children who have reached secondary school. Lower scores on the ARS may provide a good indication of children who is experiencing difficulties in school, but the skewed distribution makes it difficult to discriminate among children with higher scores.
7 It is assumed that all children in the cohort have commenced y education, with different teachers for each learning area.
Appendix B: Principal component analysis (Wave 7)
Total variance explained
| Component | Initial Eigenvalues | Extraction Sums of Squared Loadings | ||||
|---|---|---|---|---|---|---|
| Total | % of Variance | Cumulative % | Total | % of Variance | Cumulative % | |
| 1 | 6.437 | 71.517 | 71.517 | 6.437 | 71.517 | 71.517 |
| 2 | .514 | 5.714 | 77.231 | |||
| 3 | .474 | 5.267 | 82.498 | |||
| 4 | .401 | 4.452 | 86.950 | |||
| 5 | .313 | 3.475 | 90.425 | |||
| 6 | .290 | 3.224 | 93.648 | |||
| 7 | .225 | 2.500 | 96.148 | |||
| 8 | .212 | 2.359 | 98.507 | |||
| 9 | .134 | 1.493 | 100.000 | |||
Extraction Method: Principal Component Analysis.
Component Score Coefficient Matrix
| Component 1 | |
|---|---|
| glc09a11 16.1 - Conveys ideas when speaking | .123 |
| glc09a20 16.2 - Understands and interprets a story read aloud | .133 |
| glc09a12 16.3 - Strategies to gain information | .132 |
| glc09a13 16.4 - Reads fluently | .135 |
| glc09a21 16.5 - Reads and comprehends expository text | .132 |
| glc09a16 16.6 - Composes multi-paragraph texts | .137 |
| glc09a17 16.7 - Redrafts writing | .138 |
| glc09a18 16.8 - Makes editorial corrections | .134 |
| glc09a19 16.9 - Uses computer for variety of purposes | .118 |
Extraction Method: Principal Component Analysis.
Rotation Method: Varimax with Kaiser Normalisation.
Acknowledgement
This appendix is prepared by Sam Rothman from the Australian Council for Educational Research.
Appendix D: Principal component analysis (Wave 8)
| Component | Initial Eigenvalues | Extraction Sums of Squared Loadings | ||||
|---|---|---|---|---|---|---|
| Total | % of Variance | Cumulative % | Total | % of Variance | Cumulative % | |
| 1 | 6.886 | 76.511 | 76.511 | 6.886 | 76.511 | 76.511 |
| 2 | 0.472 | 5.243 | 81.754 | |||
| 3 | 0.383 | 4.257 | 86.011 | |||
| 4 | 0.310 | 3.440 | 89.451 | |||
| 5 | 0.260 | 2.892 | 92.342 | |||
| 6 | 0.212 | 2.358 | 94.701 | |||
| 7 | 0.194 | 2.159 | 96.860 | |||
| 8 | 0.159 | 1.766 | 98.626 | |||
| 9 | 0.124 | 1.374 | 100.000 | |||
Extraction Method: Principal Component Analysis.
| Component 1 | |
|---|---|
| hlc09a11 17.1 - Conveys ideas when speaking | .121 |
| hlc09a20 17.2 - Understands and interprets a story read aloud | .127 |
| hlc09a12 17.3 - Strategies to gain information | .129 |
| hlc09a13 17.4 - Reads fluently | .128 |
| hlc09a21 17.5 - Reads and comprehends expository text | .132 |
| hlc09a16 17.6 - Composes multi-paragraph texts | .130 |
| hlc09a17 17.7 - Redrafts writing | .131 |
| hlc09a18 17.8 - Makes editorial corrections | .127 |
| hlc09a19 17.9 - Uses computer for variety of purposes | .117 |
Extraction Method: Principal Component Analysis.
Rotation Method: Varimax with Kaiser Normalisation. Varimax with Kaiser Normalisation.
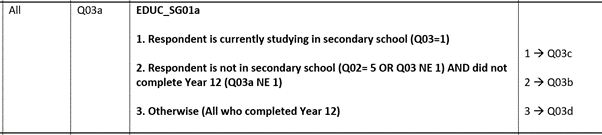
49. Sequencing error affecting Education items in 9C2
There were 370 B Cohort SC records who said they were currently enrolled in secondary school (i2pc82c2) but had also completed Year 12 (i2fd08c1a). At the first instrument sequencing point (see snippet below) these respondents should go down path 1 – those who have completed secondary school and path 3 – those who have completed Year 12, which is contradictory.
The respondents have been sequenced down path 1 as this is the first option. Using responses to other questions we have deduced that these respondents are enrolled in secondary school and have not yet completed year 12. The response to i2fd08c1a has been set to missing “.”.
Acknowledgements
The authors wish to acknowledge:
- DSS and AIFS for their support in providing feedback.
- Former ABS Data Processing team members for their contribution to earlier versions of the data issues paper.
Publication details
Australian Bureau of Statistics. (2021). Growing Up in Australia: The Longitudinal Study of Australian Children – Data Issues Waves 1 to 9. June 2021. Melbourne: Australian Institute of Family Studies. doi:10.26193/BAA3N6
Download Publication
Share


