12. Children's use of health care services
12. Children's use of health care services
Delivering health care services that meet the needs of the community is one of the fundamental challenges faced by health care systems. In Australia, Medicare provides access to free or subsidised treatment by health professionals such as doctors, specialists and optometrists. For vulnerable groups, such as children in low-income households, the services of dentists and other allied health professionals are also subsidised. Medicare also provides free care as a public patient in a public hospital and lower cost prescription medicine.
In 2013-14, total public expenditure on health in Australia was estimated at $154.6 billion ($6,639 per person) (Australian Institute of Health and Welfare [AIHW], 2015). Estimates from the 2011-12 Australian Health Survey indicate that in any two-week period, approximately 606,000 children under the age of 15 (14% of children) will have a consultation with a general practitioner (GP). In a 12-month period, 79% of children under 15 will see a GP, 20% will see a specialist and 45% will go to the dentist (Australian Bureau of Statistics [ABS], 2013). Given the substantial cost of public health care provision, it is of particular policy interest to examine the level and nature of health care service use among Australian children.
This chapter uses data collected between 2004 and 2014 to provide a snapshot of how health care services are used; problems gaining access to health services; and how children's use of health services differs depending on characteristics such as household income, parental education, private health insurance coverage, location and parents' reports of the general health of the child. We also examine parents' reports of problems gaining access to specific health services and the factors associated with difficulties accessing these services.
12.1 Patterns of health care service use among Australian children and adolescents
The percentage of children using specific medical services varied with age. For example, over 80% of 0-1 and 2-3 year olds had been to a GP in the past 12 months, compared to around three-quarters of 4-5 and 6-7 year olds and just over 60% of adolescents aged 12-13 and 14-15 (Table 12.1).1
Maternal and child health nurse services are free for all children from birth to school age. While these consultations are not compulsory, parents are encouraged to attend these appointments to discuss any concerns they have about their child's development. Regular visits are scheduled in the first few months of a child's life, with appointments becoming less frequent as children approach school age.
Box 12.1: Use of health care services
Use of health care services for the study child is captured in each wave of LSAC. The study child's main carer is asked whether they had, in the 12 months prior to the interview, used any of a list of services for the study child. Specific services listed vary from wave to wave, depending on whether the service is appropriate to the age of the child. For example, maternal and child health nurse services are only included up to age 4-5, and services such as speech therapy and psychological services are asked about from age 2-3 onwards.
Uptake of maternal and child health services were not as high as might be expected, and fewer children attended these visits as they got older. Around two thirds of 0-1 year olds had been to a maternal and child health nurse in 2004. However, only 32% of 2-3 year olds and 12% of 4-5 year olds had been to an appointment with a maternal and child health nurse in the past 12 months. These low figures may be partly due to the timing of 'key ages and stages' consultations and differences in the number of scheduled maternal and child health nurse visits across states. For some children, their scheduled maternal and child health nurse visit may not have fallen within the 12 month period prior to their LSAC interview.
Other data sources also show a considerable drop off in the use of maternal and child health services between birth and age 4. In Victoria, for example, participation rates in 2015-16 dropped from 99% for the initial home visit to 95% when children were two weeks old, to 79% attending the 12-month visit, and 62.5% attending the scheduled visit for 3.5 year olds (Department of Education, 2017).
Paediatricians specialise in the health and development of babies, teenagers and adolescents. However, referrals to a paediatrician are usually only required if a child has an ongoing or underlying health concern that needs to be monitored and treated by a specialist; and these consultations are often associated with out-of-pocket expenses. While almost 40% of 0-1 year olds had seen a pediatrician in the previous 12 months, less than 10% of children over the age of 4-5 had been to a pediatrician.
The Australian Dental Association recommends that children should see a dentist for the first time when their first tooth becomes visible, and then have dental check-ups every six months (Australian Dental Association, 2016). Given these recommendations, the proportion of children who had seen a dentist in the previous 12 months was lower than would be expected, even in the teenage years. Only 15% of 2-3 year olds had been to a dentist in the previous 12 months, compared to over 30% of 4-5 year olds. From age 8-9 onwards, over 60% had used dental services in the previous 12 months.
Notes: Population weighted results. For ages 4-5 to 10-11, data from B and K cohorts are pooled where possible. a In Wave 1, dental services were included in 'other medical'. b Only available for B cohort, (n = 4,385). c Only available for K cohort (n = 4,172). d Only available for B cohort (n = 4,048 at age 8-9 and 3,696 at age 10-11). e Percentages are not directly comparable across age groups as not all services are included in each wave.
Source: LSAC waves 1-6, B and K cohorts, weighted
While use of health services depends mainly on the health of the child and their individual needs for services, for some services there are also differences depending on the characteristics of the child and their household. Use of services such as medical attention at a hospital emergency department will depend mainly on whether the child has sustained an injury, or has an illness that requires immediate attention. While pediatrician services are available through the public hospital system, and some children are entitled to free dental services, waiting times for these appointments can be long, and therefore use of services such as dental services, speech therapy and pediatrician services will depend to some extent on the financial resources of the household.
Use of other services, such as maternal and child health services, which are freely available to parents of young children, are likely to depend on parents' awareness of the services that are available to them, as well as ease of access and being able to arrange a suitable appointment time around parents' work and family commitments. The availability of health services in the area where the child resides is also a factor that may influence the use of services, with families living in outer regional or remote areas likely to have more difficulty accessing services than those living in metropolitan areas (AIHW, 2017).
Characteristics related to use of health services in the early years of childhood
In the first year of childhood, parents are encouraged to attend, with their child, regular check-ups with a maternal and child health nurse, with these visits becoming less frequent as children get older. The last check-up is usually before the child starts school. The frequency of visits to other types of medical practitioners, such as GPs and paediatricians, in the early years of childhood will depend mainly on the general health of the child and the need for specific health services. For some services, accessibility may be an issue for families living in regional or remote areas.
Visits to medical practitioners such as paediatricians, dentists and other specialists often involve considerable out-of-pocket expenses. Therefore, it is likely that the frequency of visits will depend, at least to some extent, on household income and whether the family is covered by private health insurance. Knowledge of available services, and how to navigate the, sometimes, complex health system (e.g. getting referrals to medical specialists) may also be a factor influencing the use of health services for some families.
Notes: Random effects logistic regression models, odds ratios reported. * p < .05; ** p < .01; *** p < .001. a B cohort only - Paediatrician not provided as an option for K cohort at Wave 1 (Age 4-5); b Speech therapy not asked at age 0-1; c Dental services included for ages 2-3 and 4-5 only. d Parents' highest level of education refers to the highest level of education of either resident parent. e Equivalised household income refers to household income adjusted for household size. Household income is divided by an equivalising factor (1 for the first adult + 0.5 for all other adults (aged 15 and over) + 0.3 for all children under the age of 15). f Private hospital insurance coverage is measured in 2004. All other variables measured at time of interview. g Parents' rating of their child's health at the time of interview, with 1 meaning 'Excellent', 2 'Very Good', 3 'Good', 4 'Fair' and 5 'Poor'. Over 80% of parents in each wave of LSAC rated their child's health as either 'Very Good' or 'Excellent'.
Source: LSAC waves 1-3, B cohort and Wave 1, K cohort, unweighted
After accounting for other factors, including parents' reports of their child's general health, Table 12.2 shows that, for children aged five and under:
- The odds of having seen a paediatrician in the past 12 months were 1.3 times higher for boys than for girls; the odds of having been to hospital emergency or outpatients were around 1.2 and 1.3 times higher, respectively; and the odds of seeing a speech therapist were 2.9 times higher for boys, compared to girls.2 However, the odds of having had a dental appointment in the past 12 months were 17 percentage points lower for boys, compared to girls. For children with an Indigenous background, the odds of having seen a maternal and child health nurse or a dentist were almost halved, compared to those for non-Indigenous children. On the other hand, the odds of having been to hospital outpatients were 1.5 times higher for Indigenous children.
- With the exception of hospital outpatients, the odds of having an appointment with a medical practitioner were significantly lower for children who spoke a language other than English at home, compared to those who only spoke English. This may be a result of a lack of information about medical services available or other difficulties negotiating the health care system, among parents from non-English speaking backgrounds.
- Compared to children in households in the lowest 25% of equivalised household income:
- The odds of having seen a GP in the past 12 months were 1.3 times higher among children in households in the upper half of the equivalised income distribution.
- The odds of having had an appointment with a maternal and child health nurse were 1.2 times higher for children in families in the second quartile of equivalised household income.
- For other medical services, there were no significant differences according to household income.
- There were significant differences in the odds of having used health services depending on whether the child's family had private hospital insurance coverage. Compared to children whose family did not have private hospital coverage, for those with private hospital insurance:
- The odds of having seen a GP or maternal health nurse were 1.7 and 1.2 times higher, respectively.
- The odds of having seen a dentist were almost doubled.
- The odds of having seen a paediatrician were tripled.
- The odds of having been to hospital emergency or outpatients were reduced by 11 and 29 percentage points respectively.
When thinking about these results, it is important to keep in mind that private hospital insurance coverage is much more common for children in higher income households, with 73% of children in the households in the highest quartile of equivalised household income covered by private hospital insurance, compared to 23% in the lowest quartile. It is also interesting to note that for those with private hospital cover, the odds of using medical services with little or no out-of-pocket expenses, such as GPs and maternal and child health nurses, are also higher. This suggests that among those who choose to purchase private health insurance, there is a higher overall level of use of health services.
- Parents' education is also a significant factor associated with the use of health services. Compared to children whose parents did not have a post-school qualification:
- The odds of having seen a GP, paediatrician and maternal and child health nurse were higher among those with at least one parent with a post-school qualification.
- The odds of using dental services were higher among children with at least one parent with a degree qualification.
- The odds of having been to a hospital emergency ward were significantly lower for children with at least one parent with a degree qualification.
- People living in remote areas of Australia may need to travel long distances to attend health services or receive specialised treatment. Data from the 2014-15 National Health Survey indicate that people living in inner, outer regional or remote areas of Australia were less likely than those in major cities to have visited a GP or a dentist in the last 12 months (ABS, 2017). Estimates using the LSAC data show differences in children's use of health services depending on whether the child lived in a major city or a regional or remote area. Compared to children living in a major city:
- The odds of having seen a maternal and child health nurse were 1.2 times higher for those who lived in an outer regional or remote area.
- The odds of having been to hospital outpatients were 1.3 times higher for those who lived in an outer regional or remote area.
- The odds of having seen a GP were 22 percentage points lower for those who lived in an inner regional area, and were approximately halved for those in outer regional or remote areas.
- The odds of having seen a paediatrician were 17 percentage points lower for those who lived in an inner regional area, and 39 percentage points lower for those in outer regional or remote areas.
Characteristics related to use of health services in the primary school years
As children start school, their needs for medical services change. Visits to the maternal and child health nurse end when children start school, and children are likely to engage in more sports and physical activities than they did in the early years of childhood, which can result in injuries that may require medical attention.3
After accounting for other factors, including parents' reports of the study child's general health, Table 12.3 shows that, for primary school-aged children:
- The odds of having seen a paediatrician or a speech therapist were more than doubled for boys, compared to those for girls; and the odds of going to hospital emergency were 1.2 times higher. The odds of using dental services were 17 percentage points lower for boys, compared to those for girls.
- Compared to non-Indigenous children, the odds of going to the hospital emergency ward, or to the dentist, were significantly lower for children from an Indigenous background.
- Compared to children who only speak English at home, the odds of having seen a paediatrician, speech therapist or dentist were significantly lower for children who spoke a language other than English at home; and the odds of having been to hospital emergency or outpatients were also significantly lower.
- The odds of having been to the dentist in the last 12 months were 1.3 times higher for children with a parent with a degree qualification, compared to those whose parents had no past school qualifications.
- Compared to children in households in the lowest quartile of household income:
- The odds of having seen a GP in the last 12 months were approximately 1.2 times higher for those in households in the top half of the equivalised income distribution.
- The odds of having seen a specialist (other than a paediatrician) were 1.2 times higher for those in households in the top 25% of the equivalised income distribution.
- The odds of having been to the dentist in the last 12 months were 1.1 times higher for those in the second quartile of the equivalised income distribution; 1.4 times higher in the third quartile, and 1.3 times higher for those in the top 25% of the income distribution.
- For children in families with private hospital insurance coverage, the odds of having seen a GP, other specialist, speech therapist or dentist were significantly higher than those of children in households with no private hospital coverage.
Notes: Random effects logistic regression models, odds ratios reported. * p < .05; ** p < .01; *** p < .001. Private health insurance coverage is measured in 2004. All other variables measured at time of interview. Parents' highest level of education refers to the highest level of education of either resident parent. Equivalised household income refers to household income adjusted for household size. Household income is divided by an equivalising factor (1 for the first adult + 0.5 for all other adults (aged 15 and over) + 0.3 for all children under the age of 15).
Source: LSAC waves 4-6, B cohort and waves 2-4, K cohort, unweighted
- As was the case for young children, accessibility of services in regional and remote areas was a significant factor associated with the use of health services. Compared to children living in a major city:
- The odds of having seen a GP in the past 12 months were 32 percentage points lower for those living in inner regional areas and almost halved for those in outer regional or remote areas.
- The odds of having seen a paediatrician were 1.3 times higher for those living in inner regional areas.
- The odds of having been to a hospital emergency ward were 1.2 and 1.3 times higher, respectively, for those in inner regional and outer regional and remote areas. The use of hospital outpatients was also significantly higher among those in outer regional or remote areas. This may be a result of families in regional areas using hospital services as a substitute for GP visits.4 This finding is consistent with estimates of emergency hospital admissions, by remoteness, for the general population, which show that in 2013-14, the rate for emergency hospital admissions involving surgery was highest for people living in very remote areas (22 per 1,000 population) and fell with decreasing remoteness to be lowest among people living in major cities (12 per 1,000).
- Compared to children living in major cities, the odds of having seen a speech therapist or a specialist other than a paediatrician were significantly lower for those in outer regional and remote areas (40 and 21 percentage points respectively). This suggests that access to some specialist services in regional and remote areas may be a problem for some families.
Characteristics related to adolescents' use of health services
With the onset of puberty, the health service needs of adolescents are different to those of younger children. Sports-related injuries become more common, particularly for boys. Issues related to mental health, particularly anxiety, depression and eating problems are also more common among adolescents than they are for younger children. For some teens, decisions about use of health care services may be made together with their parents (e.g. their own choice of GP), rather than by their parents on their behalf.
In the early teenage years, after controlling for other factors, parents' education is not a significant factor associated with the use of medical services (Table 12.4). Only for dental services are the odds of having used the service in the last 12 months higher (1.7 times) for those with at least one parent with a degree qualification, compared to those whose parents had no post-school qualification.
While there was no significant difference in the odds of having used a GP, specialist or psychological or behavioural therapy, the odds of having been to the hospital emergency ward or hospital outpatients were almost doubled for boys compared to girls. As was the case when children were younger, the odds of having seen a dentist in the past 12 months were 24 percentage points lower for boys than for girls.
There were also some differences according to household income. Compared to adolescents in households in the lowest quartile of equivalised household income:
- The odds of having been to the hospital emergency ward were 24 percentage points lower among those in the third quartile of equivalised income.
- The odds of having seen a specialist were 1.4 times higher for those in the highest quartile of the equivalised income distribution.
- The odds of having seen a psychologist or behavioural therapist were significantly lower among adolescents in households in the middle 50% of the equivalised income distribution (2nd and 3rd quartiles).
- The odds of having been to the dentist were around 1.5 times higher among children in households in the top 75% of the equivalised income distribution.
Compared to adolescents in households without private hospital insurance coverage, the odds of having been to the dentist were doubled for those with hospital coverage, and the odds of having seen a specialist were 1.6 times higher.
For GP and dental services, there were differences according to region of residence. Compared to adolescents living in major cities:
- The odds of having seen a GP in the past 12 months were 28 percentage points lower for those living in inner regional areas, and 45 percentage points lower for those in outer regional and remote areas.
- The odds of having used dental services in the past 12 months were 27 percentage points lower for those living in inner regional areas, and 20 percentage points lower for those in outer regional and remote areas.
Notes: Random effects logistic regression, odds ratios reported. * p < .05; ** p < .01; *** p < .001. Private health insurance coverage is measured in 2004. All other variables measured at time of interview. Parents' highest level of education refers to the highest level of education of either resident parent. Equivalised household income refers to household income adjusted for household size. Household income is divided by an equivalising factor (1 for the first adult + 0.5 for all other adults (aged 15 and over) + 0.3 for all children under the age of 15).
Source: LSAC waves 5 and 6, K cohort, unweighted
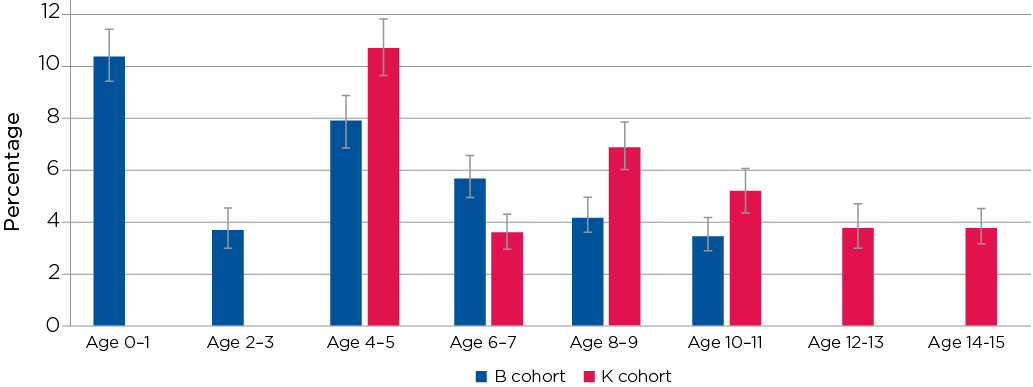
12.2 Medical attention and hospital stays
The percentage of children who had required medical attention from a doctor or hospital due to an injury varied considerably, depending on their age and gender (Figure 12.1).
At age 0-1, 7% of study children had needed medical attention due to an injury. At this age, there were no significant gender differences in the percentage of children needing medical attention for injuries.
However, at age 2-3, the percentage of children who had required medical attention for an injury increased substantially, with 22% of boys and 18% of girls receiving medical attention for an injury in the previous 12 months. Presumably, as children start moving around more and being more adventurous (e.g. on playground equipment), injuries are more likely.
Injuries requiring medical attention were less common at ages 4-5 and 6-7 than they were at age 2-3. At age 6-7, 16% of boys and 13% of girls had received medical attention for an injury at least once in the past 12 months.
From age 6-7, the percentage of children who required medical attention for an injury increased considerably, particularly for boys. By age 14-15, 31% of boys and 21% of girls had required medical attention for an injury in the past 12 months.
Box 12.2: Medical attention due to injury
In each wave of LSAC, the study child's main carer is asked how many times in the previous 12 months the study child needed medical attention from a doctor or hospital because of an injury.
Interviewers were instructed to include hospital casualty/emergency ward or outpatient clinics and, in more remote areas, include care given by a visiting nurse or health centre nurse. They were to exclude medical attention needed because the child was unwell or had an illness (e.g. fever, asthma).
Parents were also asked about the types of injures that had required medical attention, such as broken or fractured bones, burns or scalds, sprains and strains; insect bites or stings, and accidental poisoning.
In Wave 6 (when B cohort children were aged 10-11 and K cohort children were aged 14-15), parents of children who had sustained at least one injury that required medical attention were asked, 'Thinking about the most serious injury in the last 12 months, where did this occur?' They were also asked whether the most recent injury was the result of an accident, if someone else had deliberately caused the injury, or if the study child had deliberately caused the injury to themselves.
Figure 12.1: Medical attention due to Injury, by age and gender
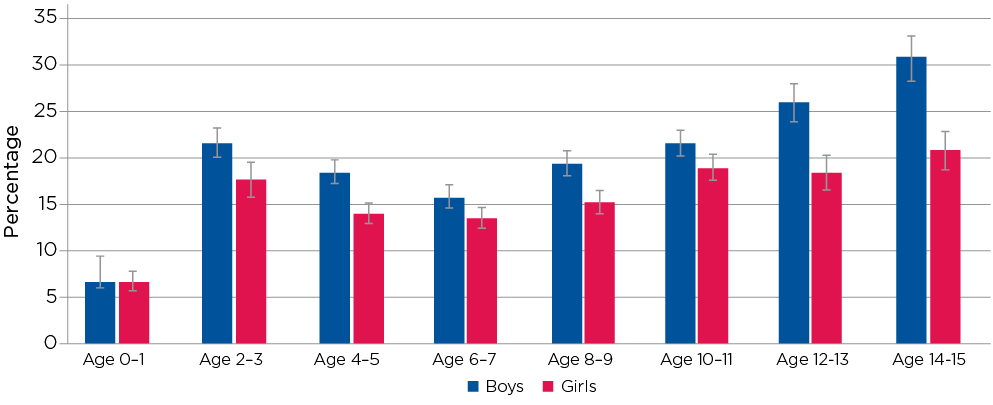
Note: For ages 4-5 to 10-11, data from B and K cohorts are combined. n ranges from 5,106 at age 0-1 to 3,454 at age 14-15.
Source: LSAC waves 1 to 6, B and K cohorts, weighted.
Notes: #Estimate not reliable (Cell size < 20). Gender differences are statistically significant at the 5% level for both age groups. Percentages may not exactly total 100.0% due to rounding.
Source: LSAC wave 6, B and K cohorts, weighted
Among children aged 10-11 who had sustained an injury that required medical attention in the 12 months prior to their LSAC interview in 2014, the most commonly reported location for injuries, for boys and girls, was at school or outside-school-hours care, with around one third of 10-11 year olds being injured in those locations (Table 12.5).
The next most common location for injuries for boys was outside in a public place, followed by at home. For girls, more injuries occurred at home than outside in a public place. One possible explanation for this is that levels of participation in team sports are higher for boys than for girls.5
At age 14-15, over 40% of boys and 30% of girls who had an injury that required medical attention in the past 12 months were injured outside in a public place - a substantial increase from age 10-11, particularly for boys. While a similar proportion of boys were injured at school or outside-school-hours care at ages 10-11 and 14-15 (just over 30%), for girls, the percentage who were injured at school or outside-school-hours care was considerably lower at age 14-15 than at age 10-11 (26% at age 14-15 compared to just over one third at age 10-11). At age 10-11, almost one-quarter of injuries happened at home for boys and girls, while at age 14-15, only 11% of boys and 16% of girls sustained their most recent injury at home.
Among boys and girls aged 14-15 who reported having medical attention due to an injury at least once in the past 12 months, almost all injuries (94%) were reported to be the result of an accident, and around 4% were a result of someone else deliberately causing the injury. However, there was some evidence of self-harm among girls, with 4% of injuries for 14-15 year old girls (but only 1% for boys) reported by parents as something that the study child had done to themselves deliberately. This finding is consistent with those of Daraganova (2017), who used LSAC to investigate self-harm among 14-15 year olds, and found that 4% of boys and 15% of girls had self-harmed in the previous 12 months.
The types of injuries requiring medical attention also varied with the age and gender of the child. Overall, the most common types of injuries requiring medical attention were cuts and scrapes. At ages 2-3 and 4-5, around 10% of boys and 6% of girls had required medical attention for this type of injury. Medical attention for cuts and scrapes became less common as children got older. At age 14-15, only 5% of boys and 3% of girls had needed medical attention for a cut or scrape.
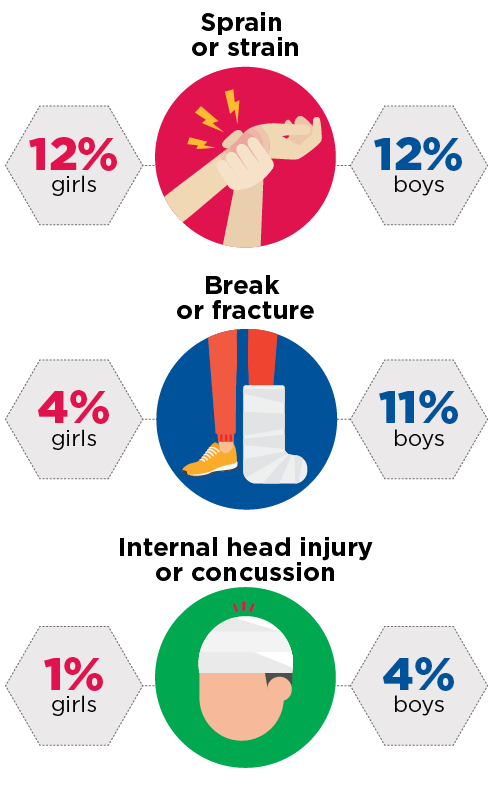
On the other hand, medical attention for broken bones and sprains and strains became more common as children got older. From ages 0-1 to 4-5, the percentage of children who required medical attention for a broken or fractured bone was 3% or lower. At age 14-15, 11% of boys, but only 4% of girls, had required medical attention for a broken or fractured bone in the past 12 months (see Figure 12.2).
Figure 12.2: Medical attention for boys and girls at age 14-15
A recent study of the use of GP services by over 65,000 Australian children and adolescents between 2006 and 2011, found that in the years around puberty, rapid changes in bones and muscle are a key reason the injury rate jumps at this time, with teens at increased risk of injuries when they play sport (Henschke et al., 2014). They suggest that a reason for the higher injury rate among teenage boys is that the growth in weight and muscle bulk makes contact and collision sports more likely to result in injury - especially when there is a mismatch in the size and weight of opposing players.
While more boys than girls required medical attention for broken or fractured bones, there was no significant gender difference in the percentage of boys and girls
who had required medical attention for sprains and strains. Relatively few children required medical attention for sprains and strains in the early years of childhood, but at age 12-13, around 9% of boys and girls required medical attention for a sprain or strain, and at age 14-15, this figure was 12% for boys and girls.
For girls, the percentage who had required medical attention for a concussion or internal head injury was 1% at age 14-15, and less than 1% at younger ages. For boys, these figures were higher, presumably as a result of injuries sustained during contact sports. At age 12-13, 2% of boys had required medical attention for this type of injury in the previous 12 months, and at age 14-15, 4% had required medical attention for concussion. These may seem like small figures, but this represents around 5,000 15-year-old boys across Australia who had required medical attention as a result of concussion over a 12-month period.6
There were also some differences depending on region of residence, with children living in a major city less commonly receiving medical attention for injuries than children who live in regional or remote areas. For example, at age 4-5, 18% of children who lived in a major city had received medical attention for an injury, compared to 21% of children in inner regional areas and 24% in outer regional or remote areas.
One possible explanation for this difference is that children in regional or remote areas are likely to spend more time engaging in active play outside the home, and are therefore more susceptible to injuries. Previous research using LSAC data shows that, at age 8-9, boys and girls living in outer regional and remote areas spent more time outside than those living in major cities but the difference is no more than half an hour per day (Baxter, Hayes, & Gray, 2011). Another possible reason for the higher percentage of injuries in regional and remote areas is that, compared to children living in metropolitan areas, those living in rural areas can be exposed to a variety of additional hazards. Key problem areas identified by the Australian Centre for Agricultural Health and Safety (2009) are increased risk of drowning, injuries associated with (two- and four-wheel) motorcycles and other farm vehicles, horse-related injuries and injuries associated with farm machinery.
Hospital stays as a result of injury
Relatively few children had an overnight hospital stay as a result of an injury in the 12 months prior to their LSAC interview. In the early years of childhood, around 2% of boys and 1% of girls stayed in hospital overnight due to an injury.
While the percentage of adolescents who had stayed overnight in hospital due to an injury was still quite low, the gender difference was statistically significant. At ages 12-13 and 14-15, 3% of boys and 1% of girls had stayed in hospital overnight due to an injury in the previous 12 months.
Box 12.3: Hospital stays due to injury
In each wave of LSAC, primary carers who reported that their child had sustained an injury that required medical attention in the last 12 months were asked: 'In the last 12 months, did (the study child) stay in hospital for at least one night because of this injury/these injuries?'
Those who reported that the child had stayed in hospital due to an injury were asked how many times in the last 12 months the child had been to hospital for an injury.
Hospital stays for reasons other than injuries
The percentage of children who had stayed in hospital overnight for reasons other than injuries declined with age - from 10% of 0-1 year olds to 3% of 14-15 year olds.7 At age 0-1, there were no significant gender differences in the percentage of children who had non-injury related hospital admissions. However, from ages 2-3 to 8-9, the percentage of boys who had stayed in hospital overnight for reasons other than injury was significantly higher than that for girls (Figure 12.3).
From ages 10-11 to 14-15, only 3-4% of children had stayed in hospital for reasons other than injuries; and there was no significant gender difference in the percentage of children who had non-injury related hospital stays.
Box 12.4: Hospital stays for reasons other than injuries
In each wave of LSAC, the study child's main carer was asked about any hospital stays for reasons other than injuries. The question asked: 'Not including injuries, in the last 12 months, did the study child stay in hospital for at least one night for any (other) reason?'
Interviewers were instructed to clarify that this did not include hospital outpatient or emergency departments.
Figure 12.3: Hospital stays for reasons other than injuries, by age and gender
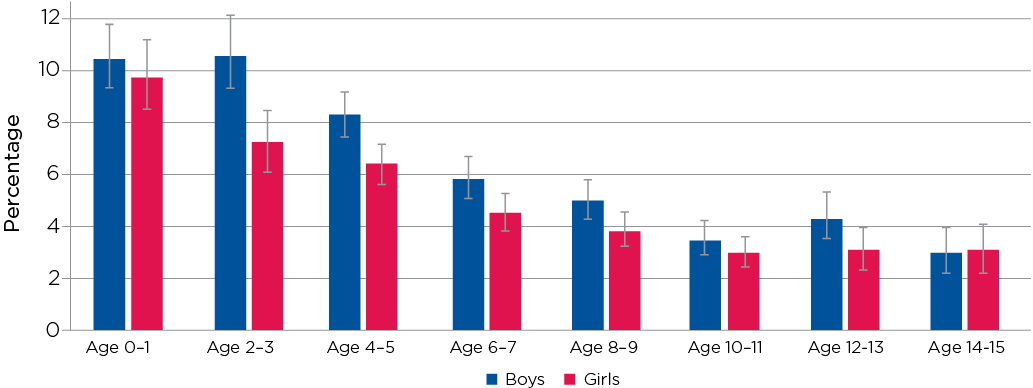
Notes: For ages 4-5 to 10-11, data from B and K cohorts are combined. n ranges from 5,106 at age 0-1 to 3,454 at age 14-15.
Source: LSAC waves 1-6, B and K cohorts, weighted
12.4 Use of prescription medicine
Box 12.5: Use of prescription medicine
At each LSAC interview, the study child's main carer was asked, 'Does the study child currently need or use medicines prescribed by a doctor, other than vitamins?'
Those who said that their child was currently using prescription medicine were asked if the child was using that medicine because of any medical, behavioural or other health condition, and if that condition had lasted, or was expected to last, for at least 12 months.
As children got older, the proportion who needed medicine prescribed by a doctor increased with age - from around 13% of children under the age of 8-9 to 19% of 14-15 year olds in 2014.
For the majority of children who were using prescription medicine (over 70% from age 2-3 onwards), the condition that was being treated was an ongoing one that had lasted for at least 12 months.
From age 0-1 to age 12-13, the percentage of study children who were using prescription medicine was higher for boys than for girls. This gender difference was statistically significant across all age groups except for ages 2-3 and 12-13 (Figure 12.4). However, at age 14-15, the percentage of girls who were using prescription medicine was higher for girls than for boys. Although this difference was not statistically significant, it suggests that, for girls, health care needs and reasons for using prescription medicine change substantially in the teenage years.
Figure 12.4: Use of prescription medicine, by age and gender
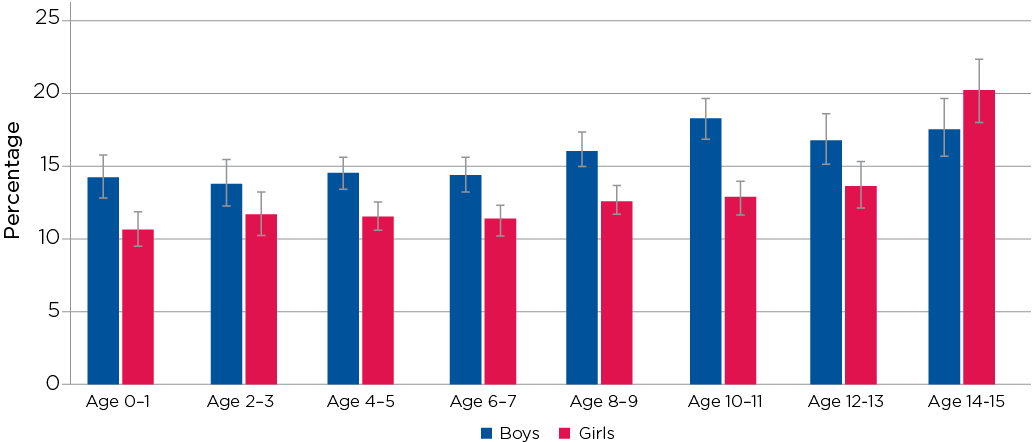
Notes: For ages 4-5 to 10-11, data from B and K cohorts are combined. n ranges from 5,106 at age 0-1 to 3,453 at age 14-15.
Source: LSAC waves 1-6, B and K cohorts, weighted
12.5 Access to health care services
Difficulties accessing services are likely to be related to a variety of factors, including the cost of services, location and availability of services (particularly in regional and remote areas), as well as knowledge of services and how to navigate complicated systems and referral processes. For some, concerns about confidentiality and poor previous experiences with health practitioners may be a barrier to accessing health services (Cummings & Kang, 2012). Using the LSAC data, we are able to examine parents' reports of difficulties gaining access to health services; and the factors associated with those difficulties.
Box 12.6: Difficulties accessing health services
In addition to questions about the use of health services, primary carers are asked about difficulties gaining access to health services.
In Wave 2 of LSAC, primary carers were asked only if they had difficulties accessing services. In all other waves, they were asked about difficulties accessing the specific services that they were asked about using. That is, for each of the services listed in Table 12.1, parents were asked, 'In the last 12 months, have there been any of the services listed that the study child has needed but could not get?' It is therefore important to note that the percentages of parents reporting difficulties accessing health care services are not directly comparable across waves or cohorts.
Relatively few parents reported having problems accessing health services (Figure 12.5). At age 0-1, just over 10% of parents reported difficulties accessing health services, and the most common difficulty was access to GPs, with 2.8% of parents reporting this difficulty.
The percentage of parents of 4-5 year olds who reported problems with access to services was higher for the K cohort in 2004 (11%) than for those in the B cohort in 2008 (8%). The most common services that parents reported experiencing difficulties with when their children were aged 4-5 were GPs and speech therapists.
For parents of 6-7 year old children (in the K cohort in 2006), difficulties with access to speech therapists and dental services were the most commonly reported issues; and for the K cohort children from age 8-9 onwards, problems with access to dental services was the most commonly reported issue. However, it is important to keep in mind that less than 2% of parents in each wave reported difficulties accessing dental services.
While difficulties accessing services were relatively uncommon, there were some characteristics associated with the likelihood of reporting these difficulties (Table 12.6). For example:
Figure 12.5: Difficulties accessing health services by age of the study child
Notes: For ages 4-5 to 10-11, data from B and K cohorts are combined. n ranges from 5,106 at age 0-1 to 3,453 at age 14-15. As specific health services asked about differed by wave of LSAC (and were not asked at all in Wave 2), these percentages are not directly comparable across waves or cohorts.
Source: LSAC waves 1-6, B and K cohorts, weighted
Notes: Random effects logistic regression, odds ratios reported. Private health insurance coverage is measured in 2004. All other variables measured at time of interview. Parents' highest level of education refers to the highest level of education of either resident parent. Equivalised household income refers to household income adjusted for household size. Household income is divided by an equivalising factor (1 for the first adult + 0.5 for all other adults (aged 15 and over) + 0.3 for all children under the age of 15).
Source: LSAC waves 1-6, B and K cohorts (for early years, B cohort waves 1-3 and K cohort Wave 1; for primary school, B cohort waves 3-6 and K cohort waves 2-4; for adolescence, K cohort Waves 5 and 6), unweighted.
- Across all ages, the odds of reporting difficulties accessing health services were higher for parents of boys then for girls. This is presumably due to a higher level of demand for some services. For example, in the early years of childhood and also in the primary school years, use of speech therapy services was significantly higher for boys than for girls.
- In the early years of childhood, but not for school-age children or adolescents, the odds of reporting difficulties accessing health services were significantly (1.3 times) higher among those who spoke a language other than English at home, compared to those who only spoke English.
- Compared to families in the lowest quartile of equivalised household income, the odds of having difficulties accessing health services were significantly lower for those in the top half of the income distribution. This difference was especially evident for adolescents, with the odds of reporting difficulties with access 56 percentage points lower for those in the top half of the income distribution, compared to those in the lowest income quartile.
- Across all age groups, the odds of access difficulties were around 25 percentage points lower for those who had private hospital insurance coverage (in 2002), compared to those who did not.
- For primary school-aged children and also adolescents (but not for children in the early years of childhood) there were significant differences in the odds of reporting difficulties accessing health services, according to region of residence. Compared to families living in a major city, the odds of reporting access difficulties were significantly higher for those in inner regional areas; and higher again for those living in outer regional or remote areas. This finding is consistent with research from the AIHW (2017), which shows that people living in remote and very remote areas generally have poorer access to, and use of, health services than people in regional areas and major cities.
Summary
This chapter has provided a picture of Australian children's health service usage from ages 0-1 and 4-5, in 2004, to ages 10-11 and 14-15, in 2014. The LSAC data show that the levels of use of health care services change as children get older and health service needs change. Use of some services, such as dental services, which can incur significant out-of-pocket expenses, are related to household income and private health insurance coverage. For other services, usage levels are higher for boys than for girls, simply because boys more commonly experience some specific health issues, such as speech and hearing difficulties.
In the early years of childhood, and also when children are in primary school, parents' education is a significant factor related to children's use of health services, as is whether a language other than English is spoken at home. This suggests that for some parents, access to health services may be limited by a lack of information about the types of services available and a lack of knowledge of how to access specific health services. Differences in health service usage among children who live in regional or remote areas, compared to those living in major cities, suggests that for some services, particularly specialists, families in regional and remote areas can face difficulties with access.
The percentage of children who had required medical attention due to an injury (and also the types of injuries sustained) varied considerably depending on the age and gender of the study child. In the early years of childhood, the most common injuries were cuts and scrapes but as children got older, medical attention for broken bones and sprains and strains became more common. For teenage boys, concussions were also an issue of concern, with 4% of 14-15 year old boys requiring medical attention for concussion or internal head injury in the past 12 months. While most injuries were the result of an accident, or unintentional, around 4% of 14-15 year old boys and girls were injured by another person; and, for girls, 4% of injuries requiring hospitalisation were the result of self-harm.
In terms of access to health services, the LSAC data show that while most parents report no difficulties with access, some parents do have difficulties. As might be expected, difficulties accessing health services were more common among families in regional and remote areas than for those living in metropolitan areas. There is also some evidence of difficulties as a result of the cost of health services, with families in the lowest quartile of equivalised income more likely to report trouble with accessing services. Finally, knowledge about how to access services also appears to be a factor. Among families with young children, those who spoke a language other than English were more likely to have reported difficulties accessing health services.
References
Australian Bureau of Statistics (ABS). (2013). Australian Health Survey: Health Service Usage and Health Related Actions, 2011-12. ABS Cat. No. 4364.0.55.002. Canberra: ABS.
ABS. (2017). Australian Health Survey: Health Service Usage and Health Related Actions, 2014-15. ABS Cat. No. 4364.0.55.002. Canberra: ABS.
Australian Centre for Agricultural Health and Safety. (2009). Child safety on farms: A practical guide. Sydney: The University of Sydney. Retrieved from sydney.edu.au/medicine/aghealth/uploaded/fs_docs/guidance/Child_Safety_on_Farms.pdf
Australian Dental Association (ADA). (2016). When should my child first see the dentist? St Leonards, NSW: ADA. Retrieved from www.ada.org.au/getattachment/Your-Dental-Health/Resources-for-Profession...
Australian Institute of Health and Welfare (AIHW). (2015). Health expenditure Australia 2013-14 (Health and welfare expenditure series no. 54). Cat. no. HWE 63. Canberra: AIHW.
AIHW. (2017). Rural and remote health (Web report). Canberra: AIHW.
Baxter, J., Hayes, A., & Gray, M. (2011). Families in regional, rural and remote Australia (Research Summary). Melbourne: Australian Institute of Family Studies. Retrieved from aifs.gov.au/publications/families-regional-rural-and-remote-australia
Black, L. I., Vahratian, A., & Hoffman H. J. (2015). Communication disorders and use of intervention services among children aged 3-17 years: United States, 2012 (NCHS data brief, no. 205). Hyattsville, MD: National Center for Health Statistics.
Cummings, M., & Kang, M. (2012). Youth health services: Improving access to primary care. Australian Family Physician, 41(5), 339-341.
Daraganova, G. (2017). Self-harm and suicidal behaviour of young people aged 14-15 years old. In Australian Institute of Family Studies (Eds.), The LSAC Annual Statistical Report 2016 (pp. 119-144). Melbourne: Australian Institute of Family Studies.
Department of Education. (2017). Maternal & Child Health Services Annual Report 2015-2016. Melbourne: Department of Education. Retrieved from www.education.vic.gov.au/Documents/childhood/providers/support/2015-16Vi...
Henschke, N., Harrison, C., McKay, D., Broderick, C, Latimer, J., Britt, H., & Maher, C. (2014). Musculoskeletal conditions in children and adolescents managed in Australian primary care.MC Musculoskeletal Disorders, 15, 164.
National Health Performance Authority. (2015). Australians' experiences with access to health care in 2013-14. Canberra: National Health Performance Authority. Retrieved from www.myhealthycommunities.gov.au/publications/redirecttoreport?reportCode...
1 There were some significant cohort differences, with higher levels of use of hospital outpatient services among children in the K cohort at ages 4-5 and 6-7; higher levels of use of GP services among B cohort children at ages 4-5, 8-9 and 10-11 but lower levels of GP service use for B cohort children at age 6-7. Use of dental services was significantly higher among K cohort children at ages 6-7 and 10-11. Psychological and behavioural therapy services were more commonly used among B cohort children at ages 6-7, 8-9 and 10-11. At age 8-9, use of phone or internet health services were higher for the B cohort. Paediatricians were more commonly used for children in the K cohort at age 8-9 but more common for the B cohort at age 10-11. In most instances, while cohort differences were statistically significant, the size of the differences ranged from 1 to 4 percentage points.
2 A United States study by Black, Vahratian, and Hoffman (2015) shows that boys aged 3-17 are more likely than girls to have a voice, speech, language or swallowing disorder (9.6% compared to 5.7%).
3 Refer to Chapter 9 on outside school hours care and extracurricular activities in this report for a description of how participation in sports and other extracurricular activities changes as children get older.
4 A 2015 study by the National Health Performance Authority (2015) has shown connections between the lack of access to GPs and the number of people visiting emergency departments, particularly in rural areas, where 'there is less distinction drawn between going to see your GP if you had an acute problem and going to the hospital, where you might be seen by a GP anyway.'
5 For further details about participation in team sports and other activities, refer to chapter 9 on outside-school-hours care and extracurricular activities in this report.
6 At Wave 6 of LSAC, study children were aged 14 or 15. However, the sample is not representative of 'all 14 and 15 year olds in 2014'. Study children in the K cohort were born between March 1999 and May 2000, and the majority were aged 15 at the time of interview.
7 Parents were asked the specific reason for the most recent (non-injury related) hospital stay. Options included fevers, viral illnesses, asthma, gastroenteritis, grommets, tonsillectomy. However, the number of observations for specific health conditions were too small for reliable estimates.
Acknowledgements
Featured image: © GettyImages/RawPixel
Publication details
Download Publication
Share


