6. Risky driving among Australian teens
6. Risky driving among Australian teens
Key messages
Although the road toll has significantly decreased in recent decades, more than 1,000 people are killed on Australian roads each year; and over 30,000 are seriously injured (Bureau of Infrastructure, Transport and Regional Economics [BITRE], 2018). Young drivers continue to be over-represented among road crash victims - more than one in five drivers killed in 2016 were aged 17-25 years (BITRE, 2018), and one in four drivers seriously injured belonged to this age group (BITRE, 2019).
Drivers are at their highest risk of being involved in a crash during their first year of driving unsupervised (Lee, Simons-Morton, Klauer, Ouimet, & Dingus, 2011; VicRoads, 2005). A range of factors have been linked to the higher rate of injuries and deaths among young drivers. These include driver inexperience (Braitman, Kirley, McCartt & Chaudhary, 2008), risky driving behaviours such as speeding and driving without a seatbelt (Ivers et al., 2009), driving more frequently at high-risk times (e.g. at night), and driving smaller and/or older vehicles with fewer safety features (CARRS-Q, 2017).
Research suggests that the areas of the brain concerned with impulse control, planning and decision making are still developing in teenagers, which may contribute to their engagement in risky or impulsive behaviours (Paus, 2005; Sowell, Thompson, Holmes, Jernigan, & Toga, 1999). Inexperienced drivers commonly underestimate the risks associated with particular driving behaviours or situations and overestimate their capacity to deal with them, which can result in them driving in a dangerous manner (Braitman et al., 2008, Cavallo & Triggs, 1996). As peer relationships are particularly important to teens, young drivers may also perceive greater peer pressure to take risks on the road compared to older drivers (Scott-Parker, Watson, King, & Hyde, 2014).
While a number of Australian studies have looked at risky driving among young drivers (e.g. Department of Infrastructure, Regional Development and Cities, 2018; Ivers et al., 2009; Scott-Parker & Oviedo-Trespalacios, 2017), each study has examined different age groups and used different measures, making it difficult to obtain a consistent picture of how common risky driving is among young drivers. Few studies have specifically looked at the prevalence of risky driving among learner drivers, presumably because crash rates are lower among this group, as most learner drivers are driving in low-risk supervised conditions (Williams, 2006). Nevertheless, this is an important period in young people's driving careers - when driving habits and attitudes are being formed and they may be more receptive to change.
In 2016, when aged 16-17, LSAC study teenagers (K cohort) were asked about their experiences of risky driving. At this age, many would be expected to be learning to drive, or just starting to drive independently, as many teenagers take up the opportunity to learn to drive as soon as they are permitted to. This chapter provides a snapshot of adolescents' engagement in risky driving behaviours, with comparisons made between learner, provisional and unlicensed drivers. Four main types of risky driving are examined: (1) speeding; (2) driving when fatigued ('drowsy driving'); (3) driving when affected by alcohol or illegal drugs ('drink or drug driving'), and (4) driving without a seatbelt/helmet (if riding a motorcycle). Characteristics associated with the engagement in risky driving behaviours are also examined. Study teenagers' experiences of being a passenger of a driver under the influence of alcohol or drugs are also investigated.
6.1 Getting a licence
In most Australian states and territories, young people can start learning to drive a car under supervision at age 16, and can obtain a provisional or probationary car licence (P-plates) at age 17. The exceptions to this are the Australian Capital Territory, where teenagers can start learning to drive a car at 15 years 9 months; the Northern Territory where drivers can get their P-plates as early as 16 years 6 months; and Victoria, where drivers cannot obtain their P-plates until age 18.
Box 6.1: Licensing
In 2016, when the K cohort were aged 16-17, they were asked whether they held a licence or permit to drive a car or other vehicle (including a motorcycle or moped). Respondents were asked to choose the option that applied best to them:
- I have a learner driver's permit (i.e. Ls, L1s, L2s).
- I have a provisional/probationary driver's licence (i.e. Ps, P1s, P2s).
- I have a full driver's licence.
- I do not hold any driver's permit/licence.
This item was designed for LSAC.
The LSAC data show that for 16-17 year olds in 2016 (n = 2,929):
- more than two thirds (68%) had their learner's permit (or L-plates)
- one in 10 (11%) held a probationary or provisional driver's licence (hereafter referred to as P-platers)
- about one in five (21%) did not hold a driver's permit or licence of any type
- less than 1% had a full licence.1, 2
Young people's age, where they lived, whether they had a job and if they were still at school were related to the type of licence they held (Table 6.1). Compared to those who were not employed, a higher proportion of teenagers who had a job had their P-plates or were learning to drive.
Notes: n = 2,929 for all measures except education (n = 2,863) and employment (n = 2,880). Percentages may not add exactly to 100% due to rounding. ref. = reference category. * indicates significant difference (at the 5% level) in the percentage of drivers within a licence status category (e.g. learner drivers) that reported a particular characteristic compared to the reference category, based on confidence intervals. Where 95% confidence intervals for the groups being compared do not overlap, this indicates that the differences in values are statistically significant. # Estimate not reliable (cell count <20).
Source: LSAC Wave 7, K cohort, weighted
The percentage of learner and P-plate drivers in each state or territory differed in line with their licensing schemes, with the highest percentage of P-platers from the Northern Territory (which has the lowest minimum licensing age), and the highest percentage of learner drivers from Victoria (which has the highest minimum licensing age). It is important to note that as the proportion of P-platers and learner drivers from each state and territory differed, the findings reported in this chapter may be more representative of drivers in some states or territories than others.3
The area in which a teen lived was also related to the type of licence they held. One in seven teens living in inner regional areas had their P-plates compared to about one in 10 teens in major cities, and about one in four teens living in major cities were unlicensed compared to only one in seven in outer regional or remote areas. Poorer access to public transport in regional and remote areas (Rosier & McDonald, 2011) may have contributed to these differences.
6.2 Risky driving
Risky driving behaviours often contribute to road crashes (Scott-Parker & Oviedo-Trespalacios, 2017). As mentioned earlier, given the lack of research, there is a need for more studies examining the prevalence of risky driving among young Australian drivers, and more specifically, those in the very early stages of their driving careers.
Three risky driving behaviours that place young people at particularly high risk of being involved in serious crashes are:
- speeding, which affects a driver's ability to react to unexpected road events and take evasive action if needed (Aarts & Van Schagen, 2006; Liu, Chen, Subramanian, & Utter, 2005)
- driving when fatigued ('drowsy driving'), which can affect driver attention, judgement, reaction time and, in some cases, cause a driver to fall asleep and crash (Dobbie, 2002)
- driving under the influence of alcohol or other drugs ('drink or drug driving'), which affects how a driver thinks and feels, the speed at which they react, as well as their hand-eye coordination (Drummer, 2008; Moskowitz & Fiorentino, 2000).
Additionally, driving without a seatbelt (or helmet if riding a motorcycle), places drivers and passengers at greater risk of being injured or killed, if they are in a crash. An American study found that almost half of all 16-year-old drivers involved in a fatal motor vehicle crash had not been wearing a seatbelt (Gonzales, Dickinson, DiGuiseppi, & Lowenstein, 2005).
Box 6.2: Risky driving
In 2016, LSAC study teenagers in the K cohort (aged 16-17) were asked: 'Try to remember the last 10 times you drove a car or other vehicle. On how many occasions have you done any of the following?
- Drove up to 10km/h over the limit
- Drove between 10 and 25km/h over the limit
- Drove more than 25km/h over the limit
- Drove when probably affected by alcohol
- Did not wear a seat belt at all (or helmet if riding a motorbike)
- Did not wear your seat belt for part of the trip (or helmet if riding a motorbike)
- Drove when very tired
- Drove when probably affected by an illegal drug.'
Items taken from the Australian Temperament Project (Vassallo et al., 2007).
Prevalence of risky driving by licence type
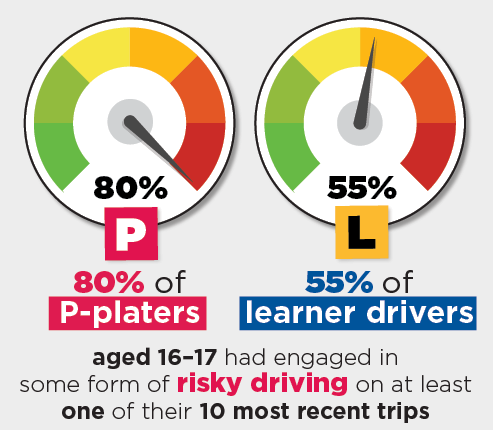
Most P-platers (almost eight in 10) and more than half of learner drivers aged 16-17 had engaged in some form of risky driving on at least one of their 10 most recent driving trips (Table 6.2).
P-platers were significantly more likely than learner drivers to engage in most forms of risky driving, which is not surprising when you consider that learner drivers (except motorcyclists) are required to drive under supervision and typically have less exposure to high-risk driving situations (e.g. driving at night, or when distracted by friends or mobile phones) that may lead to them engaging in dangerous driving behaviours (Whelan & Oxley, 2007).
Additionally, more than one in 10 teenagers without a licence or permit had engaged in some form of risky driving behaviour on a recent driving trip, although rates of most behaviours were low among this group. This group may have included teenagers who had never held a licence or learner's permit and those whose licence or permit had been cancelled or suspended.4
The most common types of risky driving among drivers aged 16-17 years were speeding and driving when very tired (Table 6.2). About seven in 10 P-platers and four in 10 learner drivers said that they had exceeded the speed limit by up to 10 km/h on at least one recent trip, as had one in 15 unlicensed drivers. Speeding - even by low margins - places drivers at increased risk of being involved in a crash (Alavi, Keleher, & Nieuwesteeg, 2014). While this behaviour may be deliberate, it may also result from driver inattention (Department for Transport, Energy and Infrastructure, 2010) or difficulties maintaining vehicle speed - an issue more common among inexperienced drivers (Cavallo & Triggs, 1996).
Speeding by moderate levels (10-25 km/h) was also relatively common. About one in three P-platers and one in six learner drivers aged 16-17 had exceeded the speed limit by this margin. However, few unlicensed drivers (less than one in 20) reported that they had.
One in two P-platers and one in four learner drivers reported having driven when very tired on a recent trip. Once again, this may not be due to deliberate risk-taking on the part of these drivers. It may reflect their busy lifestyles, with many young people juggling work, study and/or extracurricular commitments, and driving at night to get to and from work or to socialise (CARRS-Q, 2017). 'Drowsy driving' was very uncommon among unlicensed drivers.
Notes: Sample was restricted to those respondents who answered all eight risky driving questions. a Indicates significant difference (at the 5% level) in the percentage of learner drivers or P-platers who reported engaging in the risky driving behaviour (as compared to the percentage of those without a licence/permit), based on confidence intervals. Where 95% confidence intervals for the groups being compared do not overlap, this indicates that the differences in values are statistically significant. b Indicates significant difference (at the 5% level) in the percentage of P-platers and learner drivers who reported engaging in the risky driving behaviour, based on confidence intervals. # Estimate not reliable (cell count <20).
Source: LSAC Wave 7, K cohort, weighted
Figure 6.1: 16-17 year olds who engaged in risky driving on at least one of their 10 most recent trips
Credit: Longitudinal Study of Australian Children 2019 (creativecommons.org/licenses/by/4.0/)
While most 16-17 year olds reported wearing their seatbelt when driving (or helmet if riding a motorcycle), 6-8% had driven without a seatbelt (or helmet) at all; and a similar percentage (6-9%) had driven without a seatbelt (or helmet) for part of a trip. Although it is difficult to make comparisons between the LSAC findings and other studies due to sample and measure differences, these rates are similar to those found in other Australian studies. For instance, 8% of Queensland drivers reported not wearing seatbelts (Department of Transport and Main Roads, 2015) as did 9% of Victorian drivers aged 19-20 (Vassallo et al., 2007).
While failure to wear a seatbelt or helmet may indicate deliberate risk-taking by the driver, seatbelt use is largely considered to be habitual (CARRS-Q, 2016). It was interesting to note that P-platers, learner drivers and teenagers without a licence or learner's permit did not significantly differ in their rates of seatbelt (or helmet) use. Unfortunately, information was not collected on the contexts in which these risky behaviours occurred; that is, whether parents or friends were present when this behaviour took place. Research suggests that parents and peers influence a young person's involvement in risky driving behaviour (Scott-Parker et al., 2014).
Other forms of risky driving such as drink and drug driving were uncommon, particularly among learner and unlicensed drivers, which is understandable given that alcohol and other drug use are prohibited among this age group, as is driving under the influence of these substances.
Half of 16-17 year olds (51%) had engaged in no risky driving behaviour.
Number of trips risky drivers engaged in these behaviours
The following section focuses on the frequency with which teens who engaged in a particular form of risky driving (e.g. drowsy driving), did so. As the percentage of 16-17 year olds who engaged in each behaviour varied greatly, so do the sample sizes for each item (see Table 6.2).
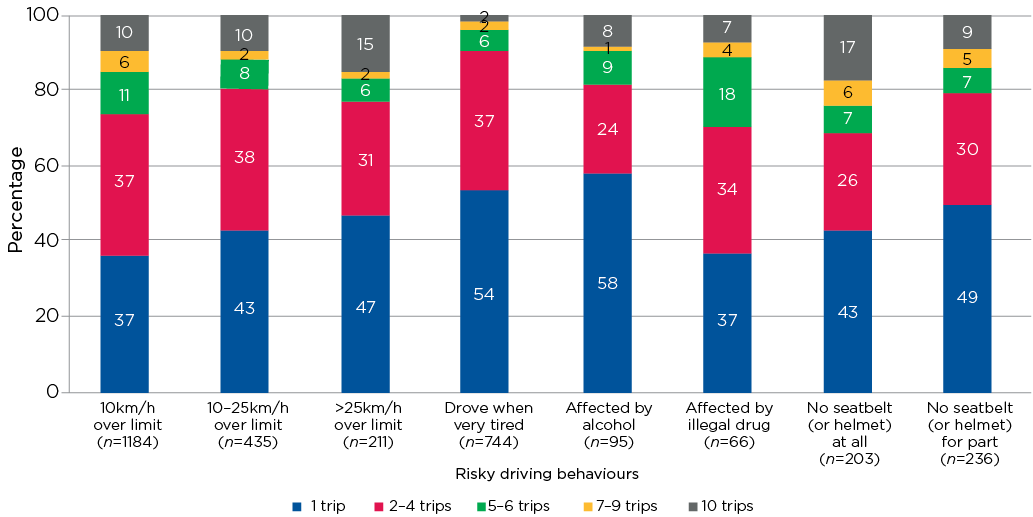
A considerable proportion of those who engaged in each risky driving behaviour (generally between 40% and 50%) only did so on one of their 10 most recent trips (Figure 6.2).
In contrast, a small but notable proportion engaged in these risky driving behaviours on every trip. For example, close to one in five teens who failed to wear a seatbelt at all when driving (or helmet if riding) had done so on all of their past 10 trips, as had one in six teens who had exceeded the speed limit by over 25 km/h. These findings suggest that engagement in risky driving behaviours such as speeding and driving without a seatbelt may be habitual for some.
Teens who engaged in low-level speeding and driving when affected by an illegal drug most commonly reported doing so on multiple trips.
While it would have been interesting to compare frequency of risky driving by licence type, we had concerns about the accuracy of the resulting estimates due to the small number of unlicensed and P-plate drivers who had engaged in some forms of risky driving. Nevertheless, the information presented here is still valuable given the relative lack of Australian prevalence data on risky driving among this age group.
Figure 6.2: Number of trips (in past 10) by those who engaged in each risky driving behaviour
Note: Sample numbers varied between items, with the sample for each item being restricted to respondents who had engaged in the behaviour of interest at least once in their past 10 trips.
Source: LSAC Wave 7, K cohort, weighted
Credit: Longitudinal Study of Australian Children 2019 (creativecommons.org/licenses/by/4.0/)
Characteristics of risky drivers
Previous research suggests that young people who take risks on the road tend to differ from other drivers on various characteristics. A study of 1,135 young Australian drivers found that young people aged 19-20 who engaged in risky driving were more likely to be male; have a less persistent temperament style; be more aggressive and hyperactive; be less cooperative; engage in antisocial behaviour and have friends that also did so; react explosively or use drugs to cope with stress; and have experienced more problems at school and in their relationships with their parents (Vassallo et al., 2007).
Using LSAC data, the characteristics of 16-17 year olds who engaged in different types of risky driving (speeding, drowsy driving, not wearing a seatbelt or helmet while driving/riding and drink and drug driving) were examined. The findings discussed relate to all 16-17 year olds, regardless of licence type, due to concerns about the precision of separate estimates by licence type.5 Such information is nonetheless valuable, given the need for more Australian research on risky driving among teenagers.
While acknowledging that characteristics not available in the LSAC dataset may also be associated with risky driving behaviour (e.g. vehicle type, amount and type of driving exposure), the LSAC data suggest that a range of demographic characteristics, personal attributes and peer and family characteristics are associated with teens' engagement in risky driving behaviour at 16-17 years.
Even after taking into account a range of other factors, alcohol and marijuana use were significantly linked to all types of risky driving behaviour, but particularly drink and drug driving (Table 6.3). Alcohol use was also strongly linked with drowsy driving and speeding among 16-17 year olds, while marijuana use was strongly related to failure to wear a seatbelt (or motorcycle helmet). These findings are consistent with a large body of research which suggests that many young people who take risks when driving also engage in other forms of risky behaviour, and that the use of alcohol and drugs often contributes to their risky driving behaviour (Mallick, Johnston, Goren, & Kennedy, 2007, Vassallo et al., 2008).
Licence type was also related to engagement in risky driving behaviour. Compared to learner and unlicensed drivers, P-platers had odds 2.5 to 3.5 times higher of engaging in all forms of risky driving except driving without a seatbelt or helmet. As noted earlier, rates of non-seatbelt use did not significantly differ between learners, P-platers and unlicensed drivers.
Where drivers lived also mattered. Compared to teens living in major cities, those living in outer regional and remote areas had odds 2.6 times higher of driving without a seatbelt (or helmet, if riding), while those in inner regional areas had higher odds of speeding. These findings are consistent with prior research that suggests that the non-use of restraints is a greater issue among rural than metropolitan drivers (Department of Transport, Planning and Infrastructure, 2014; Steinhardt, Sheehan, Siskind, & Edmonston, 2012).
Focusing on specific types of risky driving, lifestyle factors seemed particularly pertinent for drowsy driving, with young people who were employed and/or attending school having a higher likelihood of driving when very tired. As discussed earlier, it is likely that the pressures of juggling school, work and extracurricular demands and, for some, the need to drive at night to get to and from work, contributed to these findings. Unfortunately, information was not collected about the times at which teens drove, so we are not able to test these hypotheses with the LSAC data.
In contrast, parent legal problems were uniquely associated with not wearing a seatbelt (or motorcycle helmet). Teenagers whose parents had problems with the police or appeared in court during the past year had odds 2.5 times higher of driving without a seatbelt (or helmet, if riding a motorcycle).
Teens with high levels of conduct problems (e.g. stealing, lying) had a higher likelihood of engaging in risky driving behaviours that were likely to be intentional, namely, failing to wear a seatbelt or helmet, and/or drink and drug driving. These findings are consistent with other studies that have found that young people who engage in disruptive or antisocial behaviours are more likely to engage in risky driving behaviour as well (Jessor, Turbin, & Costa, 1997; Vassallo et al., 2008).
After controlling for other factors, gender was significantly associated with speeding, but not with other forms of risky driving. Males had somewhat higher odds than females of exceeding the speed limit (OR = 1.3). This finding is interesting, given that gender has been strongly linked to risky driving in many studies (CARRS-Q, 2017; Ivers et al., 2009). Another unique predictor of speeding was neuroticism. Young people who scored highly on neuroticism had lower odds of speeding (about 26% lower). These findings differ from some other studies, which have shown neuroticism to be a risk factor for risky driving (Dahlen & White, 2006; Wang, Qu, Ge, Sun, & Zhang, 2018).
Notes: Odds ratios estimated using logistic regression. *** p < .001, **p < .01, *p < .05. Sample restricted to respondents who had answered all eight risky driving questions (n = 2,699). ref. = reference category. Personality traits were assessed using the 10 item Big Five Inventory (BFI-10; Rammstedt & John, 2007). Personality traits included in these analyses included extraversion ('I see myself as someone who is outgoing, sociable'); agreeableness ('I see myself as someone who is generally trusting'); conscientiousness ('I see myself as someone who does things carefully and completely'), and neuroticism ('I see myself as someone who gets nervous easily'). Openness was not included in these analyses as it was not found to be significantly related to any forms of risky driving. Behaviour problems were assessed using the conduct problems and hyperactivity subscales of the Strength and Difficulties Questionnaire, Self-Report Version (SDQ; Goodman, 2001). Participants were classified as having conduct problems or being hyperactive if they had elevated scores on these measures as per scale cut-offs (4+ for conduct problems, 6+ for hyperactivity) compared to participants whose scores were within the 'average' range (i.e. below these cut-offs).
Source: LSAC Wave 7, K cohort, weighted
6.3 Driving under the influence
Driving under the influence of illicit drugs is prohibited within Australia, and limits are in place regarding the amount of alcohol drivers may have in their bodies. These limits are particularly strict for learner and P-plate drivers who are required, by law, to have a zero blood alcohol concentration (BAC). Nevertheless, young drivers are over-represented among those seriously injured or killed in crashes where alcohol is a contributing factor (Centre for Road Safety, 2017).
Approximately 4% of 16-17 year olds in the LSAC K cohort reported driving under the influence of alcohol or drugs (hereafter referred to as DUI) within the past 12 months. This finding is noteworthy given that the majority of respondents were learner drivers, who are required to drive under supervision (if driving a car), or unlicensed.
Box 6.3: Driving under the influence
When LSAC study teenagers in the K cohort were aged 16-17 they were asked: 'During the last 12 months …
- Did you drive a car or other vehicle while under the influence of alcohol or drugs (Yes/No)?
- Have you been a passenger in a car or other vehicle when the driver was under the influence of alcohol or drugs (Yes/No)?'
If they answered 'yes' to having been a passenger of a driver who was under the influence, they were asked: 'Was the driver:
- A friend about the same age
- A brother/sister/relative about the same age
- An older friend
- An older brother/sister/relative
- A parent
- Another adult
- Other.'
More than one of the options above could be selected.
Respondents were advised that under the influence meant that their behaviour, or that of the person driving, may have been affected by their use of alcohol or drugs.
This item was designed for LSAC.
A significantly higher percentage of males (6%) than females (2%) reported DUI (Table 6.4). These findings are consistent with previous research that suggests that risky driving behaviour, including DUI, is generally more common among males (Evans-Whipp et al., 2013; Ivers et al., 2009; Romano, Kelley-Baker, & Lacey, 2012).
Teens who reported DUI were significantly older on average (17.1 vs 16.9 years), and there was a higher percentage of P-platers than learner drivers reporting DUI. School attendance was also significantly related to DUI behaviour. About one in seven (14%) teens who were not attending school reported this behaviour compared to only 3% of those who still attended school. These findings align with other studies that show that young people who leave school at an early age are at higher risk of a range of problematic outcomes (Fernández-Suárez, Herrero, Pérez, Juarros-Basterretxea, & Rodriguez-Diaz, 2016; Hancock & Zubrick, 2015).
Notes: ref. = reference category. # Estimate not reliable (cell count <20). * Indicates significant difference (at the 5% level) in rates of DUI among 16-17 year olds who reported a particular characteristic compared to the reference group, based on confidence intervals. Where 95% confidence intervals for the groups being compared do not overlap, this indicates that the differences in values are statistically significant.
Source: LSAC Wave 7, K cohort, weighted
Being a passenger of a driver under the influence
Adolescents often rely on others to drive them places and research has shown that it is relatively common for teens to report having been a passenger of a driver who was under the influence of alcohol or drugs. For example, Evans-Whipp and colleagues (2013) found that about a third of Victorian teenagers in their study (aged 12-17 years) had travelled in a car with a driver who was under the influence of alcohol within the past year.
The LSAC data show that of 16-17 year olds, one in 10 reported having been a passenger of a driver who was under the influence of alcohol or drugs in the past year (hereafter referred to as a 'DUI driver'). When considering these findings, it is important to note that adolescents may have differed in their interpretation of what it meant to drive while under the influence. It is possible that some may have considered driving after the consumption of any alcohol (e.g. a glass of wine with dinner) as indicative of this behaviour, while others may have interpreted it to mean that the driver was over the legal BAC limit.
When asked who the DUI driver had been, the most common responses were:
- a friend about the same age (45%)
- an older friend (25%)
- or a parent (25%).
Of those 16-17 year olds who reported having been a passenger of a DUI driver, a higher percentage lived in outer regional or remote areas than in major cities. About one in six teens living in outer regional or remote areas had been a passenger of a DUI driver compared to less than one in 10 teens living in major cities (Table 6.5). Research suggests a link between drink driving and level of remoteness, with rates of crashes involving alcohol being higher in more remote areas (Steinhardt et al., 2012).
School attendance was also linked with being a passenger of a DUI driver. Close to one in five teens (18%) who did not go to school reported such passenger experiences, compared to less than one in 10 who attended school. Research suggests that early school leavers are more likely to have friends who engage in risky behaviours (Wang & Fredricks, 2014), possibly explaining this association.
Young people's own DUI behaviour was significantly related to their experiences of having been a passenger of a DUI driver. One in four 16-17 year olds who had been a passenger of a DUI driver had driven under the influence themselves during the past 12 months (compared to only one in 50 who had not been a passenger of a DUI driver). These findings highlight the important influence that family and peers may have on risky driving behaviours such as driving under the influence.
Notes: ref. = reference category. * Indicates significant difference (at the 5% level) in rates of having been a passenger of DUI driver among 16-17 year olds who reported a particular characteristic and those in the reference category, based on confidence intervals. Where 95% confidence intervals for the groups being compared do not overlap, this indicates that the differences in values are statistically significant.
Source: LSAC Wave 7, K cohort, weighted
Summary
The majority of 16-17 year olds were driving - two in three had their learner's permit and one in 10 had a provisional or probationary licence (P-plates). Most P-platers (eight in 10) and more than half of learner drivers aged 16-17 had engaged in some form of risky driving during their 10 most recent driving trips. Also, more than one in 10 (12%) teenagers without a licence or permit had engaged in some form of risky driving behaviour on a recent driving trip, although rates of most behaviours were low among this group. The most common types of risky driving reported by 16-17 year olds were speeding at low (up to 10km/h over) or moderate (between 10-25km/h over) levels and drowsy driving. Many 16-17 year olds who had engaged in a particular form of risky driving behaviour, reported only doing so on one of their 10 most recent trips. However, almost one in five teens who had failed to wear a seatbelt when driving (or a helmet if riding a motorcycle) did so every trip, suggesting that this behaviour may be habitual for some.
As expected, risky driving behaviours were more common among P-platers than learner drivers and unlicensed drivers. However, one in six learners had exceeded the speed limit by between 10 and 25 km/h on a recent trip, and one in four had driven when fatigued - two behaviours commonly implicated in serious road crashes. Contrary to expectations, learner drivers, P-platers and unlicensed drivers did not significantly differ in their rates of seatbelt use (or helmet use, if riding a motorcycle). These findings suggest that habits relating to seatbelt or helmet use become established very early in a driver/rider's driving career, so intervention efforts targeting this behaviour may need to target teens before they reach licensing age.
Teenagers who drank alcohol or used marijuana had higher odds of engaging in all types of risky driving, adding to a large body of research that suggests that young people who take risks on the road are more likely to engage in other risky behaviours, and vice versa (Terry-McElrath, O'Malley, & Johnston, 2014; Vassallo et al., 2008). While there was considerable overlap in the characteristics associated with different forms of risky driving, having parents who had experienced trouble with the police or appeared in court was a unique predictor of not wearing a seatbelt or helmet. Lifestyle factors (e.g. being employed, attending school) seemed particularly pertinent for drowsy driving, while conduct problems (e.g. lying, stealing) were associated with more intentional forms of risky driving (e.g. drink and drug driving).
Focusing more closely on drink and drug driving, almost 4% of 16-17 years had driven while under the influence of alcohol or drugs during the past year, and about one in 10 had been the passenger of a driver who was under the influence. When teens were asked who had been driving under the influence, the most common responses were a friend of a similar age, an older friend or a parent. While this finding may seem alarming, it is important to note that teens may have differed in their understanding of what it meant to 'drive under the influence'. Nevertheless, teens who had been a passenger of a driver under the influence of alcohol or drugs were much more likely to drive under the influence of alcohol or drugs themselves, highlighting the important influence that family and peers may have on young people's driving behaviour.
This chapter provides a snapshot of the driving experiences of Australian teens in the very early stages of their driving careers. As the study children age, and more young people get their licence, it would be interesting to examine how rates of risky driving change, and to look back at factors in childhood and adolescence that may have influenced later engagement in risky driving.
References
Aarts, L., & Van Schagen, I. (2006). Driving speed and the risk of road crashes. Accident Analysis and Prevention, 38, 215-224.
Alavi, H., Keleher, S., & Nieuwesteeg, M. (2014). Qualifying the contribution of low-level speeding to trauma in Victoria. Proceedings of the 2014 Australasian Road Safety Research, Policing & Education Conference, 12-14 November, Melbourne.
Braitman, K. A., Kirley, B, B., McCartt, A. T., & Chaudhary, N. K. (2008). Crashes of novice teenage drivers: Characteristics and contributing factors. Journal of Safety Research, 39, 47-54.
Bureau of Infrastructure, Transport and Regional Economics (BITRE). (2018). Road trauma Australia 2017 statistical summary. Canberra: BITRE.
BITRE. (2019). Hospitalised injury. Canberra: BITRE. Retrieved from www.bitre.gov.au/publications/ongoing/hospitalised-injury.aspx
CARRS-Q (2016). Seat belts ( State of the Road: A Fact Sheet of the Centre for Accident Research & Road Safety - Queensland). Queensland: CARRS-Q.
CARRS-Q (2017). Young novice drivers (State of the Road: A Fact Sheet of the Centre for Accident Research & Road Safety - Queensland (CARRS-Q)). Queensland: CARRS-Q.
Cavallo, A., & Triggs, T. J. (1996). Directions for improving young driver safety within Victoria: A discussion paper. Clayton, Victoria: Monash University Accident Research Centre.
Centre for Road Safety. (2017). Young driver trauma trends report. Sydney: NSW Government, Transport for NSW.
Dahlen, E. R., & White, R. P. (2006). The big five factors, sensation seeking and driving anger in the prediction of unsafe driving. Personality and Individual Differences, 41, 903-915.
Department for Transport, Energy and Infrastructure. (2010). Inattention by road users and its contribution to road crashes in South Australia. Adelaide, South Australia: Department for Transport, Energy and Infrastructure.
Department of Infrastructure, Regional Development and Cities. (2018). Community attitudes to road safety - 2017 survey report. Canberra: Department of Infrastructure, Regional Development and Cities.
Department of Transport and Main Roads. (2015). Quicksmarts: Seatbelts and restraints. Brisbane, Queensland: Queensland Government.
Department of Transport, Planning and Infrastructure. (2014). Rural road crashes in South Australia. Adelaide, South Australia: Government of South Australia.
Dobbie, K. (2002). An analysis of fatigue-related crashes on Australian roads using an operational definition of fatigue (Report OR23). Canberra, ACT: Australian Transport Safety Bureau.
Drummer, O. H. (2008). The role of drugs in road safety. Australian Prescriber, 31,33- 35.
Evans-Whipp, T. J., Plenty, S. M., Toumbourou, J. W., Olsson, C., Rowland, B., & Hemphill, S. A. (2013). Adolescent exposure to drink driving as a predictor of young adult's drink driving. Accident Analysis and Prevention, 51, 185-191.
Fernández- Suárez, A., Herrero, J., Pérez, B., Juarros-Basterretxea, J., & Rodriguez-Diaz, F.J. (2016). Risk factors for school dropout in a sample of juvenile offenders. Frontiers in Psychology, 7, 1993. Retrieved from doi.org/10.3389/fpsyg.2016.01993
Gonzales, M. M., Dickinson, L. M., DiGuiseppi, C., & Lowenstein, S. R. (2005). Student drivers: A study of fatal motor vehicle crashes involving 16-year-old drivers. Annals of Emergency Medicine, 45, 140-146.
Goodman, R. (2001). Psychometric properties of the Strengths and Difficulties Questionnaire. Journal of the American Academy of Child & Adolescent Psychiatry, 40(11), 1337-1345.
Hancock, K. J., & Zubrick, S. (2015). Children and young people at risk of disengagement from school. Perth, WA: Commissioner for Children and Young People Western Australia.
Ivers, R., Senserrick, T., Boufous, S., Stevenson, M., Chen, H-Y., Woodward, M., & Norton, R. (2009). Novice drivers' risky driving behaviour, risk perception, and crash risk. Findings from the DRIVE study. American Journal of Public Health, 99, 1638-1644.
Jessor, R., Turbin, M. S., & Costa, F. M. (1997). Predicting developmental change in risky driving. The transition to young adulthood. Applied Developmental Science, 1, 4-16.
Lee, S. E., Simons-Morton, B. G., Klauer, S. E., Ouimet, M. C., & Dingus, T. A. (2011). Naturalistic assessment of novice teenage crash experience. Accident Analysis and Prevention, 43, 1472-1479. Retrieved from dx.doi.org/10.1016/j.aap.2011.02.026
Liu, C., Chen, C-L., Subramanian, R., & Utter, D. (2005). Analysis of speeding-related fatal motor vehicle traffic crashes (Report No. DOT HS-809-839). Washington: National Highway Traffic Safety Administration.
Mallick, J., Johnston, J., Goren, N., & Kennedy, V. (2007). Drugs and driving in Australia: A survey of community attitudes, experience and understanding. West Melbourne: Australian Drug Foundation.
Moskowitz, H., & Fiorentino, Dary. (2000). A review of the literature on the effects of low doses of alcohol on driving-related skills. Washington, D.C: National Highway Traffic Safety Administration.
Paus, T. (2005). Mapping brain maturation and cognitive development during adolescence. Trends in Cognitive Sciences, 9, 60-68. Retrieved from dx.doi.org/10.1016/j.tics.2004. 12.008
Rammstedt, B. & John, O. P. (2007). Measuring personality in one minute or less: A 10-item short version of the Big Five Inventory in English and German. Journal of Research in Personality, 41, 203-212.
Romano, E., Kelley-Baker, T., & Lacey, J. (2012). Passengers of impaired drivers. Journal of Safety Research, 43, 163-170.
Rosier, K., & McDonald, M. (2011). The relationship between transport and disadvantage in Australia. Melbourne, Vic: Communities and Families Clearinghouse, Australian Institute of Family Studies.
Scott-Parker, B., Watson, B., King, M. J., & Hyde, M. (2014). Young novice drivers and the risky behaviours of parents and friends during the Provisional (intermediate) licence phase: A brief report. Accident Analysis and Prevention, 69, 51-55.
Scott-Parker, B., & Oviedo-Trespalacios, O. (2017). Young driver risky behaviour and predictors of crash risk in Australia, New Zealand and Colombia. Accident Analysis and Prevention, 99, 30-38.
Sowell, E. R., Thompson, P. M., Holmes, C. J., Jernigan, T. L., & Toga, A. W. (1999). In vivo evidence for post-adolescent brain maturation in frontal and striatal regions. Nature Neurosciences, 2, 859-861.
Steinhardt, D., Sheehan, M., Siskind, V., & Edmonston, E. (2012). Rural and remote road safety. Mawson, ACT: Australasian College of Road Safety
Terry-McElrath, Y. M., O'Malley, P. M., & Johnston, L. D (2014). Alcohol and marijuana use patterns associated with unsafe driving among U.S. high school seniors: High use frequency, concurrent use and simultaneous use. Journal of Studies on Alcohol and Drugs, 75, 378-389.
Vassallo, S., Smart, D., Sanson, A., Harrison, W, Harris, A., Cockfield, S., & McIntyre, A. (2007). Risky driving among young Australian drivers: Trends, precursors and correlates. Accident Analysis and Prevention, 39, 444-458.
Vassallo, S., Smart, D., Sanson, A., Cockfield, S., Harris, A., McIntyre, A., & Harrison, W. (2008). Risky driving among young Australia drivers II: Co-occurrence with other problem behaviours. Accident Analysis and Prevention, 40, 376-386.
VicRoads. (2005). Young driver safety and graduated licensing (Discussion paper). Melbourne: VicRoads.
Wang, M-T., & Fredricks, J. (2014). The reciprocal links between school engagement, youth problem behaviors and school dropout during adolescence. Child Development, 85, 722-737.
Wang, Y., Qu, W., Ge, Y., & Sun, X., & Zhang, K. (2018). Effects of personality of driving style: Psychometric adaptation of the multidimensional driving style inventory in a Chinese sample. PLOS One. Retrieved from journals.plos.org/plosone/article?id=10.1371/journal.pone.0202126
Whelan, M., & Oxley, J. (2007). Going solo. A resource for parents of P-plate drivers. Clayton, Victoria: Monash University Accident Research Centre.
Williams, A. F. (2006). Young driver risk factors: successful and unsuccessful approaches for dealing with them and an agenda for the future. Injury Prevention, 12(Suppl 1), i4-i8.
1 All Australian states and territories have graduated licensing schemes. While these differ, drivers in each state and territory are required to progress through three common stages. These are: (1) a learner driver stage (L-plates, or Ls), during which novice (car) drivers learn to drive under supervision, (2) a provisional or probationary licence stage (P-plates or Ps), when drivers are able to drive independently, subject to certain restrictions, and (3) a full licence stage, when drivers are able to drive independently, without these restrictions. In some states and territories, the learner and provisional/probationary stages are further divided into different stages (e.g. L1, L2, P1, P2).
2 A very small number (n = 54) reported that they had a full licence. Given that all respondents were below the minimum legal age for a full licence, due to the ambiguity around their licence status, these participants were excluded from analyses where drivers were compared by licence type.
3 Although LSAC was designed to be nationally representative, and estimates can be obtained for larger states/territories, caution should be exercised when interpreting findings for states/territories with smaller numbers.
4 As data was not collected on driver history (including violations), it was not possible to distinguish between different types of non-drivers.
5 Future research in this area could be undertaken by interested data users.
Featured image: © GettyImages/moisseyev
Publication details
Download Publication
Share


