5. Young carers
5. Young carers
5.1 Background
Children growing up in a household with a person with a disability, long-term illness or frailty due to old age may take on caring responsibilities of different types and intensities. Tasks undertaken by young carers include a wide range of physical, household, medical, emotional and social support tasks. The caring tasks and responsibilities undertaken often go beyond what adults would normally expect of children and what most children would expect to do within the family (Becker, 2007; Early, Cushway, & Cassidy, 2006; Warren, 2007).
Obtaining precise estimates of the numbers of young carers is difficult because many qualitative studies note that young people may not identify as a carer either because of a reticence to admit caring responsibilities within the family, or because the young person themselves does not consider themselves as a young carer (e.g., Clay, Connors, Day, Gkiza, & Aldridge, 2016). Population estimates of the prevalence of young carers also vary in Australia due to differences in how caring is defined, for example:
- the age group being considered;
- whether care is provided inside and outside of the household; and
- whether the young person or another adult in the household is reporting on caring circumstances.
For instance, the 2012 Australian Bureau of Statistics (ABS) Survey of Disability and Caring (SDAC) (ABS, 2013) estimated that 1.7% of children under the age of 15 years and 7.4% of 15-24 year olds were carers.1 The 2011 Census of Population and Housing estimated that 4.3% of 15-19 year olds were carers.2
Internationally several countries have included questions about caring for a person with a disability or frail age in their census to understand caring for household members. For example, in the 2011 Census 2.1% and 2.6% of 5-17 year olds were young carers in England and Wales respectively (Office of National Statistics, 2013). In New Zealand 8% of children aged 14 years old or under were estimated to have caring responsibilities in their households based on the 2013 Census (Carers New Zealand, 2017). Estimates of care provided by 15-29 year olds from the 2012 General Social Survey in Canada (which includes care of people in and outside the household) suggest that 27% of young people care for a family member or friend with a long-term health condition, disability, or aging needs in the previous 12 months (Bleakney, 2014).3
Nationally representative surveys of young people in other countries generally tend to report a similar percentage of young carers as the abovementioned census estimates. For example, the Longitudinal Study of Young People (LSYPE) in England, a nationally representative sample of students in Year 9, reported 4.5% of students identified as young carers (The Children's Society, 2013). In the United States of America 3.2% of 8-17 year olds were identified as young carers from another survey (Hunt, Levine, & Naiditch, 2005). A large survey of Austrian 10-14 year olds estimated young carers to be 4.5% of this age group (Nagl-Cupal, Daniel, Koller, & Mayer, 2014), while the Kids Life and Times survey in Northern Ireland of 10-11 year olds found 12% of children said they helped look after someone in their household who was sick, elderly or disabled (Lloyd, 2013).
The informal care of a family member with a disability, long-term illness or frailty due to old age can be personally rewarding and provide a broader benefit to society for children undertaking this role. However, it may come at a cost of their engagement in normative behaviour throughout childhood; and also has opportunity costs well into adulthood (Cass, Smyth, Hill, Blaxland, & Hamilton, 2009). For example, compared to children who were not carers, young carers were more likely to be prevented from participating in social and leisure activities by factors associated with their caring roles and familial circumstances, such as needing to help at home, looking after someone in the family, the financial costs of caring, and problems with transport (Becker, 2007; Cass et al., 2011; Warren, 2007). Research shows that young carers often have limited choice about their caring role, and there is some evidence to show that the caring role can have significant negative effects, including poor physical, mental health and educational outcomes (The Children's Society, 2013; Kavanaugh, Stamatopoulos, Cohen, & Zhang, 2016; Lloyd, 2013; Nagl-Cupal et al., 2014; Noble-Carr, 2002).
Several studies have documented the demographic profile of young carers and found that:
- Young women were more likely to be carers than young men (Cass et al., 2011).
- Young people in low resource and single-parent households were more likely to take on a caring role (Bray, 2011; Cass et al., 2011).
- Households with young carers are generally characterised by lower incomes (Bittman, Fisher, Hill, Thompson, & Thomson, 2004; Cass et al., 2011; Dearden & Becker, 2004; Hunt et al., 2005; Noble-Carr, 2002; Young, Grundy, & Kalogirou, 2005).4
- Young carers are more likely to live in more disadvantaged communities, in outer urban locations and country towns (Bray, 2011).
- Research in Australia reveals differences in the circumstances of young carers from culturally and linguistically diverse (CALD) backgrounds. Indigenous young Australians were two to three times more likely than non-Indigenous young people to be carers (Bray, 2011; Cass et al., 2011) and compared to non-carers, twice as many young primary carers were born in non-English speaking countries (Cass et al., 2011). Research focused on young carers in receipt of income support suggests that higher rates of caring were evident for children with parents from countries that had experienced war such as Iraq, Afghanistan, Croatia, Bosnia and Herzegovina and Serbia (Bray, 2011).
The aim of this chapter is to provide new information about the number of Australian children who are providing informal care for a family member, how much time they spend providing care and the types of care provided. The main focus of this chapter is on the characteristics of children who take on caring roles and the types of caring activities that they undertake. This chapter explores various aspects of the lives of young people who care for a person with a long-term health condition, disability or frail age, and spans caring activities involving very limited assistance, through to the provision of two or more hours of care on a daily basis. The chapter will address the following research questions:
- How many children spend time caring for another person?
- What type of help do they provide?
- How much time do they spend providing care or help?
- How does the amount and type of care provided differ according to characteristics of the child and the household?
- Does caring limit young peoples' academic achievement?
The chapter is structured as follows. A description of the data and methods used is given first, below. The first analytical section of this chapter provides new evidence about the number of 14-15 year olds who care for someone who is elderly or has a disability or long-term illness; and the primary care arrangement for those who care for more than one person. We then examine the type of help that young carers provide, the relationship between the study child and the person receiving assistance, and the socio-demographic characteristics of young carers. The final section looks at the association between carer status and NAPLAN Reading and Numeracy outcomes in Year 9.
5.2 Data and methods
The focus of this chapter is the K cohort, Wave 6 data, when the children were aged 14-15 years, and were asked about informal care of a family member. More specifically, study children were asked "Do you help someone who has a long-term health condition, has a disability or is elderly with activities that they would have trouble doing on their own?" The question specified that we are interested in help they have given, or are likely to give, for at least six months; and help that is given as part of a paid job, unpaid volunteer work or community service should not be included. Those who reported engaging in some type of caring activity were how often they do these activities; how many hours they spend providing care; and the type of help they provide.
Dimensions of caring in this chapter
Adolescents who reported providing care were asked about their relationship to the person (or people) they were caring for and the type of care they were providing for up to three people.5 This restriction resulted in some missing information for those who reported caring for more than three people. These observations are retained in the analysis by including a specific category for those who reported providing assistance for four or more people, but gave no details about their relationship to the people being cared for and the type of care provided. Adolescents who reported caring for at least four people make up around 4% of 14-15 year olds (11% of those who reported providing help or care) as shown in Table 5.1.
For those who said they cared for up to three people, for each person being cared for, study children were asked whether they provide assistance with:
Core activities:
- personal care (e.g., washing, dressing, eating, toileting, etc.);
- moving around (e.g., getting in/out of bed or chair, etc.);
- communicating (including being understood and understanding family, friends or others).
Non-core activities:
- health care (e.g., giving medication, medical appointments);
- transport (e.g., catching buses, trains, etc.);
- preparation of meals;
- housework, shopping, errands;
- house repairs or garden care (e.g., mowing, changing light bulbs);
- paperwork (e.g., filling in forms, paying bills, dealing with government or other agencies);
- keeping them company;
- other things.6
Notes: Adolescents who cared for someone with a long-term health condition, disability or who is elderly. Differences in proportions by gender are not statistically significant at the 5.0% level. Percentages may not total exactly 100.0% due to rounding.
Source: LSAC K cohort, Wave 6
Of the 3,341 children in the K cohort who completed the survey, 39% (40% of boys and 37% of girls) reported providing some type of care. Therefore, it is important to distinguish between assistance with "core activities" (i.e. helping with personal care, moving around and communicating) and "non-core activities", that is, help with other things such as preparing meals and keeping them company.7
For some of the analysis in this chapter, it is necessary to classify carer status into mutually exclusive categories according to their "primary care arrangement", more specifically this means care that involves assistance with:
- core activities (personal care, mobility or communication) for someone who lives with them;
- core activities for someone who does not live with them;
- non-core activities only, for someone who lives with them; and
- non-core activities only, for someone who does not live with them.
For those who reported caring for two or three people, help with core activities is given priority. If the type of help is the same for multiple-care recipients, help for those who live with them is given priority. For example, if a study child helps someone who lives with them with non-core activities and someone who does not live with them with core activities, they are considered to be helping with core activities for someone who does not live with them. A study child who helps someone who lives with them and someone who does not live with them with non-core activities would be classified as providing help with non-core activities for someone who lives with them.
In this chapter, we describe the differences in the type of care provided and amount of time spent caring depending on:
- the relationship between the study child and the person being cared for (e.g., parent, sibling, grandparent, other related or unrelated people);
- whether they live in the same household as the person being cared for;
- the gender of the child; and
- the characteristics of the household (e.g., household structure, parents' employment status and education).
Documenting the characteristics of carers
Logistic regression models are used to estimate the association between carer status and characteristics of the child and their primary household. The explanatory variables used in the multivariate analyses capture a range of characteristics including age, birth order, Indigenous status, whether the child speaks a language other than English, household structure, mother's country of birth, whether adults (over 15) other than the study child's parents live in the household,8 whether there is a household member with a disability or long-term illness, whether there is a household member aged 65 or older, if the parent cares for a non-household member, mother's education and remoteness of residence.
Estimating the impact of caring on academic achievement
We also examine the relationship between carer status and NAPLAN Reading and Numeracy scores in Year 9. The NAPLAN tests broadly reflect aspects of literacy and numeracy common to the curriculum in each state or territory, with test formats and questions chosen so that they are familiar to teachers and students across Australia (Australian Curriculum Assessment and Reporting Authority [ACARA], 2008). Linear regression models (OLS) are used to estimate the strength of the relationship between carer status and NAPLAN outcomes before and after controlling for background characteristics such as birth order, household structure and region of residence. To account for the association between carer status and household characteristics such as mother's education and parent's employment status, these covariates are added to the model in stages.
5.3 How many 14-15 year olds spend time caring for another person?
Almost 40% of 14-15 year olds said that they spent some time caring for a person who is elderly or has a health condition or disability. Twenty-two per cent provided help with core activities and a further 12% said they provided other types of assistance, but no help with core activities (Table 5.2).
Note: Percentages may not total exactly 100.0% due to rounding.
Source: LSAC K cohort, Wave 6
Among 14-15 year olds who provided care, most were assisting someone who did not live with them. While around 18% of 14-15 year olds helped someone who did not live with them with core activities and 10% provided assistance with non-core activities for someone who did not live with them, only 6% of 14-15 year olds helped someone who lived with them with core activities, and 3% helped someone who lived with them with non-core activities.
While the percentage of girls who help someone with core activities was slightly higher than that for boys, the gender difference was not statistically significant. However, the percentage of boys who helped with non-core activities was significantly higher than that for girls (15% compared to 10%). This was mainly due to a higher percentage of boys who reported providing assistance with non-core activities for someone who does not live with them. It is also important to note that very few carers provide assistance only with core activities. That is, most carers who help with core activities also provide other types of help as well. The specific types of assistance that young carers provide are explored in more detail in section 6.4 of this chapter.
Almost 20% of 14-15 year olds reported caring for more than one person. Table 5.3 shows that, among those who cared for two or three people, over 70% helped someone with core activities, but this help was mainly for people who did not live with them. While there was no overall gender difference in the percentage of 14-15 year olds who helped someone with core activities, among those who cared for more than one person, the percentage of girls who provided assistance with core activities was significantly higher than that for boys; while boys who reported caring for two or three people were more likely than girls to be helping someone who does not live with them with non-core activities.
Notes: n = 461. Columns do not add to 100.0% as those who care for more than one person may be included up to three times. # Estimate not reliable (Cell count < 20). * Indicates the gender difference in proportions is significant at the 5.0% level.
Source: LSAC K cohort, Wave 6
Notes: n = 3,341. Mutually exclusive categories with priority given to help with core activities, then help for household members for those who care for more than one person. Gender difference in proportions is significant at the 5.0% level.
Source: LSAC K cohort, Wave 6
When those who care for more than one person are allocated to a carer status category according to their primary care arrangement (i.e., help with core activities is given priority, then help for someone who lives with the carer is given priority over help for someone living elsewhere), Table 5.4 shows that the percentage of 14-15 year olds providing each type of care remains quite similar to that in Table 5.3, where those who cared for more than one person were included more than once. The most common care arrangement is still helping someone who does not live with them with core activities (17%), followed by helping someone who does not live with them with non-core activities only (9%).
For many of those who cared for more than one person, classifying carer status in this way made no difference to their carer status. Among those who reported caring for two people, 71% provided the same type of care for both people (29% provided help with non-core activities for two people who did not live with them, 32% provided help with core activities for two people who did not live with them, 5.5% helped two household members with core activities and 4% helped two household members with non-core activities only). Of those who reported caring for three people, 46% provided the same type of care for all three people (19% provided help with non-core activities for three people who did not live with them, 23% provided help with core activities for three people who did not live with them, 1.8% provided help with core activities for three people who lived with them and 2.6% helped three household members with non-core activities only). While almost 40% of 14-15 year olds reported providing some type of care for someone who is either elderly or has a disability, most were providing assistance for someone who did not live with them - only 6% were helping someone who lived with them with core activities.
5.4 Who are young carers caring for and what type of assistance do they provide?
Prior research has found that the types of caring tasks that young carers undertake are often related to the complexity of family structure, the care recipient's illness or disability and whether the young person was a primary carer or the oldest sibling in the household (e.g., Cass et al., 2011). In this section, we describe the type of care provided according to the relationship with the person being cared for, and whether the person receiving assistance lives in the same household as the study child. Because most of those who provide assistance with core activities also help with non-core activities, the analysis in this section looks separately at the specific types of help provided by those who help someone who lives with them; and then the types of help provided to people who do not live with the study child.
Caring for someone in the same household
Approximately 9% of 14-15 year olds said they cared for at least one person who lived with them. This included 6% who helped with core activities and 3% who did not.9 Figure 5.1 shows that of those who cared for someone who lived with them, almost half (46%) cared for a parent or step-parent, just over one third provided care for a sibling and just over 30% cared for a grandparent. Among those who cared for a sibling, almost 70% helped with core activities (personal care, moving around and communicating). Of those who cared for a grandparent, 56% helped with core activities; while for those who cared for a parent or step-parent, 49% helped with core activities.
There was no significant gender difference in the percentage of males and females who provided assistance to family members or the percentage who helped with core activities. This is presumably because the likelihood of providing care depends mainly on whether the study child has a household member who requires this type of assistance. It may also depend on whether there are older siblings and another parent living in the household.
Table 5.5 shows that the most common types of help that young carers provided to people who live with them was keeping them company, followed by help with housework, shopping and errands, help with communicating and help with preparation of meals. For most types of help, the percentage of young carers who provided each type of assistance did not differ significantly by gender. The only exceptions were help with meal preparation, which was more common among female carers than male carers (58% compared to 43%); and help with house repairs or garden care, which was more commonly provided by male carers (61% compared to 24%).
Compared to young carers who did not provide assistance with core activities, those who helped a household member with personal care, mobility or communication were more likely to also provide help with transport (31% compared to 9%);10 preparation of meals (58% compared to 39%); health care (28% compared to 6%) and keeping them company (91% compared to 73%).
Figure 5.1: Relationship to person being cared for in the same household
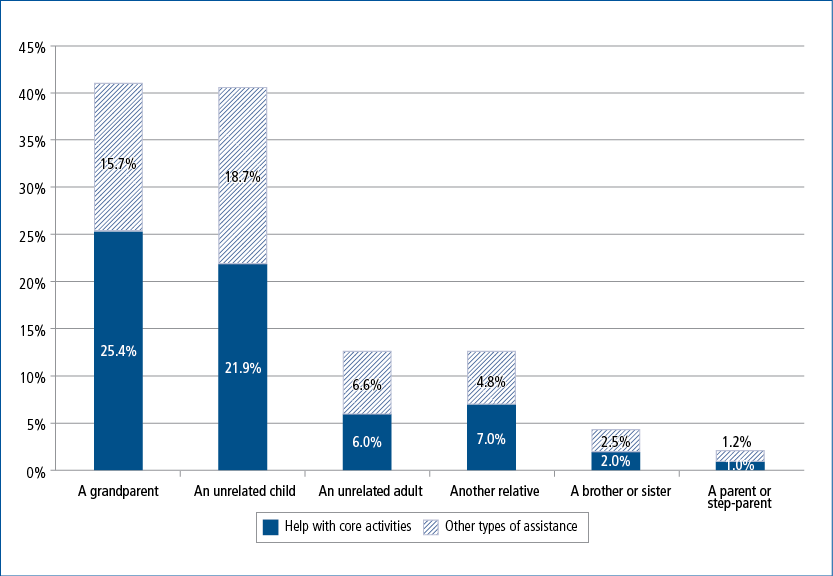
Notes: Sample is restricted to 14-15 year olds who reported caring for a household member. n = 273. "Other" includes other relatives, boarders, housemates and unrelated children living in the same household as the study child. No significant gender differences in the percentage of 14-15 year olds who provided care to siblings, parents, step-parents or grandparents.
Source: LSAC K cohort, Wave 6
Notes: Sample is restricted to 14-15 year olds who reported caring for a household member. # Estimate unreliable (Cell count < 20). * Indicates the gender difference in proportions is significant at the 5.0% level.
Source: LSAC K cohort, Wave 6
Figure 5.2 provides more detail about the type of help that adolescents provided to parents, siblings and grandparents who live with them. Assistance for a parent or step-parent most commonly involved help with meal preparation, housework, shopping and errands and house repairs or garden care, as well as keeping them company. Among those who cared for a sibling, the most common types of assistance were help with communicating and keeping them company. It was more common for 14-15 year olds to help a sibling with personal care, health care and transport than to help a parent or grandparent with those tasks. Among those who cared for a resident grandparent, care most commonly involved help with housework shopping and errands and keeping them company. Relatively few 14-15 year olds helped a grandparent with personal care, transport, health care or paperwork.
Figure 5.2: Type of assistance provided, by relationship to person being cared for (in the same household)
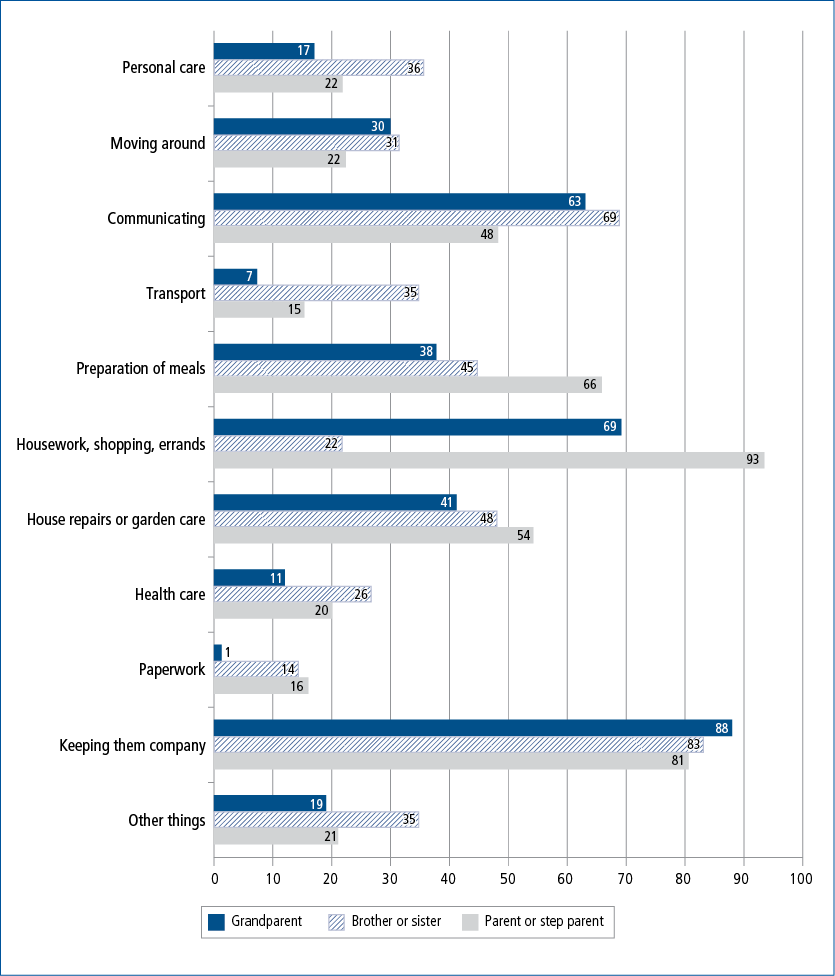
Notes: Sample is restricted to 14-15 year olds who reported caring for a resident parent, step-parent, sibling or grandparent.
n = 273.
Source: LSAC K cohort, Wave 6
In summary, of the estimated 9% of 14-15 year olds who cared for a household member, almost half cared for a parent or step-parent, just over one third provided care for a sibling and just over 30% cared for a grandparent. There were very few gender differences in the types of help provided. However, a higher percentage of girls helped with meal preparation; and a higher percentage of boys helped with house repairs or gardening. The type of help provided to a household member depended to some extent on the relationship between the carer and the person receiving assistance. For example, compared to siblings and grandparents, parents more commonly received help with housework and meal preparation; while siblings were more likely than parents or grandparents to receive help with personal care.
Caring for someone not living in the same household
Almost 30% of 14-15 year olds said they cared for at least one person who did not live with them.11 Figure 5.3 shows that young people who cared for someone who did not live with them most commonly provided assistance to either a grandparent or an unrelated child.
Figure 5.3: Relationship to person being cared for (not in the same household)
Notes: Sample is restricted to 14-15 year olds who reported caring for someone who does not live with them. n = 927.
Source: LSAC K cohort, Wave 6
Notes: Sample is restricted to 14-15 year olds who reported caring for someone who does not live with them. # Estimate unreliable (cell count < 20). * Indicates the gender difference in proportions is significant at the 5.0% level.
Source: LSAC K cohort, Wave 6
Figure 5.4: Type of assistance, by relationship to person being cared for (study child cares for a grandparent, unrelated child or unrelated adult who does not live with them)
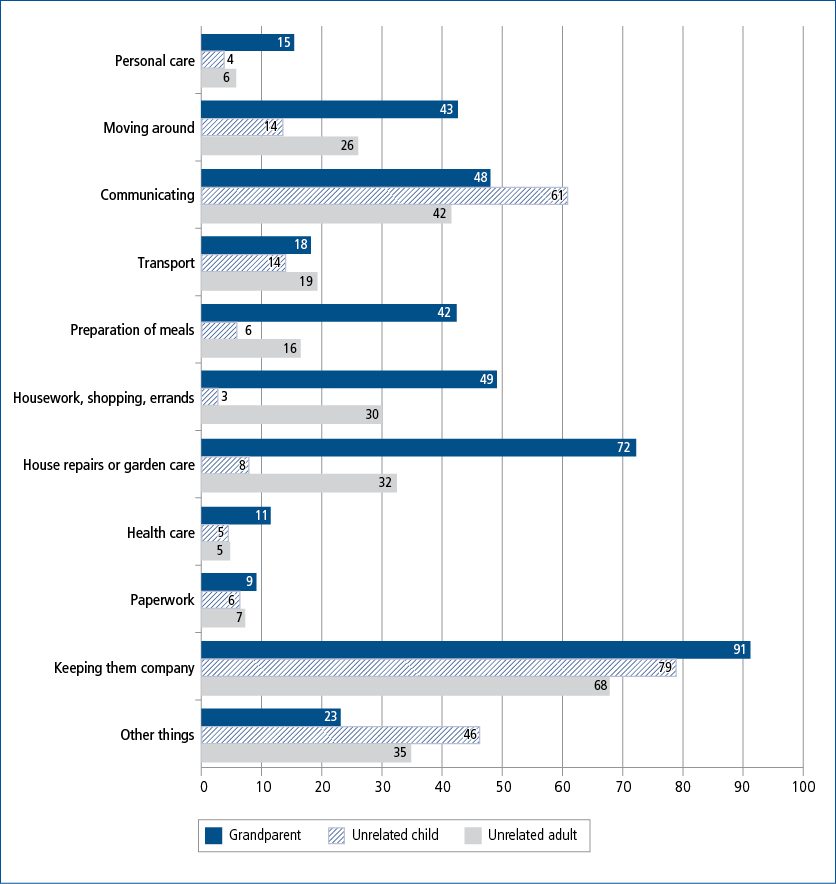
Notes: Sample is restricted to 14-15 year olds who reported caring for a non-resident grandparent, unrelated adult or unrelated child. n = 881.
Source: LSAC K cohort, Wave 6
Compared to boys who helped someone who did not live with them, a significantly higher percentage of girls helped someone who did not live with them with moving around, meal preparation, paperwork and keeping them company.
Compared to young carers who did not provide assistance with core activities, those who helped a non-household member with personal care, mobility or communication were more likely to also provide help with transport (23% compared to 12%), preparation of meals (29% compared to 18%), health care (11% compared to 4%), paperwork (10% compared to 5%) and keeping them company (91% compared to 68%).
Table 5.6 shows that the most common types of help that young carers provided to people who did not live with them was keeping them company, followed by help with housework, shopping and errands, help with communicating and help with preparation of meals.
Compared to boys who helped someone who did not live with them, a significantly higher percentage of girls helped someone who did not live with them with moving around, meal preparation, paperwork and keeping them company.
Compared to young carers who did not provide assistance with core activities, those who helped a non-household member with personal care, mobility or communication were more likely to also provide help with transport (23% compared to 12%); preparation of meals (29% compared to 18%); health care (11% compared to 4%); paperwork (10% compared to 5%) and keeping them company (91% compared to 68%).
Figure 5.4 provides more detail about the type of help that adolescents provided grandparents, unrelated children and unrelated adults who do not live with them. Assistance for a non-resident grandparent most commonly involved help with meal preparation, housework, shopping and errands, house repairs or garden care, communicating, moving around as well as keeping them company.
Among those who cared for an unrelated adult who did not live with them, the most common type of care was keeping them company. Over 40% helped with communication, and around one third provided assistance with house repairs, garden care, housework, shopping and errands, but less than 20% provided help with meal preparation or transport. One possible explanation for this difference is that unrelated adults may be living in residential care facilities where this help is provided. Alternatively, study children may be helping unrelated adults (e.g., elderly neighbours) that do not need this type of assistance.
Of the 28.5% of 14-15 year olds who cared for someone who did not live with them, just over 40% cared for an unrelated child.12 This assistance was mostly provided for children who attended the same school as the study child and commonly involved keeping them company, help with communicating and "other things". Details provided in response to the "other things" category commonly involved protecting a child from bullies, helping with schoolwork and helping them with sports, hobbies or other recreational activities.
Summary
Among 14-15 year olds who cared for someone with a long-term health condition, disability or who is elderly, the majority were caring for someone who did not live with them. Only 6% of 14-15 year olds helped someone who lived with them with core activities (personal care, mobility or communication).
The specific types of care provided to household members varied depending on the relationship between the carer and the person receiving assistance. For example, compared to those who cared for a parent or grandparent, a higher percentage of those who cared for a sibling helped with personal care and transport. On the other hand, those who provided assistance to a parent were more likely to help with meal preparation, housework, shopping and errands than those caring for a sibling or grandparent.
Almost 30% of 14-15 year olds reported caring for someone who did not live with them, including 18% who provided assistance with core activities. Most 14-15 year olds who cared for someone who did not live with them were caring for either a grandparent or an unrelated child. Again, the specific type of care varied depending on the care recipient. Those who were caring for a grandparent commonly provided help with house and garden care, shopping, errands, meal preparation and moving around; while those who cared for an unrelated child mainly helped a child who attended the same school with communication, keeping them company and "other things" such as schoolwork.
5.5 How much time do young carers spend providing assistance to others?
Young carers were asked about how often they provide care for someone else; and the amount of time they spend providing care on occasions that they provide care.13 Table 5.7 shows that just over 20% of 14-15 year olds who provided care for another person did so every day (9% spent two or more hours per day); and an additional 37% provided assistance at least once a week.
Notes: n = 1,240. Columns are not mutually exclusive due to some 14-15 year olds caring for more than one person. # Estimate not reliable (cell count < 20). Percentages may not total exactly 100.0% due to rounding.
Source: LSAC K cohort, Wave 6
Note: # Estimate not reliable (cell count < 20). Gender differences in the amount of time spent caring, by number of people cared for, are not statistically significant at the 5.0% level.
Source: LSAC K cohort, Wave 6
Among those who helped someone in the same household with core activities, more than half did so daily, and a further 31% provided assistance at least once a week. However, among those who provided core assistance only for non-household members, only 16% did so daily, while 38% provided assistance at least once a week.
Table 5.8 shows that among those who care for more than one person, the amount of time spent doing caring activities is not necessarily more than that of those who only care for one person. While the percentage who provided care daily increased from 19% for those who cared for one person, to 32% for those who cared for three people, only 16% of those who reported caring for four or more people spent time caring for someone every day. Still, the percentage of 14-15 year olds who spent more than two hours per day doing caring activities increased considerably, from 8% of those who cared for one person to 18% of those who cared for three people.
The amount of time that 14-15 year olds spend doing caring activities depends strongly on whether or not they are caring for someone who lives with them, and to a lesser extent on the relationship with the care recipient. In Table 5.9, the amount of time spent caring is presented for the six most common carer-recipient relationships.
Notes: SC = study child. Columns are not mutually exclusive due to some 14-15 year olds caring for more than one person. # Estimate not reliable (cell count < 20). Gender differences in the amount of time spent caring, by relationship to care recipient, are not statistically significant at the 5.0% level.
Source: LSAC K cohort, Wave 6
More than half of those who cared for a resident parent or step-parent did so daily, with 22% spending more than two hours per day doing these activities. Over 40% of those who cared for a sibling or grandparent who lives with them spent some time every day doing caring activities.
On the other hand, less than one quarter of those who cared for an unrelated child who did not live in their household said they did so every day. Given that this arrangement mainly involves helping a child who attends the same school, it is not surprising that almost half of the 14-15 year olds who care for an unrelated child reported doing so weekly.
Only 7% of 14-15 year olds who cared for a grandparent who did not live with them did so daily, with just over one third of those who care for a non-resident grandparent doing so weekly, and almost 40% providing this type of care monthly or less often.
5.6 Characteristics of young carers
In this section, we look at the characteristics of young carers, according to the type of care they provide. In Table 5.10, characteristics of the study child such as gender, birth order and whether they speak a language other than English at home are compared first, according to whether or not they care for someone who is elderly or has a disability or long-term illness and, then, for those who are carers, according to their primary care arrangement.
Notes: SC = study child. # Estimate not reliable, cell count less than 20. a Birth order is based only on resident siblings. Number of observations ranges from 2,825 for father's country of birth to 3,341 for age group, gender and birth order and Indigenous status. Statistical significance is tested against the base category ("Not a carer") *** p < .001; ** p < .01 and * p < .05.
Source: LSAC K cohort, Wave 6
Overall, there were few significant differences in the personal characteristics of 14-15 year olds who cared for someone who is either elderly or has a long-term health condition or disability. Only birth order was statistically significant, with 35% of those who were the youngest child in the family stating that they provide some type of care, compared to 37% of eldest children, 44% of middle children and 42% of those who were the only child. However, there were some differences in characteristics depending on the primary care arrangement:
- The percentage of 14-15 year olds who helped someone who did not live with them with core activities was significantly higher among those who speak only English at home (17% compared to 12% for those who spoke another language at home); and for those whose father was born in Australia (18% compared to 13% for those whose father was born in a non-English speaking country).
- Helping someone who lives in the same household with non-core activities was more common among those who were the middle child and those who spoke a language other than English at home.
- Helping someone who does not live with them with non-core activities was more common among males (11% of males compared to 7% of females).
- Caring for four or more people was more common among those who were the middle child.
Turning now to the association between carer status and household characteristics, Table 5.11 shows that the percentage of 14-15 year olds providing care for someone else is significantly higher in households where:
- there is someone with a long-term health condition or disability;
- there is someone aged 65 or older;
- the study child's parents provide care for someone outside the household;
- none of the parents (in the study child's primary household) are employed;
- the study child's mother's highest level of education is Year 12 or below;
- government payments are the main source of parental income; or
- the study child's primary household is in the lowest quartile of socio-economic position.
It is important to note that these associations are not causal - they may be the result of having someone in the household who requires care. For example, it may be the case that a parent has a health condition or disability that limits the amount of work they are able to do or prevents them from working at all. If a parent has a lifelong or ongoing health condition, this may also have restricted that parent's education opportunities. Further, if a parent takes time off work or stops working to care for another household member, this is likely to result in a reduction in household income and possibly a lower socio-economic status for the household.
There were also some significant differences in household characteristics of young carers according to their primary care arrangement. The percentage of 14-15 year olds who helped someone who lived with them with core activities was significantly higher among:
- those with a household member aged 65 or older (18% compared to 4%);
- those with a household member with a long-term health condition or disability (9% compared to 3%),
- those in single-parent households (10% compared to 5% to those in two-parent households);
- those in single-parent households where the parent is not employed (20% compared to 3.5% among those in households with two employed parents);
- those whose mother's highest level of education is Year 12 or lower (8% compared to 5% for those whose mother has a post-school qualification);
- those in the lowest quartile of socio-economic position (8% compared to 4% in the highest quartile); and
- those in households where the main source of parental income is government payments.
Notes: SC = study child. # Estimate not reliable, cell count less than 20. Number of observations ranges from 2,890 government payments main source of parents' income to 3,339 for remoteness. Family type, parents' employment status and socio-economic position are based on parents in the primary household only. Statistical significance is tested against the base category ("Not a carer") *** p < .001; ** p < .01 and * p < .05.
Source: LSAC K cohort, Wave 6
The percentage of 14-15 year olds who helped someone who did not live with them with core activities was significantly higher among:
- those with a household member aged 65 or older (17% compared to 14%); and
- those whose parent(s) care for someone outside the household (26% compared to 15%).
The percentage of 14-15 year olds who helped someone who lived with them with non-core activities was significantly higher among:
- those with a household member aged 65 or older (8% compared to 2%);
- those with a household member with a long-term health condition or disability (5% compared to 2%);
- those whose mother's highest level of education is Year 12 or lower (4% compared to 2% for those whose mother has a degree); and
- those in households where the main source of parental income is government payments (6% compared to 2%).
Helping someone who did not live with them with non-core activities was significantly higher among:
- those with a household member with a long-term health condition or disability (5% compared to 2%);
- those in the lowest quartile of socio-economic position (12% compared to 7% for those in the highest quartile); and
- those in households where the main source of parental income is government payments (11% compared to 8%).
Those who reported caring for four or more people were more commonly in single-parent households, in households where someone has a disability or long-term illness, in households in the lowest quartile of socio-economic position and in households where the main source of parental income is government payments.
Logistic regressions: factors associated with carer status
In this section, we use logistic regressions to estimate the main factors associated with being a carer (providing any type of care for someone who is elderly or has a disability); and the factors associated with providing specific types of care (e.g., helping someone who lives with them with core activities). A range of socio-demographic characteristics was included in the models, based on the bivariate associations described in Table 5.12 and Table 5.13. The results, presented as odds ratios, indicate characteristics associated with an increased or decreased likelihood of being a carer, after accounting for other factors.
Estimates of the influence of child and household characteristics on the odds of being a carer (providing any type of care for a person who is elderly or has a disability) are presented in Table 5.12.14 The results indicate that the odds of providing (some type of) care are higher if:
- a household member has a long-term health condition or disability;
- a household member is aged 65 or older;
- a parent cares for someone not living in the main household.
For girls, but not for boys, there is a statistically significant association between the odds of being a carer and quartile of socio-economic position. Compared to girls whose household was in the lowest quartile, the odds of being a carer were significantly lower among those in households in the highest quartile. However, it is important to keep in mind that this result could be due to the poor health or caring responsibilities of the parents, which may limit their ability to work.
To compare the characteristics of those who provided help with core activities to those who helped only with non-core activities, and those who helped someone who lived with them compared to those who did not, logistic regressions were run comparing each care type (core assistance for a household member, core assistance for a non-household member, non-core assistance for a household member, non-core assistance for a non-household member, and care for four or more people) to the group who were not carers.15
Notes: Logistic regression model estimating the probability of being a carer, including controls for age, birth order, Indigenous status, child speaks a language other than English, single-parent household, mother's country of birth, adults other than parents in the households, household member with a disability, household member aged 65 or older, parent cares for a non-household member, mother's education, remoteness of residence and quartiles of socio-economic position. Only statistically significant coefficients are presented. A Chow test rejects the hypothesis that the coefficients are equal in the male and female sub-samples. *** p < .001; ** p < .01 and * p < .05.
Source: LSAC K cohort, Wave 6
The results indicate that for boys, after controlling for a range of socio-demographic characteristics:
- The odds of helping someone who lives with them with core activities are significantly higher if:
- a household member has a disability (OR = 3.6);
- a household member is aged 65 or older (OR = 6.6);
- and significantly lower if their mother has a certificate- or diploma-level qualification, compared to those whose mother's highest qualification was Year 12 or lower (OR = 0.5).
- The odds of helping someone who lives with them with non-core activities are significantly higher if:
- the study child speaks a language other than English at home (OR = 4.7);
- a household member has a disability (OR = 3.3);
- they are the middle child, compared to those who were the eldest child (OR = 4.8);
- a household member is aged 65 or older (OR = 4.1);
- and significantly lower if their mother had a certificate- or diploma-level qualification, compared to those whose mother's highest qualification was Year 12 or lower (OR = 0.5).
- The odds of helping someone who does not live with them with core activities are twice as high among those whose parents care for someone outside the household.
- The odds of helping someone who does not live with them with non-core activities are significantly higher if:
- a parent cares for someone living elsewhere (OR = 1.5);
- they live in inner regional Australia, compared to those who live in a major city (OR = 1.4); and
- significantly lower if they are the youngest child, compared to the first born (OR = 0.6) and also if their household socio-economic position is in the top two quartiles, compared to those in the lowest quartile (OR = 0.6 for the 3rd quartile and 0.5 for the highest quartile).
For girls:
- The odds of helping someone who lives with them with core activities are significantly higher if:
- a household member has a disability (OR = 4.9);
- a household member is aged 65 or older (OR = 4.6).
- The odds of helping someone who lives with them with non-core activities are significantly higher if:
- the study child speaks a language other than English at home (OR = 5.2);
- they are the middle child, compared to the first born (OR = 2.9);
- a household member has a disability (OR = 4.2);
- a household member is aged 65 or older (OR = 4.0);
- if their household socio-economic position is in the 2nd quartile, compared to those in the lowest quartile (OR = 2.2).
- and significantly lower if their mother has a certificate- or diploma-level qualification, compared to those whose mother has no post-school qualification (OR = 0.6).
- The odds of helping someone who does not live with them with core activities are significantly higher if:
- there is an adult other than the study child's parents living with them (OR = 1.6);
- a parent cares for someone living elsewhere (OR = 2.1).
- The odds of helping someone who does not live with them with non-core activities are significantly higher if:
- the study child speaks a language other than English at home (OR = 1.7);
- a parent cares for someone outside the household (OR = 1. 6);
- a household member has a disability (OR = 1.6);
- their mother has a degree qualification, compared to those whose mother has no post-school qualification (OR = 1.8);
- and significantly lower if their household socio-economic position is in the top quartile, compared to those in the lowest quartile (OR = 0.4).
- For boys, the odds of caring for four or more people is significantly lower among those whose household socio-economic position is in the third quartile, compared to those in the lowest quartile (OR = 0.5); while for girls, the odds of caring for four or more people is significantly higher among those who have a household member with a disability (OR = 2.1). This result suggests that there may be a gender differences in the type of care provided by those who reported caring for four or more people, with girls more likely to be helping at least one household member with a disability, while boys more commonly provided assistance with non-core activities for several non-household members.
Overall, these results imply that for 14-15 year olds, the likelihood of providing care or assistance depends mainly upon whether there is a family member who requires this type of assistance. That is, those who live in a household in which someone is over the age of 65 or someone has a disability are more likely to care for someone who lives with them. Similarly, around one-quarter of 14-15 year olds who have a parent who cares for someone outside their household helped someone who does not live with them with core activities. Presumably, for many of these young carers, this is because they are accompanying a parent who is caring for a family member living elsewhere.
Our findings indicate that, compared to children who are the eldest child, children who are the middle child are more likely to provide assistance with non-core activities for a household member. This finding is inconsistent with other studies that have shown that it is more common for the eldest child in the family to provide informal care, particularly if the eldest child is female (e.g. McMahon & Luthar, 2007; Zukow-Goldring, 2001). However, there is some Australian evidence of middle children taking on caring responsibilities once the eldest child takes on paid employment or leaves home, or if the eldest child suddenly becomes ill or disabled (e.g. as a result of an accident).16
There are very few significant associations between child and household characteristics and the likelihood of providing non-core assistance for someone who does not live with the study child. Given that a large proportion of 14-15 year olds who provide this type of assistance are helping an unrelated child who attends the same school, the decision to provide this type of care is likely to depend mainly on the personality or temperament of the chid and whether they have a friend or classmate who requires this type of assistance, rather than socio-demographic characteristics.
It is also interesting to note that there are some gender differences in the characteristics associated with caring for four or more people. In particular, for girls, but not for boys, the odds of caring for four or more people were higher if they had a household member with a disability. That is, among those who reported caring for more than four people, girls are more likely than boys to be caring for a household member with a disability or long-term illness. This suggests that among those 14-15 year olds who reported caring for more than one person, the intensity of caregiving is likely be higher for girls than for boys.17
5.7 The association between carer status and Year 9 NAPLAN Outcomes
There is little large-scale evidence on the impact of caring on educational outcomes in Australia and only limited research internationally; however, the evidence to date does suggest that being a young carer does limit young peoples' educational performance. Analyses of the LSYPE in England suggests that young carers' Year 9 examination results were substantially below their peers, although this analysis did not take into account any differences in the socio-economic or household circumstances between young carers and non-carers (The Children's Society, 2013). Evidence from 10-11 year olds in Northern Ireland also suggested young carers had poorer educational outcomes than their peers (Lloyd, 2013). For example, fewer young carers sat the secondary school transfer test than their peers (56% compared to 67%), a prerequisite for the more academic grammar school.18 Further, those young carers who did take the transfer test did not perform as well as their peers. Moreover, fewer young carers said they would like to go on to university than non-carers (Lloyd, 2013).
For 14-15 year olds in LSAC, there are substantial differences in average Year 9 reading and numeracy scores according to carer status. Compared to boys who do not provide care or assistance for another person, average reading and numeracy scores are 18 and 17 points lower, respectively, among boys who provide some type of care for someone else. For girls, the differences are much larger. Compared to girls who are not carers, average reading and numeracy scores are 31 and 24 points lower, respectively, among those who care for someone who is elderly or has a disability (see Table 5.13).
These differences in NAPLAN scores are substantial. One way to think about the magnitude of these differences is that the NAPLAN score required to meet the national minimum standard (or any other bandwidth cut-off point) is 52 points higher for Year 9, compared to Year 7. Therefore, 26 NAPLAN points can be considered to be the equivalent of one year of schooling at the Year 9 level (Warren & Haisken deNew, 2013). Based on this assumption, the differences in Year 9 NAPLAN, depending on carer status at age 14-15 range from 0.7 years of schooling at the Year 9 level for numeracy for boys to 1.2 years of schooling for reading for girls. 19
Notes: Statistical significance is tested against the base category ("Does not provide care"), *** p < .001; ** p < .01 and * p < .05. For boys and girls, differences in average reading and numeracy scores of those who provide assistance with core activities and those who only provide help with non-core activities only are not statistically significant. Further, differences in average reading and numeracy scores of those who provide assistance for someone who lives with them, and those who provide help only for those who do not live with them are not statistically significant. These groupings are not mutually exclusive, i.e. someone who helps a household member with core activities may also help someone who does not live with them with non-core activities.
Source: LSAC K cohort, Wave 6. Sample restricted to 14-15 year olds who completed their Year 9 NAPLAN tests in 2014.
For boys and girls, average reading and numeracy scores among those who help at least one person with core activities are not significantly different from the average scores of those who provide assistance with non-core activities only. Furthermore, differences in the average reading and numeracy scores of boys and girls who help someone who lives with them, compared to the scores of those who only help people who do not live with them, are not statistically significant. However, Table 5.13 shows that for boys, average reading and numeracy scores are lowest among those who provide assistance with core activities for someone who lives with them. Compared to boys who are not carers, average reading and numeracy scores of those who help a household member with core activities are 38 points lower. These differences amount to 1.5 years of schooling at the Year 8-9 level. For girls, average reading and numeracy scores are also lower among those who help someone who lives with them with core activities, compared to those who provide other types of care (for up to three people); but NAPLAN scores are lowest among girls who reported caring for four or more people. Compared to girls who did not provide assistance for someone who was elderly or had a disability or long-term illness, average NAPLAN scores for girls who reported caring for four or more people were 77 points (three years of schooling) lower for reading and 58 points (2.2 years of schooling) lower for numeracy.20
Looking at differences in NAPLAN scores according to the primary care arrangement (Table 5.14) confirms that, compared to those who are not carers, boys who help someone who lives with them with core activities have significantly lower scores for reading and numeracy, as do those who only provide assistance with non-core activities for non-household members. For boys, average scores for numeracy, but not for reading, are significantly lower among those who reported caring for four or more people. For girls, average reading and numeracy scores are significantly lower among those who provide care for someone else, regardless of the type of care provided.21
Note: Statistical significance is tested against the base category ("Does not provide care"), *** p < .001; ** p < .01 and * p < .05.
Source: LSAC K cohort, Wave 6. Sample restricted to 14-15 year olds who completed their Year 9 NAPLAN tests in 2014.
For girls, it appears that the number of people being cared for has a stronger negative association with NAPLAN outcomes than whether they help with core activities or whether they help someone who lives with them. Table 5.15 shows that average reading and numeracy scores for girls decrease substantially with the number of people they care for. However, for boys, while average reading and numeracy scores are lowest for those who care for three people, there is no clear relationship between average NAPLAN scores and the number of people they care for.
The amount of time spent caring is also important, with average reading and numeracy scores lowest among those who care for someone daily (Table 5.16) with differences ranging from 25 points (almost one year of schooling) for numeracy for girls to 37 points (1.4 years of schooling) for numeracy for boys. For reading, but not for numeracy, average scores were significantly lower among boys and girls who spent two or more hours per day providing assistance - compared to those who were not carers, average reading scores were 50 points (1.9 years of schooling) lower for boys and 42 points (1.6 years of schooling) lower for girls.
Note: Statistical significance is tested against the base category ("Does not provide care"), *** p < .001; ** p < .01 and * p < .05.
Source: LSAC K cohort, Wave 6. Sample restricted to 14-15 year olds who completed their Year 9 NAPLAN tests in 2014.
Note: Statistical significance is tested against the base category ("Does not provide care"), *** p < .001; ** p < .01 and * p < .05.
Source: LSAC K cohort, Wave 6. Sample restricted to 14-15 year olds who completed their Year 9 NAPLAN tests in 2014.
Plots of the distribution of NAPLAN scores according to the amount of time spent caring provide a clear picture of the differences in scores depending on the time spent caring (Figure 5.5).
For boys and girls who spend at least two hours per day doing caring activities, the distribution of reading scores sits well to the left of those of 14-15 year olds who are not carers and of those who spend less than two hours per day caring. Among 14-15 year olds who spent two or more hours per day caring, 80% of boys and 58% of girls had reading scores below the Year 9 equivalent of 583 points, compared to 55% of boys and 43% of girls who did caring activities daily but spent less than two hours per day on caring activities; 54% of boys and 46% of girls who were carers but did not do caring activities daily; and 45% of boys and 31% of girls who were not carers.
For numeracy, the differences in NAPLAN scores according to time spent caring are less stark than those for reading. Figure 5.5 shows that for boys, it is those who cared for someone daily, to some extent regardless of the time spent caring, who had the poorest outcomes. While 35% of boys who were not carers had scores below the Year 9 equivalent score of 585, 49% of those who did caring activities daily (59% of those who cared for less than two hours per day and 39% of those who cared for two hours or more per day) had scores below this level.
For girls and numeracy, the differences in the distribution of NAPLAN scores, according to time spent caring looked similar to those for reading, with girls who spent two or more hours per day caring had the poorest outcomes - 53% of those who spent 2+ hours caring had scores below the year equivalent score of 585, compared to 47% of girls who cared daily but for less than 2 hours, and 40% for girls who were not carers.
Figure 5.5: Distribution of Year 9 NAPLAN scores, by time spent caring
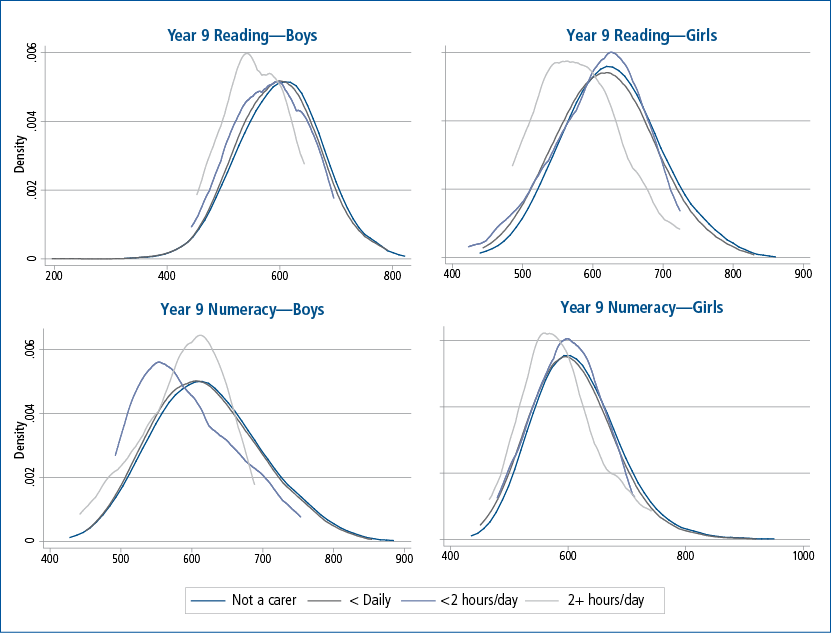
Notes: Sample is restricted to 14-15 year olds who reported caring for a household member. For reading, n = 1,030 for boys and 1,019 for girls. For numeracy, n = 1,020 for boys and 1,021 for girls.
Source: LSAC K cohort, Wave 6
For girls, but not for boys, average reading and numeracy scores were lowest among those who reported caring for four or more people. However, this is a relatively small group of young people and only 16% of this group reported doing caring activities daily; and estimates for the group who cared for four or more people and spent at least two hours per day caring were unreliable due to the small number of observations.
The descriptive evidence in this section has shown that there are substantial differences in the average NAPLAN scores of 14-15 year olds according to whether or not they care for someone who either has a disability or is elderly. However, it is important to note that the simple differences in test scores between children who provided care or assistance to someone else and those who did not should not be regarded as causal, as they may simply reflect other characteristics, such as parental education, which may be correlated with both carer status and NAPLAN test scores.
Sample characteristics in section 6.6 of this chapter indicate that 14-15 year olds who cared for someone else were less advantaged than those who were not carers. For example, those who cared for another person were more commonly from a low socio-economic quartile and single-parent household, and to have a mother who did not have a post-school qualification. To control for these differences in characteristics, multivariate regressions were conducted. First, we estimated the influence of caring on NAPLAN scores using an indicator of whether or not the study child provides any type of care, controlling for a range of socio-demographic characteristics. To account for the association between carer status and household characteristics such as mother's education and parent's employment status, covariates were added in stages:
- The baseline model (Model I) controls only whether the study child cares for another person.
- In Model II, controls for socio-demographic characteristics (age (in months)), birth order, whether the study child speaks a language other than English, mother's country of birth, Indigenous status, single-parent household) were added.
- In Model III, mother's education (indicator of whether mother has a degree qualification) was included.
- In Model IV, household employment status (indicator of jobless household) was added to the model.
Table 5.17 shows that even after accounting for a range of child and family characteristics, including mother's education and parent's employment status, being a carer has a substantial and statistically significant influence on reading and numeracy outcomes for girls and boys.
Notes: *** p < .001, ** p < .01, and * p < .05. Covariates included in models II to IV: age (in months), birth order, whether the study child speaks a language other than English, mother's country of birth, Indigenous status, single-parent household. Significance levels for socio-demographic controls are based on F-tests of joint significance.
Source: LSAC K cohort, Wave 6
The results in Table 5.17 suggest that compared to boys who were not carers, those who were carers could be expected to have average reading scores 16.5 points and average numeracy scores 15.9 points lower (0.6 years of schooling at the Year 8-9 level) after controlling for socio-demographic characteristics. Compared to girls who were not carers, those who were carers could be expected to have average reading scores 25.7 points (1 year of schooling) lower, and average numeracy scores 16.5 points (0.6 years of schooling) lower.
The descriptive evidence in this section shows that average Reading and Numeracy scores are lowest among those who have the highest burden of care, that is, those who provide care daily, particularly if they spend 2 hours or more each day; those who provide assistance with core activities for someone who lives with them; and for girls, those who reported caring for 4 or more people.
Estimates of the influence of caring on NAPLAN scores, taking into consideration time spent caring and the type of care provided are presented Table 5.18 for Reading and Table 5.19 for Numeracy. Model I includes only the time spent caring. In Model II, indicators of whether the child helps a household member with core activities and whether they care for 4 or more people are added; and in Model III, a range of socio-demographic controls are added. As mother's education and parent's employment status are likely to be associated with having a household member who requires care, they are included separately in model IV.22
Estimates in Table 5.18 indicate that, for boys:
- Before taking the type of care provided into consideration, compared to those who were not carers, average reading scores could be expected to be 50 points (1.9 years of schooling) lower for those who spent at least two hours per day caring for someone. Those who did caring activities weekly could be expected to have reading scores 20 points (0.8 years of schooling) lower than non-carers.
- After time spent caring was taken into consideration, there was no significant additional influence from helping someone in the same household with core activities, or caring for four or more people.
- After accounting for a range of socio-demographic characteristics including mother's education and parents' employment, there was still a significant and substantial negative influence of time spent caring, with boys who spent at least two hours per day doing caring activities expected to have average reading scores 48.5 points (1.9 years of schooling) lower than non-carers; and those who did caring activities weekly expected to have average scores 19 points (0.7 years of schooling) lower than non-carers.
For girls:
- Before taking the type of care provided into consideration, compared to those who were not carers, average reading scores could be expected to be almost 42 points (1.6 years of schooling) lower for those who spent at least two hours per day caring for someone. Girls who spent less than two hours per day doing caring activities and those who did caring activities weekly or less often could be expected to have average reading scores around 30 points (1.2 years of schooling) lower than non-carers.
- After time spent caring was taken into consideration, there was no significant additional influence of helping someone in the same household with core activities. However, girls who reported caring for four or more people could be expected to have average reading scores a further 53 points (two years of schooling) lower. For example, before controlling for socio-demographic characteristics, girls who did caring activities weekly and cared for four or more people could be expected to have reading scores, on average, 75 points (2.9 years of schooling) lower than non-carers.
- After accounting for a range of socio-demographic characteristics including mother's education and parents' employment, there was still a significant and substantial negative influence of time spent caring. Compared to non-carers, girls who spent at least two hours per day doing caring activities could be expected to have average reading scores 37 points (1.4 years of schooling) lower; and those who did caring activities weekly or less often could be expected to have reading scores, on average, 18-19 points (0.7 years of schooling) lower. Those who reported caring for four or more people could be expected to have average reading scores a further 47 points (1.8 years of schooling) lower. For example, girls who did caring activities weekly and cared for four or more people could be expected to have average reading scores 65 (17.5 + 47.3) points (2.5 years of schooling) lower than non-carers.
Notes: *** p < .001, ** p < .01, and * p < .05. Covariates included in models II to IV: age (in months), birth order, whether the study child speaks a language other than English, mother's country of birth, Indigenous status, single-parent household. Significance levels for socio-demographic controls are based on F-tests of joint significance.
Source: LSAC K cohort, Wave 6
Tuning now to the results for numeracy, estimates in Table 5.19 indicate that, for boys:
- Before taking the type of care provided into consideration, compared to those who were not carers, average numeracy scores could be expected to be almost 36 to 37 points (1.4 years of schooling) lower for those who were caring daily (regardless of whether they spent two hours or more); and those who were caring weekly could be expected to have numeracy scores 15.5 points (0.6 years of schooling) lower than non-carers.
- After time spent caring was taken into consideration, there was no significant additional influence of helping someone in the same household with core activities, or caring for four or more people. When these indicators were included in the model, there was no significant difference between the average numeracy scores of those who were not carers and those who did caring activities weekly.
- After controlling for age, birth order, whether the study child speaks a language other than English, mother's country of birth, Indigenous status and household structure, there was still a significant difference in average numeracy scores for those who were caring daily, regardless of the number of hours per day. Boys who were caring daily could be expected to have numeracy scores 30-33 points (up to 1.3 years of schooling) lower, on average, than non-carers.
- After controlling for mother's education and household joblessness, which are strong predictors of both carer status and cognitive outcomes, boys who spent two hours or more doing caring activities still had significantly lower numeracy scores (34 points or 1.3 years of schooling), compared to non-carers.
For girls:
- Before taking the type of care provided into consideration, differences in NAPLAN scores according to time spent caring were relatively small. Compared to non-carers, average numeracy scores could be expected to 23 to 26 points (0.9-1 years of schooling) lower for girls who were carers.
Notes: *** p < .001, ** p < .01, and * p < .05. Covariates included in models II to IV: age (in months), birth order, whether the study child speaks a language other than English, mother's country of birth, Indigenous status, single-parent household. Significance levels for socio-demographic controls are based on F-tests of joint significance.
Source: LSAC K cohort, Wave 6
- After time spent caring was taken into consideration, there were significant additional influences of caring for four or more people and also for helping a household member with core activities.
- After controlling for age, birth order, whether the study child speaks a language other than English, mother's country of birth, Indigenous status and household structure, there was still a significant difference in average numeracy scores for girls who spent two or more hours per day caring and also for those who did caring activities less often than weekly. Compared to non-carers, girls who spent more than two hours per day caring could be expected to have average numeracy scores 22 points (0.8 years of schooling) lower; and those who were caring less often than weekly could be expected to have average scores 14 points (0.5 years of schooling) lower. Girls who helped a household member with core activities could be expected to have numeracy scores a further 21 points lower (0.8 years of schooling) and those who cared for four or more people could be expected to have numeracy scores a further 36 points lower (1.4 years of schooling). That is, girls who spent more than two hours per day caring and helped a household member with core activities could be expected to have numeracy scores 43 points (1.7 years of schooling) lower than non-carers; and girls who cared for four or more people and spent at least two hours per day doing caring activities could be expected to have numeracy scores 58 points (2.2 years of schooling) lower than non-carers. However, these results should be interpreted with caution due to the small number of observations.
- When mother's education and parental employment were included in the model, time spent caring was no longer statistically significant for girls. Only the indicator of caring for four or more people remains statistically significant, reducing numeracy scores by 31 points (1.2 years of schooling), on average. While these results suggest that the amount of time and the type of care does not have a statistically significant influence on numeracy outcomes for girls, it is possible that the influence of time spent caring is underestimated in this model due to the inclusion of variables that may be correlated with both carer status and NAPLAN test scores.
In summary, carer status has a substantial negative influence on NAPLAN reading and numeracy outcomes for boys and girls. After controlling for a range of socio-demographic characteristics, this negative influence remains statistically significant and the differences in average NAPLAN scores for those who provide some type of care, compared to those who do not, are substantial - ranging from 16.5 points (0.6 years of schooling) for numeracy for boys to 25.7 points (1 year of schooling) for reading for girls.
Estimates taking the amount of time spent caring and the type of care provided into consideration show that for those who do caring activities daily, and particularly for those who spend at least two hours per day doing caring activities, the negative influence of being a young carer on NAPLAN outcomes is substantial. After controlling for a range of socio-demographic characteristics, average reading scores can be expected to be 49 points lower for boys and 37 points lower for girls. These differences can be considered to be the equivalent of 1.9 and 1.4 years of schooling respectively. For boys, there is a similar result for numeracy, with those who spend at least two hours per day caring expected to have numeracy scores 34 points (1.3 years of schooling) lower than non-carers. Girls who cared for four or more people could be expected to have numeracy scores 31 points (1.2 years of schooling) lower than girls who were not carers.
5.8 Summary and conclusion
This chapter provides information about the number of 14-15 year olds in Australia who have provided informal care for at least six months to a family member or friend either because of a long-term health condition, disability or frailty due to old age. Based on young people's reports almost 40% were young carers, suggesting that providing some form of care for someone who is elderly or who has a long-term health condition or disability is a normal part of many young peoples' lives. However, a much smaller proportion, 22% of all 14-15 year olds provided assistance with core activities of daily living such as personal care (e.g. washing, dressing, eating, toileting), moving around (e.g., getting in/out of bed or chair) and communicating (including being understood and understanding family, friends or others). Caring for multiple people was also not that uncommon, with almost 20% of young people of this age caring for more than one person.
A relatively small percentage of young people cared for a household member. Six per cent of 14-15 year olds provided assistance with core activities in the household and 3% with non-core activities (i.e., health care, transport, preparation of meals, housework/shopping, house repairs or garden care, paperwork and keeping them company). Of the 9% of young people who did care for someone in the household almost half were caring for a parent or step-parent, a third a brother or sister and a little over 30% a grandparent. The types of care to household members depended on the relationship between the young carer and the person receiving assistance, with those who cared for a parent or grandparent more commonly helping with personal care and transport than those who were caring for siblings; and parents more commonly receiving help with meal preparation, housework, shopping and errands.
A large percentage of 14-15 year olds reported caring for someone who did not live with them (29%) and 60% of these young carers reported providing assistance with core activities. Most 14-15 year olds who cared for someone who did not live with them were caring for either a grandparent or an unrelated child. Young carers provided most help to grandparents in the form of house and garden care, shopping, errands, meal preparation and moving around, while the care for an unrelated child who attended the same school was more commonly in the form of communication, keeping them company and "other things" such as schoolwork.
The amount of time young people spent caring varied markedly with 21% (an estimated 18,923 14-15 year olds) providing care daily, 9% (an estimated 8,635 14-15 year olds) for two or more hours per day, 37% weekly, 13% fortnightly and 29% monthly or less than once per month.
Living in the same household was associated with caring for relatives on a daily basis:
- 51% of young people caring for parents or step-parents did so daily, (22% spending more than two hours per day);
- 45% of young people who were caring for a resident sibling (22% spending more than two hours per day); and
- 43% of young people who were caring for a resident grandparent (21% spending more than two hours per day).
Whereas for young people caring for people outside the household far fewer were doing so on a daily basis (7% of those caring for grandparents, 24% of those caring for an unrelated child).
Regardless of the number of care recipients, whether the care was for someone living with them, or the care was for core or non-core activities, there were a common set of household characteristics associated with being a carer at 14-15 years of age. These household characteristics were primarily about having a person who needed care in the household or a parent who had caring responsibilities outside of the household. Results from the statistical model suggested that caring was associated with:
- a household member who has a long-term health condition or disability;
- a household member who is aged 65 or older;
- a parent who cares for someone not living in the household; and
- a mother with lower levels of education or living in a household with a lower socio-economic status.
These findings are broadly consistent with previous Australian research using census and income support payment data that suggests that the presence of a relative with a long-term health condition, disability or who is elderly increases the likelihood of a young person caring, particularly if they are living in the same household (Bray, 2011; Cass et al., 2011). This chapter and other population data also suggest that young carers' families are also more disadvantaged on a number of measures.
In this chapter we find evidence that being a young carer limits young people's educational opportunities and, by extension, their life chances. We find that young carers have significantly lower performance in reading and numeracy in NAPLAN at Year 9 than their peers. These differences range from 8.5 months of schooling for numeracy for boys to 1.2 years of schooling for reading for girls. When statistical models are used to control for demographic characteristics of the child and parent's country of birth, household structure, parental employment status and mother's education, young carers are still substantially behind their peers. Even after taking into account a wide range of other characteristics, boys are seven months behind and girls are one year behind in reading and, for numeracy, boys and girls are around seven months behind their peers.
Further analyses examining the role of time spent caring, the type of care provided (core/non-core), whether the young carer is living in the same household and the number of care recipients suggest that the time spent caring undermines young carers' academic achievement. Statistical models that take into account many demographic characteristics, as well as mother's education and whether the young person is in a jobless household, still find that young people who are spending two or more hours per day on caring activities have substantially lower levels of academic achievement. Compared to their non-caring peers, in reading, boys were 1.9 years behind and girls were 1.6 years behind their peers when they spent two or more hours per day as carers.
For Year 9 NAPLAN numeracy, boys who were providing care daily (regardless of the amount of time they spent per day) were 1.3 years behind non-caring peers. For girls, a more complex picture emerged. After adjusting for many demographic variables, female young carers who spent two or more hours per day providing care were still behind, but not if the mother's education and living in a jobless household was taken into account. Given that a long-term health condition or disability in the family is likely to affect the capacity of mothers to obtain a tertiary degree and/or employment, taking these factors into account may well be overly conservative. However, when all demographic variables were taken into account, female young carers who cared for four or more people were 1.2 years behind their peers on Year 9 NAPLAN numeracy scores. While the results from these statistical models are not causal, and further research is needed to unpack the precise causal pathways,23 estimates of differences between young carers and their peers on NAPLAN scores changed little after accounting for child and household characteristics, supporting the conclusion that caring has a detrimental impact on educational performance.
The findings from this chapter, coupled with evidence that suggests that young carers are more likely to live in disadvantaged households and communities, to have lower educational attainment and employment rates when older (Bray, 2011; Cass et al., 2011) and to rely on income support for longer periods than other young income support recipients (Bray, 2011), raise concerns about how family health conditions can have far-reaching intergenerational consequences if young people have great caring responsibilities. The evidence in this chapter suggests that, although a minority of young people, this group of young carers are in need of additional support. Young carers who were most affected, that is, those who were caring for two or more hours per day, only comprised 3.6% of all 14-15 year olds in 2014 (an estimated 8,647 young people). Given the relatively small group of young people involved in intensive caring, investment in targeted policies and programs to provide additional formal support for the person in need of care and also provide better support for these young carers to participate fully in school could make a real difference to the lifetime educational prospects of this group of youths.
The findings from this chapter show that despite popular perceptions of young people being self-absorbed, two in five are engaged in the pro-social activity of caring for a person with a long-term health condition, disability or who is elderly. Asking young people themselves about their own caring experiences provides quite different estimates to the census, and underscores how important it is to get insights into the lives of young carers for the development of policy and programs. For the majority of these caring arrangements there is likely to be a level of reciprocity, particularly given that they were largely for grandparents, parents and younger siblings - something that was not a focus of current research. While for many young people caring may be part of a set of reciprocal family ties, findings from this chapter do highlight that intensive caring does undermine young peoples' educational prospects. Future investments in support for this small minority of youth may well pay dividends for these young carers and provide broader benefits to society.
5.9 References
Carer Recognition Act 2010 (Cth).
Australian Bureau of Statistics (ABS). (2013). Disability, Ageing and Carers 2013: Summary of Findings Australia, Catalogue 4430.0, Canberra: ABS.
Australian Curriculum Assessment and Reporting Authority (ACARA). (2008) National Assessment Program, Literacy and Numeracy, Achievement in Reading, Writing, Language Conventions and Numeracy, 2008. Canberra: ACARA. <http://www.nap.edu.au/_Documents/National_/2ndStage.NationalReport_18Dec...
Australian Institute of Health and Welfare (AIHW). (2013). Australia's welfare 2013 (Australia's Welfare No. 11). Cat. no. AUS 174. Canberra: AIHW.
Becker, S. (2007). Global perspectives on children's unpaid caregiving in the family. Global Social Policy, 7(1), 23-50.
Bittman, M., Fisher, K., Hill, T., Thompson, D., & Thomson, C. (2004). Identifying isolated carers: Contacting carers with unmet needs for information and support. Social Policy Research Centre Report. Sydney: University of NSW.
Bleakney, A. (2014). Young Canadians providing care. Catalogue no. 89-652-X _ No.003. Ottawa, Ontario: Statistics Canada.
Bray, J. R. (2011). Young carers in receipt of Carer Payment and Carer Allowance 2001 to 2006: characteristics, experiences and post-care outcomes (FaHCSIA Occasional Paper No. 47). Canberra: Department of Families, Housing, Community Services and Indigenous Affairs.
Carers New Zealand. (2017). The Youngest Carers. Auckland: Carers NZ. Retrieved from <carers.net.nz/the-youngest-carers/>.
Cass, B., Brennan, D., Thomson, C., Hill, T., Purcal, C., Hamilton, M., & Adamson, E. (2011). Young carers: Social policy impacts of the caring responsibilities of children and young adults. Report prepared for ARC Linkage Partners, October 2011. Sydney: University of New South Wales
Cass, B., Smyth, C., Hill, T., Blaxland, M., & Hamilton, M. (2009). Young Carers in Australia: understanding the advantages and disadvantages of their care giving (Social Policy Research Paper No. 38). Canberra: Department of Families, Housing, Community Services and Indigenous Affairs.
The Children's Society. (2013). Hidden from view: The experiences of young carers in England. London: The Children's Society.
Clay, D., Connors, C., Day, N., Gkiza, M., & Aldridge, J. (2016). The lives of young carers in England. Qualitative report to Department for Education. (DfE Research Report 499). London: Department for Education.
Dearden, C., & Becker, S. (2004). Young Carers in the UK: The 2004 report. London: Carers UK.
Early, L., Cushway D., & Cassidy T. (2006). Perceived stress in young carers: Development of a measure. Journal of Child and Family Studies, 15(2), 165-176.
Goss, P., & Sonnemann, J. (2016). Widening gaps: What NAPLAN tells us about student progress. Grattan Institute Report. Melbourne: Grattan Institute. Retrieved from <grattan.edu.au/report/widening-gaps/>.
Hunt, G., Levine, C., & Naiditch, L. (2005). Young caregivers in the US report of findings. Washington: National Alliance of Caregivers in Collaboration with United Hospital Fund.
Kavanaugh, M.S., Stamatopoulos, V., Cohen, D. & Zhang, L. (2016) Unacknowledged Caregivers: A Scoping Review of Research on Caregiving Youth in the United States, Adolescent Research Review, Volume 1, Issue 1, pp 29-49.
Lloyd K. (2013). Happiness and well-being of young carers: Extent, nature and correlates of caring among 10 and 11 year old school children. Journal of Happiness Studies, 14(1), 67-80.
McMahon, T., & Luthar, S. (2007). Defining characteristics and potential consequences of caretaking burden among children living in urban poverty. American Journal of Orthopsychiatry, 77(2), 267-281.
Nagl-Cupal, M., Daniel, M., Koller, M., & Mayer, H. (2014). Prevalence and effects of caregiving on children. Journal of Advanced Nursing, 70(10), 2314-2325. doi: 10.1111/jan.12388.
Office of National Statistics. (2013). A summary of unpaid care by 5 to 17-year-olds in England and Wales. London: Office for National Statistics. Retrieved from <www.ons.gov.uk/ons/rel/census/2011-census-analysis/provision-of-unpaid-c....
Warren, D., & Haisken deNew, J. (2013). Early bird catches the worm: The casual impact of pre-school participation and teacher qualifications on Year 3 National NAPLAN Cognitive Tests, (Melbourne Institute Working Paper No. 31/13). Melbourne: Melbourne Institute of Economic and Social Research, The University of Melbourne.
Warren, J. (2007) Young carers: conventional or exaggerated levels of domestic and caring tasks, Children and Society, 21, 136-146
Young, H., Grundy, E., & Kalogirou, S. (2005). Who cares? Geographic variation in unpaid caregiving in England and Wales: Evidence from the 2001 census, Population Trends, 120, 23-34.
Zukow-Goldring P. (2002). Sibling caregiving. In M. H. Bornstein (Ed.),. Handbook of parenting, Vol. 3: Being and becoming a parent (2nd ed.) pp. 253-286. Mahwah, NJ: Erlbaum.
1 In the SDAC, a carer is defined as "a person who provides any informal assistance, in terms of help or supervision, to an older person or someone who has a disability or a long-term health condition". This is slightly broader than the definition of a carer under the 2010 Carer Recognition Act (Cth), in which a carer is defined as "an individual who provides personal care, support and assistance to another individual who needs it because that other individual (a) has a disability; or (b) has a medical condition (including a terminal or chronic illness) or; (c) has mental issues or (d) is frail aged. Under this Act, an individual is not a carer if he or she provides only formal care. Under the Carer Recognition Act, "An individual is not a carer in respect of care, support or assistance he or she provides (a) under a contract of service or a contract for the provision of services; or (b) in the course of doing voluntary work for a charitable, welfare or community organisation; or (c) as part of the requirements of a course or education or training." Further, "An individual is not a carer merely because he or she (a) is the spouse, de facto partner, parent, child or other relative of an individual, or is the guardian of an individual, or (b) lives with an individual who requires care."
2 The ABS 2006 and 2011 censuses collected data about informal carers aged 15 and over using questions about the provision of unpaid assistance in the previous two weeks to a person because of disability, long-term condition or problems related to age. The parts of the definition about the reason for providing assistance are consistent with the SDAC, but reference periods for the two collections are different, and the census does not refer to ongoing assistance (AIHW, 2013).
3 Four in ten care recipients were grandparents, with a further 1 in 4 being parents of the young person.
4 It should be noted that in many cases, the association between carer status and financial disadvantage will be due to the fact that at least one parent will be the person being cared for, and therefore unable to work, leading to lower household income.
5 These questions were asked as part of the Audio Computer Assisted Self Interview (ACASI). However, when study children entered more than three names, the instrument was unable to process who to ask the questions about and therefore these questions were not asked. This has resulted in missing information for 132 children who reported providing help for four or more people. Based on the number of people in the household, the majority of these children were reporting about care for at least one person who did not live with them: 2% lived in a two-person household (i.e., a single-parent household), 13% had three people in their household (including the study child), 41% had four people and the remaining 45% lived in a household of five or more people. ***** For more details about this issue, refer to the LSAC Data Issues paper: <www.growingupinaustralia.gov.au/pubs/issues/2015/data-issues.pdf>. ****(can we delete this last sentence?)******
6 Details provided by respondents who reported helping with "other things" commonly included companionship or friendship, protecting children from being bullied and helping with schoolwork.
7 The classification of core activities (personal care, moving around and communicating) in this chapter is in line with the ABS 'Core Activity Need for Assistance' concept, which was developed for the 2006 Census to identify people with a 'profound or severe core activity limitation' using similar criteria to the Survey of Disability, Ageing and Carers (SDAC). This population is defined as people with a disability who need assistance in their day to day lives with any or all of the following core activities - self-care, body movements or communication (ABS, 2013). It is important to note that young carers may not view their own caring responsibilities this way. For example, a young carer who provides care for a parent who has a mental illness may be very invested in the daily care of their parent, but this may not involve personal care tasks.
8 Other adults in the household may be older siblings of the study child.
9 This figure is likely to be an underestimate as we have no information about the type of care provided by those who reported caring for four or more people.
10 As 14-15 year olds are not able to drive, assistance with transport presumably involves assistance with taking public transport (e.g., school bus) or providing care to someone while travelling together in a vehicle (e.g., helping with seatbelts, or providing other types of assistance while travelling).
11 This figure is likely to be an underestimate as we have no information about the type of care provided by those who reported caring for four or more people.
12 This amounts to at least 11% of all 14-15 year olds (underestimated due to lack of details about those who cared for four or more people).
13 For those who provide care for more than one person, it is not possible to determine how much time they spend caring for each individual, only the overall amount of time they spend caring.
14 Odds ratios with values above 1 indicate a positive association, while those below 1 indicate a negative association. For example, after controlling for socio-demographic characteristics, the odds of being a carer are 1.7 times higher among 14-15 year olds who have a household member aged 65 or older, compared to those who do not.
15 A multinomial logistic model was run using six categories based on primary carer status. However, when likelihood ratio tests were applied, the results indicated that some categories (resident core and resident non-core; non-resident non-core and not a carer) should be combined. Therefore, logistic regressions were run separately comparing each care type to the sub-sample of 14-15 year olds who do not provide any type of care. Those who care for two or three people may be included in more than one of these sub-samples. To preserve space regression results are not presented.
16 Based on the responses of 68 young carers aged between 11 and 25 years who participated in focus groups in Sydney, Adelaide and Canberra, Cass et al. (2009) identified four main pathways leading to the onset of caring responsibilities. Some young carers believed themselves to have been born into caring (e.g., they had older siblings with disabilities, or were born to parents with a disability or illness, or had younger siblings close in age for whom they assumed a caring role at a young age); some assumed greater caring responsibilities as they grew older (e.g., they had older siblings who undertook a great deal of caring responsibilities, and as they themselves grew older and their older siblings took on paid employment or left home, they also started to contribute); others experienced a sudden onset of caring responsibilities due to a diagnosis or illness or a change in family circumstances (e.g., due to an accident); and others made an active choice to provide care (e.g., they took up their role as carer because they felt that they could provide better care than someone else, or that it was the responsibility of a family member to provide care, or they felt an emotional obligation).
17 The percentage of girls who cared for 2-3 people and helped with core activities at home was higher for girls than for boys, with boys more likely to help someone who does not live with them with non-core activities.
18 Most of Northern Ireland (NI) has a dual grammar/secondary school system, and the transfer test (taken at age 11) is used to decide which children are eligible to go to Grammar schools. While taking the test is not mandatory, Grammar schools generally provide a higher academic standard of education, compared to secondary schools (Lloyd, 2013).
19 Estimates in terms of years of schooling would be considerably higher using the methodology employed by the Grattan Institute (Goss & Sonnemann, 2016), who estimate that for Reading, the NAPLAN scores equivalent to the year 8 and 9 levels are 566 and 583 points respectively and for Numeracy, the NAPLAN scores equivalent to the year 8 and 9 levels are 563 and 585 points respectively. Therefore, using this method, one year of schooling at the year 8-9 level can be considered to be equivalent to approximately 17 NAPLAN points for Reading and approximately 22 NAPLAN points for Numeracy, compared to 26 points for both Reading and Numeracy using the method proposed by Warren and Haisken deNew (2013).
20 These results should be interpreted with caution as there are only 29 observations for girls who reported caring for four or more people.
21 The only exception is for Numeracy scores for girls who helped someone who lives with them with non-core activities. The lack of statistical significance is likely to be due to the small number of observations (27) for this group.
22 Models in which the indicator of helping a household member with core activities was replaced with the interaction of indicators of core activities and helping a household member shows no significant differences to those presented in Tables 5.18 and 5.19. Note that a model including a measure of primary care arrangement interacted with time spent caring would arguably be a better specification, this was not possible due to the small number of cell sizes for many of these combinations.
23 There are a number of possible explanations for the poorer educational achievement of young carers including more limited time to spend studying, but also increased rates of non-attendance at school (Lloyd, 2013) and the higher levels of stress and fatigue experienced by those in a caring role (Kavanaugh et al., 2016; Nagl-Cupal et al., 2014). Some studies also report that young carers are more likely to be bullied at school as well (Lloyd, 2013).
Share


