4. Are children and adolescents getting enough sleep?
4. Are children and adolescents getting enough sleep?
Key messages
Children and adolescents need adequate sleep for healthy growth, learning and development. Not getting enough sleep is associated with a range of physical and mental health problems that can interfere with current health and functioning and have consequences for health and wellbeing later in life (Astill, Van der Heijden, Van Ijzendoorn, & Van Someren, 2012; Becker, Langberg, & Byars, 2015; Chaput et al., 2016; Shochat, Cohen-Zion, & Tzischinsky, 2014). Poor quality or insufficient sleep can affect young people's performance at school due to its impact on attention, memory, creativity and learning (Gozal & Kheirandish-Gozal, 2007). Insufficient sleep has also been linked to poorer mental health and emotional regulation and greater risk taking and social problems, all of which may impact relationships with family, peers and others. In terms of physical health, inadequate sleep has been associated with poorer overall health and a greater current and future risk of young people becoming overweight (Landhuis, Poulton, Welch, & Hancox, 2008).
The amount of sleep required per 24 hours reduces as one ages: from 12-15 hours including naps for infants to 8-10 hours of uninterrupted sleep for teenagers (14-17 years) (Hirshkowitz et al., 2015). Sleep patterns are known to change as children enter adolescence (Crowley, Acebo, & Carskadon, 2007). Biological changes associated with puberty, including brain development and hormonal changes lead to a natural tendency for teenagers to stay up later at night and sleep in later in the morning (Owens, Au, Carskadon, Millman, & Wolfson, 2014). Other changes in adolescence such as shifting peer and family relationships, increases in school work, possible commencement of part-time work and increased time spent on social media, may all affect sleep (Becker et al., 2015).
There is a commonly held view that the amount of sleep young people are getting has been declining since the late 1990s (Keyes, Maslowsky, Hamilton, & Schulenberg, 2015), although research evidence for this idea is mixed (Matricciani et al., 2017). The reduction in sleep over the past decade or two has been accounted for by later bed times caused by increased use of technology and other changes associated with busy, modern lifestyles (Matricciani, Olds, & Williams, 2011). However, since children and adolescents need to get up early for school, any delays in bedtime on school nights lead to a loss of sleep.
Also, while getting enough sleep is important, good sleep quality is essential (Pilcher, Ginter, & Sadowsky, 1997). Poor sleep quality is associated with poorer physical and mental health outcomes, including anxiety, depression, fatigue and anger (Pilcher et al., 1997). How an individual rates their sleep quality most probably relates to sleep duration but also other aspects including difficulty falling asleep or staying asleep, troubled sleep, and how rested they feel when they wake up. Poor sleep quality is longitudinally associated with many of the same poor health, behaviour and performance outcomes as reduced sleep duration (Becker et al., 2015; Shochat et al., 2014).
Box 4.1: LSAC data examined in this chapter
This chapter uses data from B cohort children aged 6-7 (Wave 4), 8-9 (Wave 5) and 10-11 (Wave 6) years old, and K cohort children aged 12-13 (Wave 5), 14-15 (Wave 6) and 16-17 (Wave 7) years old, as shown below.
| Year | B cohort | K cohort |
|---|---|---|
| 2010 | 6-7 years | |
| 2012 | 8-9 years | 12-13 years |
| 2014 | 10-11 years | 14-15 years |
| 2016 | 16-17 years |
This chapter provides a comprehensive picture of children's and adolescents' sleep patterns in Australia today. Using the LSAC data collected between 2010 and 2016 from the B and K cohorts (Box 4.1), the chapter describes the times that children and adolescents went to bed and woke up, and the amount and quality of their sleep as they grew. The characteristics of adolescents who do not get enough sleep, including whether they thought they got enough sleep, are also described.
4.1 Bedtime
During adolescence, biological rhythms change in response to puberty causing sleep patterns to shift towards later times (Owens et al., 2014). The LSAC data showed that on both school and non-school nights (such as weekends and holidays) bedtimes got later as children got older (Figure 4.1). At all ages, bedtimes were approximately an hour later (44-75 minutes) on non-school nights than on school nights. Bedtimes may be more flexible on non-school nights as parents may be more relaxed about bedtime or the child or family may schedule more activities or social events. The average bedtime on school nights for 6-7 year olds was the same for boys and girls at around 8 pm. On non-school nights, the average bed time for 6-7 year olds was also the same for both sexes at around 8.40 pm. Bedtimes for boys and girls were similar for all other age groups and the average bedtime increased by approximately 15 minutes per year for children (from 6-7 years up to 10-11 years), and then by 30 minutes per year for adolescents (from 12-13 years up to 16-17 years). The average 16-17 year old went to bed at around 10.15 pm on school nights and between 11.00 and 11.30 pm on non-school nights.
Looking at the proportion of children going to bed at certain times, on school nights early bedtimes became less common as children got older. For example, nearly all 6-7 year olds (91%) went to bed before 9 pm, compared to only 6% of 16-17 year olds. Late bedtimes became more common as children got older. Very few children (less than 1%) under the age of 12-13 years went to bed after 11 pm, compared to 28% of adolescents at 16-17 years old (data not shown).
When considering the percentage of children going to bed at certain times on non-school nights, late bedtimes also became more common as children got older. Around 12% of 10-11 year olds and 70% of 16-17 year olds went to bed after 11 pm. Almost a third of 16-17 year olds (32%) regularly went to bed after midnight (data not shown).
Box 4.2: Timing of sleep
Details of usual bed, sleep and wake times were asked of the primary carer for younger children aged 6-7 and 8-9 years. At ages 10-11, 12-13, 14-15 and 16-17, study children/adolescents reported on their own bed, sleep and wake times. Parents or study children were asked to respond separately for both a usual school night, and a non-school night:
- About what time do you/does study child usually go to bed at night?
- About what time do you/does study child usually go to sleep at night?
- About what time do you/does study child usually wake up in the morning?
The time was recorded to the nearest 15 minutes.
Sleep duration is calculated as the time between going to sleep and waking up.
Sleep latency is calculated as the time between going to bed and falling asleep.
Parent-reported questions on bed time were adapted from the Early Childhood Longitudinal Study ECLS-K: 2007 (National Center for Education Statistics, 2019). All other questions were designed in LSAC.
Figure 4.1: Average bedtime on school nights and non-school nights, by age and sex
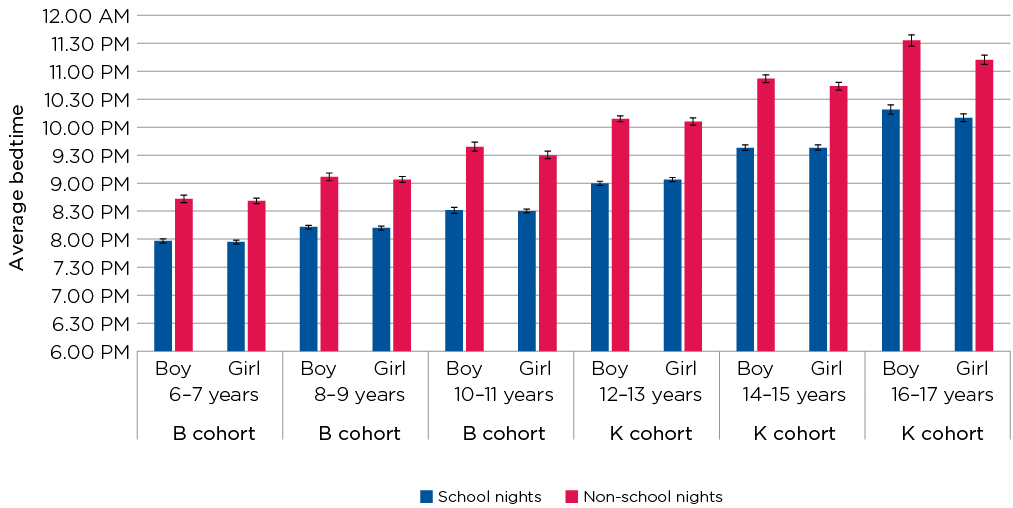
Notes: 6-7 year olds: n (boys) = 2,184; n (girls) = 2,054. 8-9 year olds: n (boys) = 2,082; n (girls) = 1,966. 10-11 year olds: n (boys) = 1,828; n (girls) = 1,754. 12-13 year olds: n (boys) = 1,959; n (girls) = 1,890. 14-15 year olds: n (boys) = 1,686; n (girls) = 1,631. 16-17 year olds: n (boys) = 1,498; n (girls) = 1,450. 95% confidence intervals are shown by the 'I' bars at the top of each column. Where confidence intervals for the groups being compared do not overlap, this indicates that the differences in values within each age category are statistically significant. Data were parent-reported at ages 6-7 and 8-9 years and self-reported at all other ages.
Source: LSAC Waves 4-7, B and K cohorts, weighted. B cohort: Waves 4 (6-7 years), 5 (8-9 years) and 6 (10-11 years). K cohort: Waves 5 (12-13 years), 6 (14-15 years) and 7 (16-17 years)
Credit: Longitudinal Study of Australian Children 2019 (creativecommons.org/licenses/by/4.0/)
4.2 Sleep-onset latency
Sleep-onset latency (SOL) is the time it takes to fall asleep after going to bed (Box 4.2). According to the US National Sleep Foundation, there is no 'right' amount of time for falling asleep although longer SOL periods are likely to lead to shorter sleep durations and reduced satisfaction with sleep (Mellor, Hallford, Tan, & Waterhouse, 2018). The LSAC data showed that SOL averaged between around 20 and 40 minutes and did not differ greatly by sex, age or whether it was a school or non-school night (Table 4.1). Girls had slightly longer SOL than boys at age 14-15 years (38 vs 34 minutes on school nights; 35 vs 30 minutes on non-school nights). Although there is little prior population data available on the SOL of Australian adolescents, these durations are similar to those found for US 11-17 year olds in 2006 (National Sleep Foundation, 2006).
Notes: 6-7 year olds: n (boys) = 2,158; n (girls) = 2,038. 8-9 year olds: n (boys) = 2,081; n (girls) = 1,965. 10-11 year olds: n (boys) = 1,594; n (girls) = 1,577. 12-13 year olds: n (boys) = 1,957; n (girls) = 1,890. 14-15 year olds: n (boys) = 1,682; n (girls) = 1,626. 16-17 year olds: n (boys) = 1,495; n (girls) = 1,449. * Statistically significant difference between sexes in the same age category at p < 0.05 level. Where 95% confidence intervals for the groups being compared do not overlap, this indicates that the differences in values are statistically significant. Data were parent-reported at ages 6-7 and 8-9 years and self-reported at all other ages.
Source: LSAC Waves 4-7, B and K cohorts, weighted. B cohort: Waves 4 (6-7 years), 5 (8-9 years) and 6 (10-11 years). K cohort: Waves 5 (12-13 years), 6 (14-15 years) and 7 (16-17 years)
4.3 Wake time
On average, children and adolescents of all ages woke up at around 7 am on school mornings (Figure 4.2). On non-school mornings they woke up later and the difference between wake times on school and non-school mornings increased with age. Six to seven year olds woke up around 40-45 minutes later on non-school mornings than on school mornings, while 16-17 year olds slept in an extra 2-2.5 hours on average on non-school mornings.
Looking at the proportion of children waking up at certain times, on school mornings the majority of children of all ages (around 56-66%) woke up between 6.30 and 7.30 am. On non-school mornings, late wake times became more common as children got older. For example, less than 2% of 6-7 year olds and around 25% of adolescents 16-17 years old woke up between 10 and 11 am on non-school days. Around 14% of adolescents 16-17 years old woke up after 11 am on non-school days.
Figure 4.2: Average wake times on school days and non-school days, by age and sex
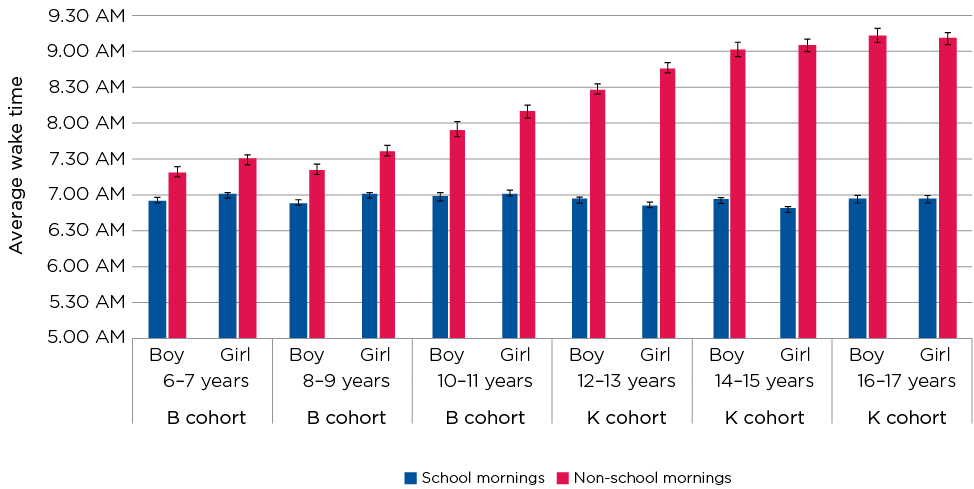
Notes: 6-7 year olds: n (boys) = 2,184; n (girls) = 2,054. 8-9 year olds: n (boys) = 2,082; n (girls) = 1,966. 10-11 year olds: n (boys) = 1,827; n (girls) = 1,754. 12-13 year olds: n (boys) = 1,956; n (girls) = 1,889. 14-15 year olds: n (boys) = 1,686; n (girls) = 1,631. 16-17 year olds: n (boys) = 1,498; n (girls) = 1,450. 95% confidence intervals are shown by the 'I' bars at the top of each column. Where confidence intervals for the groups being compared do not overlap, this indicates that the differences in values within each age category are statistically significant. Data were parent-reported at ages 6-7 and 8-9 years and self-reported at all other ages.
Source: LSAC Waves 4-7, B and K cohorts, weighted. B cohort: Waves 4 (6-7 years), 5 (8-9 years) and 6 (10-11 years). K cohort: Waves 5 (12-13 years), 6 (14-15 years) and 7 (16-17 years).
Credit: Longitudinal Study of Australian Children 2019 (creativecommons.org/licenses/by/4.0/)
4.4 How much sleep do children and adolescents get?
Getting the right amount of sleep is important for the maintenance of health, regulating emotions and school functioning. The average sleep duration (number of hours between falling asleep and waking up) of children and adolescents varied by age and days of the week (Box 4.2). On school nights, 6-7 year olds slept for an average of 10.5 hours each night (Figure 4.3). As children got older the total number of hours slept was reduced by about 15 minutes in each increasing child age category (6-7 years, 8-9 years and 10-11 years). In the adolescent age categories (12-13, 14-15 and 16-17 years), sleep duration was reduced by over 30 minutes in each increasing age category, with the 16-17 year age group obtaining 8.1 hours sleep on average on school nights.
Non-school nights provide opportunities for adolescents to choose their own sleep timing as they do not need to get up for school, allowing them to catch up on sleep that may have been missed throughout the school week. On non-school nights, 6-7 and 8-9 year olds had slightly less sleep on average than on school nights - about 10.4 and 10 hours, respectively (Figure 4.3).
Figure 4.3: Average sleep duration in hours, by age
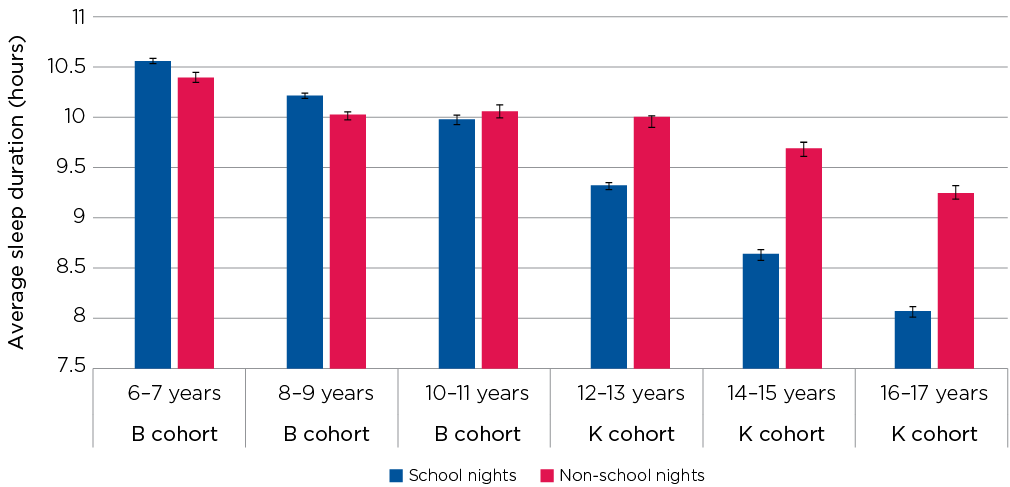
Notes: 6-7 year olds: n = 4,237. 8-9 year olds: n = 4,048. 10-11 year olds: n = 3,578. 12-13 year olds: n = 3,845. 14-15 year olds: n = 3,316. 16-17 year olds: n = 2,944. 95% confidence intervals are shown by the 'I' bars at the top of each column. Where confidence intervals for the groups being compared do not overlap, this indicates that the differences in values within each age category are statistically significant. Data were parent-reported at ages 6-7 and 8-9 years and self-reported at all other ages.
Source: LSAC Waves 4-7, B and K cohorts, weighted. B cohort: Waves 4 (6-7 years), 5 (8-9 years) and 6 (10-11 years). K cohort: Waves 5 (12-13 years), 6 (14-15 years) and 7 (16-17 years)
Credit: Longitudinal Study of Australian Children 2019 (creativecommons.org/licenses/by/4.0/)
Notes: 6-7 year olds: n (boys) = 2,183; n (girls) = 2,054. 8-9 year olds: n (boys) = 2,082; n (girls) = 1,966. 10-11 year olds: n (boys) = 1,825; n (girls) = 1,753. 12-13 year olds: n (boys) = 1,956; n (girls) = 1,889. 14-15 year olds: n (boys) = 1,685; n (girls) = 1,631. 16-17 year olds: n (boys) = 1,496; n (girls) = 1,448. * Statistically significant difference between sexes in the same age category at p < 0.05 level. Where 95% confidence intervals for the groups being compared do not overlap, this indicates that the differences in values are statistically significant. Data were parent-reported at ages 6-7 and 8-9 years and self-reported at all other ages.
Source: LSAC Waves 4-7, B and K cohorts, weighted. B cohort: Waves 4 (6-7 years), 5 (8-9 years) and 6 (10-11 years). K cohort: Waves 5 (12-13 years), 6 (14-15 years) and 7 (16-17 years)
However, for the older age categories (12-13, 14-15 and 16-17 years), adolescents obtained substantially more sleep on non-school nights than on school nights. On average, 16-17 year olds slept over an hour longer on non-school nights than on school nights.
There were some differences in sleep duration between boys and girls (Table 4.2). At younger ages (6-7 years and 8-9 years), girls slept for slightly longer (9-32 minutes on average) than boys on both school nights and non-school nights. At older ages (10-11, 12-13, 14-15 and 16-17 years), girls slept for longer than boys on non-school nights although not on school nights. Sleep duration on non-school nights is likely to be more reflective of actual sleep needs, given young people are most probably able to sleep for as long as they require (without being artificially woken up). The longer sleep duration in girls may reflect a sex difference in sleep requirements with females requiring more sleep than males, although this difference is not well established (Olds, Blunden, Petkov, & Forchino, 2010). The exceptions to these differences were seen at ages 12-13 and 14-15 years where boys obtained more sleep than girls on school nights.
4.5 How many children and adolescents do not meet the minimum sleep guidelines?
The amount of sleep needed varies across the lifespan and from person to person. The Australian Department of Health recommends between nine and 11 hours of sleep for children (aged 5-13 years) and between eight and 10 hours of sleep for adolescents (aged 14-17 years) (Box 4.3). Examination of the LSAC data showed that the majority of children at ages 6-7, 8-9 and 10-11 years (at least 88% at all ages) met the minimum sleep requirements on school nights (Figure 4.4). However, during the high school years (from ages 12-13 to 16-17 years), smaller percentages of adolescents met the minimum sleep requirements. Around one in four 12-13 year olds and 14-15 year olds did not get enough sleep, and around half of 16-17 year olds did not get enough sleep on school nights (Figure 4.4).
Box 4.3: Sleep guidelines for children and adolescents
The exact amount of sleep needed varies from person to person and also within individuals according to age and daily variations in physical activity, illness and recent sleep patterns. Guidelines therefore provide maximum and minimum ranges for the number of hours of uninterrupted sleep in each 24-hour period as indicated in the table below.
| Life stage | Recommended | Age |
|---|---|---|
| Children | 5-13 years | 9-11 hours |
| Adolescents | 14-17 years | 8-10 hours |
Consistent bed and wake-up times are recommended.
Source: Department of Health (2019). Based on guidelines produced by the US based National Sleep Foundation (Hirshkowitz et al., 2015)
On non-school nights, fewer children at younger ages (6-7, 8-9 and 10-11 years) met minimum sleep guidelines than on school nights. For example, at 10-11 years of age, one in four boys and one in eight girls did not get the required amount of sleep on non-school nights. It is possible that children at this age were allowed to stay up later on non-school nights but did not compensate, as older adolescents did, by waking up later in the morning, and therefore lost sleep. For the older age categories, 12-13 years and over, generally more adolescents met the sleep guidelines on non-school nights than on school nights. Older adolescents woke up later on non-school days and therefore increased their sleep duration on these nights. This suggests a common weekly sleep pattern in which older adolescents did not get enough sleep on school nights but they 'caught up' by sleeping longer on non-school nights.
The following sections focus on three ages:
- at 12-13 years, as they enter secondary school and are going through puberty, when 27% are not meeting the minimum sleep guidelines
- at 14-15 years, as they transition through secondary school, when 26% are not meeting the minimum sleep guidelines
- at 16-17 years, as they enter the senior secondary school years and over half (52%) are not meeting the minimum sleep guidelines.
The sections below focus only on adolescents aged 12 years and older because the proportions of adolescents not meeting the sleep guidelines are higher than those for children aged 6-11 years (see Figure 4.4).
Figure 4.4: Proportion of children and adolescents not meeting minimum sleep guidelines on school and non-school nights, by age and sex
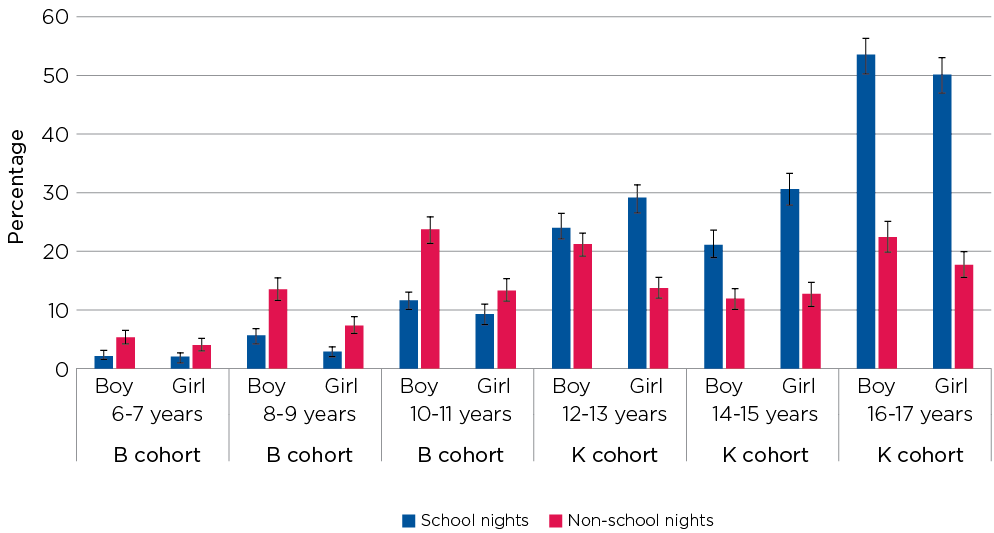
Notes: 6-7 year olds: n (boys) = 2,183; n (girls) = 2,054. 8-9 year olds: n (boys) = 2,082; n (girls) = 1,966. 10-11 year olds: n (boys) = 1,825; n (girls) = 1,753. 12-13 year olds: n (boys) = 1,956; n (girls) = 1,889. 14-15 year olds: n (boys) = 1,685; n (girls) = 1,631. 16-17 year olds: n (boys) = 1,496; n (girls) = 1,448. 95% confidence intervals are shown by the 'I' bars at the top of each column. Where confidence intervals for the groups being compared do not overlap, this indicates that the differences in values within each age category are statistically significant. Data were parent-reported at ages 6-7 and 8-9 years and self-reported at all other ages.
Source: LSAC Waves 4-7, B and K cohorts, weighted. B cohort: Waves 4 (6-7 years), 5 (8-9 years) and 6 (10-11 years). K cohort: Waves 5 (12-13 years), 6 (14-15 years) and 7 (16-17 years)
Credit: Longitudinal Study of Australian Children 2019 (creativecommons.org/licenses/by/4.0/)
Figure 4.5: A quarter of 12-13 year olds and a half of 16-17 year olds are not meeting minimum sleep guidelines on school nights
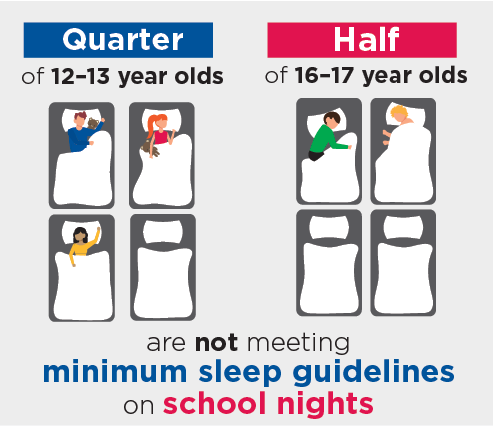
Credit: Longitudinal Study of Australian Children 2019 (creativecommons.org/licenses/by/4.0/)
4.6 Adolescent self-reported sleep quality and quantity
How adolescents rate the quantity and quality of their sleep is likely to reflect a combination of their experience during the night and how rested they feel the next day.
LSAC data showed that the numbers of boys and girls thinking that they did not get enough sleep increased with age (Table 4.3). Around one in 10 boys reported not getting enough sleep at age 12-13 years, one in eight at 14-15 years and one in five at 16-17 years. At all ages, more girls than boys thought they did not get enough sleep. At age 16-17, over one third of girls felt that they did not get enough sleep.
Box 4.4: Self-reported sleep quality and quantity
At Waves 5, 6 and 7 study adolescents in the K cohort (ages 12-13, 14-15 and 16-17 years) were asked to report on their sleep quantity and quality.
For sleep quantity, adolescents were asked to nominate 'plenty', 'just enough', 'not quite enough' and 'not nearly enough' in response to the question, 'During the last month, do you think you usually got enough sleep?'
Adolescents were classified as not getting enough sleep if they selected 'not quite enough' or 'not nearly enough'.
For sleep quality, adolescents were asked, 'During the last month, how well do you feel you have slept in general?'
Response options were: 'very well', 'fairly well', 'fairly badly' and 'very badly'.
Adolescents were classified as having poor quality sleep if they selected 'fairly badly' or 'very badly'.
Items on sleep quality and quantity were designed in LSAC.
Comparisons of adolescents not getting enough sleep according to the national sleep guidelines against those self-reporting not getting enough sleep showed that substantial proportions of adolescents thought they were getting enough sleep when they were in fact not meeting guidelines (Table 4.3). For example:
- Among 12-13 year olds not getting the required minimum amount of sleep on school nights according to professional guidelines (25% of boys and 29% of girls), 86% of boys (21% of all boys) and 76% of girls (22% of all girls) felt that they were getting enough sleep.
- Among 14-15 year olds not getting the required minimum amount of sleep on school nights according to professional guidelines (21% of boys and 31% of girls), 79% of boys (17% of all boys) and 58% of girls (18% of all girls) felt that they were getting enough sleep.
- Among 16-17 year olds not meeting the required minimum amount of sleep on school nights according to professional guidelines (54% of boys and 50% of girls), 71% of boys (38% of all boys) and 53% of girls (27% of all girls) felt that they were getting enough sleep.
Seventy-one to 86% of boys and 53-76% of girls not meeting minimum sleep guidelines felt they got enough sleep; this difference was more apparent at younger ages. It appears that adolescents may become habituated to or unable to recognise daytime tiredness, especially at younger ages. Higher numbers of boys than girls were in this group.
Adolescents also reported on their sleep quality. The percentage of children reporting poor sleep quality increased with age from 4% at age 12-13 years to 16% at age 16-17 years. Girls at 14-15 and 16-17 years were more likely than boys to report poor quality sleep (Table 4.4). At 16-17 years, one in five girls and one in eight boys felt that they had poor quality sleep in the past month.
Comparisons of adolescents not getting enough sleep according to the national sleep guidelines against those self-reporting poor quality sleep showed that only a minority of adolescents who did not get enough sleep reported poor quality sleep (Table 4.4). For example:
- Among 12-13 year olds not getting the required minimum amount of sleep on school nights according to professional guidelines (25% of boys and 29% of girls), 6% of boys (1% of all boys) and 8% of girls (2% of all girls) felt that they had poor quality sleep.
- Among 14-15 year olds not getting the required minimum amount of sleep on school nights according to professional guidelines (21% of boys and 31% of girls), 13% of boys (3% of all boys) and 23% of girls (7% of all girls) felt that they had poor quality sleep.
- Among 16-17 year olds not getting the required minimum amount of sleep on school nights according to professional guidelines (54% of boys and 50% of girls), 18% of boys (10% of all boys) and 26% of girls (13% of all girls) felt that they had poor quality sleep.
Notes: 12-13 year olds: n (boys) = 1,956; n (girls) = 1,889. 14-15 year olds: n (boys) = 1,685; n (girls) = 1,631. 16-17 year olds: n (boys) = 1,496; n (girls) = 1,448. Percentages may not total exactly 100.0% due to rounding. * Statistically significant difference between sexes in the same age category at p < 0.05 level. Where 95% confidence intervals for the groups being compared do not overlap, this indicates that the differences in values are statistically significant.
Source: LSAC K cohort, weighted: Wave 5 (12-13 years), 6 (14-15 years) and 7 (16-17 years)
4.7 Characteristics of children not getting enough sleep
This section examines the characteristics of adolescents not getting enough sleep at ages 12-17 years.
Demographic and family characteristics
At ages 12-13 and 14-15 years, there were some differences in the proportions of adolescents meeting minimum sleep guidelines by demographic and family characteristics (Table 4.5). However, no differences were apparent at age 16-17 years.
- More girls than boys were not meeting the minimum sleep guidelines (29% of girls vs 25% of boys at age 12-13 years; 31% of girls vs 21% of boys at 14-15 years). This is likely to be due to girls at these ages waking up slightly earlier than boys on school days (Figure 4.2). At 16-17 years, there was no difference in the proportions of girls and boys meeting minimum sleep guidelines. Girls and boys at this age were waking up at similar times (Figure 4.2).
- At 12-13 years, approximately 31% of youngest children compared to 23% of first borns were not meeting sleep guidelines. The fact that these differences were not observed for 14-15 year olds and 16-17 year olds may reflect changes in parents' involvement in bedtimes and sleep as children grow up.
- The importance of regular bedtimes is highlighted by the fact that far more younger adolescents (12-13 years) whose parents always enforced regular bedtimes were meeting sleep guidelines (79% vs 55% of those with less strict bedtimes).
The proportions of adolescents at ages 12-13, 14-15 and 16-17 not meeting minimum sleep guidelines did not differ by parent education, income or lone parent household status (Table 4.5).
Notes: * Statistically significant difference from reference category at p < 0.05 level. Where 95% confidence intervals for the groups being compared do not overlap, this indicates that the differences in values are statistically significant. a A parent of the study child was asked, 'Does the study child go to bed at regular times?' ('Regular' means at a similar time each night, not whether it is early or late). b Only available for age 12-13 years (Wave 5, K cohort). Sample sizes correspond to the number of study children with complete data on (i) each characteristic (shown in the left-hand column) and (ii) whether or not they met minimum sleep guidelines at a particular age.
Source: LSAC K cohort, weighted: Wave 5 (12-13 years), 6 (14-15 years) and 7 (16-17 years)
Mental health characteristics
Poor sleep quality and insufficient sleep have been linked to poor mental health in adolescents (Shochat et al., 2014). These links may be especially relevant in adolescence since sleep problems, such as lack of sleep, and mental health problems are both known to increase during these years. At 12-13, 14-15 and 16-17 years, adolescents not meeting the minimum sleep guidelines were more likely to show symptoms of anxiety and depression and were less likely to report being happy (Table 4.6).
Box 4.5: Symptoms of anxiety and depression
At ages 12-13, 14-15 and 16-17 years, adolescents reported on various aspects of their mental health, including symptoms of depression and anxiety.
Depressive symptoms were measured using the Short Mood and Feelings Questionnaire (Angold et al., 1995).
Anxiety symptoms were measured using the Spence Children's Anxiety Scale (Spence, 1998).
On both measures, adolescents can be categorised as either having symptoms or having no symptoms of these mental health difficulties. For depression, adolescents' scores ranged from 0 to 26, with scores of 8 or more indicating that the adolescent had symptoms of depression (Angold et al., 1995).
For anxiety, adolescents' scores ranged from 0 to 24, with scores of 9 or more for boys and 11 or more for girls indicating that the adolescent had symptoms of anxiety (Spence, 1998).
- Of adolescents with symptoms of anxiety, 35% (at 12-13 years), 40% (at 14-15 years) and 59% (at 16-17 years) did not meet the minimum sleep guidelines. This is considerably more than for those without anxiety symptoms (25%, 22% and 49%, respectively).
- Thirty-five per cent of 12-13 year olds, 38% of 14-15 year olds and 58% of 16-17 year olds with depressive symptoms did not meet the minimum sleep guidelines, significantly more than for those without depressive symptoms (25%, 22% and 48%, respectively).
- Greater proportions of adolescents who rated themselves 'not happy' compared to 'happy' did not meet the minimum sleep guidelines (59% compared to 48% of 16-17 year olds, 31% compared to 24% of 14-15 year olds and 35% compared to 24% of 12-13 year olds).
Notes: * Statistically significant difference from reference category at p < 0.05 level. Where 95% confidence intervals for the groups being compared do not overlap, this indicates that the differences in values are statistically significant. a Participants were asked to rate their agreement to the following statement, 'I am happy with how things are for me in my life right now'. Those rating 'strongly agree' or 'agree' were classified as happy and those rating 'strongly disagree', 'disagree' or 'neither agree nor disagree' were classified as not happy. Sample sizes correspond to the number of study children with complete data on (i) each characteristic (shown in the left-hand column) and (ii) whether or not they met minimum sleep guidelines at a particular age.
Source: LSAC K cohort, weighted: Wave 5 (12-13 years), 6 (14-15 years) and 7 (16-17 years)
Sleep deprivation, anxiety and depression often occur sequentially within individuals (Becker et al., 2015) but it would be of great interest to explore LSAC data across multiple waves to unpack whether lack of sleep leads to poor mental health or if poor mental health predisposes adolescents to lack of sleep.
Physical health characteristics
Sleep and physical health are intimately related. Poor physical health may affect sleep quantity and quality, and poor sleep may contribute to a range of negative physical health outcomes. For example, adequate sleep has been linked to physical activity levels and body composition.
Body fat is associated with sleep duration in adolescents, with overweight and obese adolescents having shorter sleep duration (Chaput et al., 2016). In LSAC, around one in 13 12-13 year olds, one in 11 14-15 year olds and one in nine 16-17 year olds were obese. Obese 12-13 year olds were more likely than adolescents in the normal weight range to not meet minimum sleep guidelines (37% compared to 26% of normal weight adolescents) (Table 4.7). However, at 14-15 and 16-17 years, there was no difference between the proportions of obese and normal weight adolescents not meeting the minimum sleep guidelines, suggesting a different relationship between weight status and sleep duration at older ages. There is less evidence for a causal relationship between obesity and sleep in adults than there is for children (McAllister et al., 2009).
Caffeine intake in the form of soft drinks and coffee may have a profound effect on sleep due to its stimulatory properties and is known to affect sleep quality in adolescents (Orbeta, Overpeck, Ramcharran, Kogan, & Ledsky, 2006). More 14-15 year olds who consumed caffeine failed to meet the minimum sleep guidelines on school nights (33% compared to 24% for adolescents who did not consume caffeine on the previous day), suggesting caffeine intake directly affected sleep duration. Adolescents may consume caffeine as a strategy to stay up later or simply because they enjoy consuming these drinks. No differences were observed among 16-17 year olds.
Participation in sport activities might have mixed effects on sleep. It may add an extra component to the range of things adolescents do between school and bedtime (including extracurricular activities, homework, part-time jobs, downtime/relaxing and socialising) and thereby delay bedtime and reduce sleep duration. On the other hand, sports participation might provide physiological and psychological benefits to good sleep and increase sleep quantity and quality. The Australian 24-hour movement guidelines suggest that for greater health benefits, sedentary time should be replaced with additional moderate to vigorous physical activity, while preserving sufficient sleep (Department of Health, 2019). In LSAC, 12-13 year olds and 14-15 year olds who participated in sport were more likely to meet the minimum sleep guidelines (76% vs 70% who did not participate in sport for 12-13 year olds and 79% vs 69% for those who did not participate in sport for 14-15 year olds) (Table 4.7), suggesting that physical activity is associated with longer sleep durations.
Having a medical condition might also impair children's abilities to fall asleep. However, in LSAC, there were no differences in the proportions of 12-13, 14-15 and 16-17 year olds not meeting minimum sleep guidelines, according to whether or not they had a medical condition.
Notes: * Statistically significant difference from reference category at p < 0.05 level. Where 95% confidence intervals for the groups being compared do not overlap, this indicates that the differences in values are statistically significant. a Based on body mass index (BMI) calculated from height and weight measurements using established cut-offs (Cole, Flegal, Nicholls, & Jackson, 2007). b A parent was asked if the study child has any medical conditions or disabilities that have lasted, or are likely to last, for six months or more. c Only available for ages 14-15 and 16-17 years (Waves 6 and 7, K cohort). d A parent was asked if the study child had participated in team (i.e. football, cricket or netball) or individual (individual sport, coached or lessons, e.g. swimming, tennis, karate or gymnastics) sport in the past week. e Only available for ages 12-13 and 14-15 years (Waves 5 and 6, K cohort). Sample sizes correspond to the number of study children with complete data on (i) each characteristic (shown in the left-hand column) and (ii) whether or not they met minimum sleep guidelines at a particular age.
Source: LSAC K cohort, weighted: Wave 5 (12-13 years), 6 (14-15 years) and 7 (16-17 years)
Screen use characteristics
Adolescents today are surrounded by information and entertainment on screens, and screen use is a major part of social lives and education. As of 2017, almost all Australian teenagers and two-thirds of primary school-aged children have their own mobile screen-based device and almost half of all children regularly use screen-based devices at bedtime (Rhodes, 2017). Adolescents and their parents recognise that distractions from electronic devices are often a barrier to sleep (Godsell & White, 2019). More screen use is related to delayed sleep onset and shorter adolescent sleep duration (Bartel, Richardson, & Gradisar, 2018; Stiglic & Viner, 2019), and many paediatric authorities now advise that children of all ages should have no screen time for one hour before bed (Radesky & Christakis, 2016; Viner, 2019).
The LSAC data did not find any difference in the proportion of adolescents not meeting the minimum sleep guidelines at either 12-13 or 16-17 years of age according to the amount of TV they watched or time spent on electronic gaming. TV viewing has been found to be the least likely media device to be related to lack of sleep (Hale & Guan, 2015). However, internet access was related to the likelihood of not meeting minimum sleep guidelines with over 28% of those in the 12-13 year age group and 27% of those in the 14-15 year age group with internet access in their bedrooms not meeting guidelines, compared to 23% and 15%, respectively, of those without bedroom internet (Table 4.8). For 16-17 year olds, the likelihood of not meeting sleep guidelines increased with increasing time spent on the internet. Almost two-thirds of 16-17 year olds who spent eight or more hours a day on the internet were not meeting sleep guidelines, compared to just over a third who spent less than two hours a day on the internet. Almost one in five 16-17 year olds (18%) spent eight or more hours per day on the internet. Two thirds (68%) spent between two and eight hours per day, and over half of this group were not meeting minimum sleep guidelines.
Further analysis of data at multiple waves could reveal whether internet use contributes to reduced sleep durations or whether adolescents who have difficulty sleeping use the internet to deal with sleep difficulties, or simply have more time to spend on media use because they are sleeping less. There have been several reports of adolescents using media to help them to fall asleep (Eggermont & Van den Bulck, 2006; Noland, Price, Dake, & Telljohann, 2009), despite the established links between increased media use and less sleep. It should be kept in mind that these analyses do not adjust for potential confounders. For example, physical activity might relate to children spending less time on screens and also sleeping longer.
Notes: * Statistically significant difference from reference category at p < 0.05 level. Where 95% confidence intervals for the groups being compared do not overlap, this indicates that the differences in values are statistically significant. a Only available for ages 12-13 and 16-17 years (Waves 5 and 7, K cohort). b Only available for ages 12-13 and 14-15 years (Waves 5 and 6, K cohort). c Only available for age 16-17 years (Wave 7, K cohort). Sample sizes correspond to the number of study children with complete data on (i) each characteristic (shown in the left-hand column) and (ii) whether or not they met minimum sleep guidelines at a particular age.
Source: LSAC K cohort, weighted: Wave 5 (12-13 years), 6 (14-15 years) and 7 (16-17 years)
School characteristics
Australian school students face increasing homework demands as they progress through secondary school. LSAC data showed that the percentage of students spending five hours per week or more on homework increased from 9% at 12-13 years through 13% at 14-15 years to 27% at 16-17 years. At all three ages, adolescents spending more than five hours on homework per week were more likely to not meet the minimum sleep guidelines than those doing 1-3 hours per week. Homework may displace sleep time, especially when adolescents have a busy schedule after school. It may also be relevant that today nearly all homework activities are completed on a PC, laptop or mobile device and exposure to blue light from screens in the evening may affect sleep duration (Lissak, 2018). Yet another factor may be that time spent on homework may increase adolescents' stress and depressive symptoms (Kouzma & Kennedy, 2002), which may negatively affect sleep.
Lack of sleep in adolescents has been linked to increased absenteeism and being late for school (Drake et al., 2003; Hysing, Haugland, Stormark, Boe, & Sivertsen, 2015). The LSAC data showed that 14-15 and 16-17 year olds who had been absent from or late for school recently were more likely to not meet the minimum sleep guidelines but whether absenteeism is a cause or a consequence of not meeting minimum sleep guidelines cannot be disentangled from the current analyses.
Notes: * Statistically significant difference from reference category at p < 0.05 level. Where 95% confidence intervals for the groups being compared do not overlap, this indicates that the differences in values are statistically significant. a Only available for ages 14-15 and 16-17 years (Waves 6 and 7, K cohort). Sample sizes correspond to the number of study children with complete data on (i) each characteristic (shown in the left-hand column) and (ii) whether or not they met minimum sleep guidelines at a particular age.
Source: LSAC K cohort, weighted: Wave 5 (12-13 years), 6 (14-15 years) and 7 (16-17 years)
Summary
This chapter has provided a picture of the sleep patterns of children and adolescents between the ages of 6 and 17 years. The LSAC data showed that on school nights large numbers of Australian young people slept less than current sleep duration recommendations, supporting earlier Australian research conducted on 9-18 year olds between 2001 and 2007 (Olds, Maher, Blunden, & Matricciani, 2010). This observation is particularly concerning given the known associations between shorter sleep duration and poorer health and wellbeing, some of which, such as higher rates of anxiety, depression and obesity, are shown in this chapter. It is also a concern that the majority of those children and adolescents not getting enough sleep, particularly at younger ages, appear to be unaware that they were lacking in sleep as defined by the guidelines.
However, the picture is not all negative. The majority of children between 6 and 11 years of age were getting enough sleep (i.e. met minimum sleep guidelines). The high numbers of adolescents in the older age groups (12-13, 14-15 and 16-17 years) missing out on sleep suggests that policy attention should be directed towards this issue. However, it is not yet possible to determine the true amount of sleep needed by any one individual. The US National Sleep Foundation has introduced a 'may be appropriate' window into their guidelines to acknowledge that for some 6-13 year olds, 7-8 hours might be enough sleep and for some 14-17 year olds, seven hours might be enough sleep. Because of individual variation in the amount of sleep that adolescents may require, it is therefore important to consider self-reported sleep quality and quantity, as was done in this chapter.
Another key observation in this chapter was the difference in the times children and adolescents went to bed and woke up between school and non-school nights. These findings support previous Australian research, which showed that wake times were around 82 minutes later and bedtimes were around 34 minutes later on non-school days than on school days (Olds, Maher et al., 2010). Older adolescents often develop sleep patterns where they under-sleep on school nights and catch up on non-school nights. The tendency for this 'yoyo' pattern of sleep across the week increases with age. Although oversleeping on non-school nights can provide some temporary relief from sleepiness built up during the school week, it also leads to disrupted sleep-wake cycles and is in contradiction to the sleep guidelines, which advise regular sleep and wake-up times.
This chapter highlights areas where intervention may be beneficial. The group most at risk of not getting enough sleep is older adolescents on school nights. Although many researchers and public health advocates have suggested later morning start times for high school in order to increase the opportunity for later wake times and more sleep - and trials of this have shown promising effects on health and education outcomes (Minges & Redeker, 2016) - implementing such changes are often difficult for school communities and families to organise. Although beyond the scope of this chapter, an examination of the wake times of absentees on school days could indicate whether later high school start times would reduce absenteeism. Another strategy would be sleep interventions aimed at teaching school students about the importance of sleep and what they can do to improve their sleep (such as reducing caffeine intake, limiting screen use before bedtime, keeping a consistent sleep routine and getting plenty of physical activity). Such programs have been shown to increase sleep-related knowledge, but achieving sleep-related behavioural change has been less consistent (Blunden, Chapman, & Rigney, 2012).
Another group that appears to be at risk of not getting enough sleep is younger-aged children, especially boys, on non-school nights. Although perhaps of less concern because there are fewer non-school nights in the year, it may be worthwhile highlighting to parents the importance of regular bedtimes, even on weekends and holidays for younger children.
There are many possible avenues of further research using LSAC data that would directly inform policy and practice around child and adolescent sleep. Aspects of sleep other than insufficient sleep, which has been the focus of this chapter, could be examined. For example, the prevalence and effects of too much sleep could be explored, as could subjective sleep quality and the timing of sleep within the day. All of these features of sleep relate to a general concept of 'sleep health' (Buysse, 2014), in which sleep and wakefulness are adapted to individual, social and environmental demands providing sustained alertness in the day, as well as ongoing satisfaction and physical and mental wellbeing.
References
Angold, A., Costello, E. J., Messer, S. C., Pickles, A., Winder, F., & Silver, D. (1995). Development of a short questionnaire for use in epidemiological studies of depression in children and adolescents. International Journal of Methods in Psychiatric Research, 5, 237-249.
Astill, R. G., Van der Heijden, K. B., Van Ijzendoorn, M. H., & Van Someren, E. J. W. (2012). Sleep, cognition, and behavioral problems in school-age children: A century of research meta-analyzed. Psychological Bulletin, 138(6), 1109-1138.
Bartel, K., Richardson, C., & Gradisar, M. (2018). Sleep and mental wellbeing: Exploring the links. Melbourne: Victorian Health Promotion Foundation.
Becker, S. P., Langberg, J. M., & Byars, K. C. (2015). Advancing a biopsychosocial and contextual model of sleep in adolescence: A review and introduction to the special issue. Journal of Youth and Adolescence, 44(2), 239-270.
Blunden, S. L., Chapman, J., & Rigney, G. A. (2012). Are sleep education programs successful? The case for improved and consistent research efforts. Sleep Medicine Reviews, 16(4), 355-370.
Buysse, D. J. (2014). Sleep health: Can we define it? Does it matter? Sleep, 37(1), 9-17.
Chaput, J. P., Gray, C. E., Poitras, V. J., Carson, V., Gruber, R., Olds, T. et al. (2016). Systematic review of the relationships between sleep duration and health indicators in school-aged children and youth. Applied Physiology, Nutrition and Metabolism, 41(6), S266-S282.
Cole, T. J., Flegal, K. M., Nicholls, D., & Jackson, A. A. (2007). Body mass index cut-offs to define thinness in children and adolescents: International survey. British Medical Journal, 335, 194-202.
Crowley, S. J., Acebo, C., & Carskadon, M. A. (2007). Sleep, circadian rhythms, and delayed phase in adolescence. Sleep Medicine, 8(6), 602-612.
Department of Health. (2019). Australian 24-hour movement guidelines for children (5-12 years) and young people (13-17 years): An integration of physical activity, sedentary behaviour, and sleep. Canberra: Department of Health. Retrieved from www.health.gov.au/internet/main/publishing.nsf/Content/health-pubhlth-st...
Drake, C., Nickel, C., Burduvali, E., Roth, T., Jefferson, C., & Badia, P. (2003). The pediatric daytime sleepiness scale (pdss): Sleep habits and school outcomes in middle-school children. Sleep, 26(4), 455-458.
Eggermont, S., & Van den Bulck, J. (2006). Nodding off or switching off? The use of popular media as a sleep aid in secondary-school children. Journal of Paediatrics and Child Health, 42(7/8), 428-433.
Godsell, S., & White, J. (2019). Adolescent perceptions of sleep and influences on sleep behaviour: A qualitative study. Journal of Adolescence, 73, 18-25.
Gozal, D., & Kheirandish-Gozal, L. (2007). Neurocognitive and behavioral morbidity in children with sleep disorders. Current Opinion in Pulmonary Medicine, 13(6), 505-509.
Hale, L., & Guan, S. (2015). Screen time and sleep among school-aged children and adolescents: A systematic literature review. Sleep Medicine Reviews, 21, 50-58.
Hirshkowitz, M., Whiton, K., Albert, S. M., Alessi, C., Bruni, O., DonCarlos, L. et al. (2015). National sleep foundation's sleep time duration recommendations: Methodology and results summary. Sleep Health, 1(1), 40-43.
Hysing, M., Haugland, S., Stormark, K. M., Boe, T., & Sivertsen, B. (2015). Sleep and school attendance in adolescence: Results from a large population-based study. Scandanavian Journal of Public Health, 43(1), 2-9.
Keyes, K. M., Maslowsky, J., Hamilton, A., & Schulenberg, J. (2015). The great sleep recession: Changes in sleep duration among US adolescents, 1991-2012. Pediatrics, 3, 460-469.
Kouzma, N. M., & Kennedy, G. A. (2002). Homework, stress, and mood disturbance in senior high school students. Psychological Reports, 91(1), 193-198.
Landhuis, C. E., Poulton, R., Welch, D., & Hancox, R. J. (2008). Childhood sleep time and long-term risk for obesity: A 32-year prospective birth cohort study. Pediatrics, 122(5), 955-960.
Lissak, G. (2018). Adverse physiological and psychological effects of screen time on children and adolescents: Literature review and case study. Environmental Research, 164, 149-157.
Matricciani, L., Bin, Y. S., Lallukka, T., Kronholm, E., Dumuid, D., Paquet, C., & Olds, T. (2017). Past, present, and future: Trends in sleep duration and implications for public health. Sleep Health: Journal of the National Sleep Foundation, 3(5), 317-323.
Matricciani, L., Olds, T., & Williams, M. (2011). A review of evidence for the claim that children are sleeping less than in the past. Sleep, 34(5), 651-659.
McAllister, E. J., Dhurandhar, N. V., Keith, S. W., Aronne, L. J., Barger, J., Baskin, M. et al. (2009). Ten putative contributors to the obesity epidemic. Critical Reviews in Food Science and Nutrition, 49(10), 868-913.
Mellor, D., Hallford, D. J., Tan, J., & Waterhouse, M. (2018). Sleep-competing behaviours among Australian school-attending youth: Associations with sleep, mental health and daytime functioning. International Journal of Psychology. doi: 10.1002/ijop.12548.
Minges, K. E., & Redeker, N. S. (2016). Delayed school start times and adolescent sleep: A systematic review of the experimental evidence. Sleep Medicine Reviews, 28, 86-95.
National Center for Education Statistics. (2019). Early Childhood Longitudinal Program (ECLS) - Kindergarten class of 1998-99 (ECLS-K). Washington, D.C.: National Center for Education Statistics. Retrieved from https://nces.ed.gov/ecls/kindergarten.asp
National Sleep Foundation. (2006). The NSF 2006 sleep in America poll. Washington DC: National Sleep Foundation.
Noland, H., Price, J. H., Dake, J., & Telljohann, S. K. (2009). Adolescents' sleep behaviors and perceptions of sleep. Journal of School Health, 79(5), 224-230.
Olds, T., Blunden, S., Petkov, J., & Forchino, F. (2010). The relationships between sex, age, geography and time in bed in adolescents: A meta-analysis of data from 23 countries. Sleep Medicine Reviews, 14(6), 371-378.
Olds, T., Maher, C., Blunden, S., & Matricciani, L. (2010). Normative data on the sleep habits of Australian children and adolescents. Sleep, 3(10), 1381-1388.
Orbeta, R. L., Overpeck, M. D., Ramcharran, D., Kogan, M. D., & Ledsky, R. (2006). High caffeine intake in adolescents: Associations with difficulty sleeping and feeling tired in the morning. Journal of Adolescent Health, 38(4), 451-453.
Owens, J. A., Au, R., Carskadon, M., Millman, R., & Wolfson, A. (2014). School start times for adolescents. Pediatrics, 134(3), 642-649.
Pilcher, J. J., Ginter, D. R., & Sadowsky, B. (1997). Sleep quality versus sleep quantity: Relationships between sleep and measures of health, well-being and sleepiness in college students. Journal of Psychosomatic Research, 42(6), 583-596.
Radesky, J., & Christakis, D. (2016). Media and young minds. Pediatrics, 138, e20162591.
Rhodes, A. (2017). Screen time and kids: What's happening in our homes? (Australian Child Health Poll 7).
Shochat, T., Cohen-Zion, M., & Tzischinsky, O. (2014). Functional consequences of inadequate sleep in adolescents: A systematic review. Sleep Medicine Reviews, 18(1), 75-87.
Spence, S. H. (1998). A measure of anxiety symptoms among children. Behaviour Research and Therapy, 36(5), 545-566.
Stiglic, N., & Viner, R. M. (2019). Effects of screentime on the health and well-being of children and adolescents: A systematic review of reviews. BMJ Open, 9(1), e023191-e023191.
Viner, R., Davie, M., & Firth, A. (2019). The health impacts of screen time: A guide for clinicians and parents. Retrieved from https://www.rcpch.ac.uk/sites/default/files/2018-12/rcpch_screen_time_gu...
Featured image: © GettyImages/FG Trade
Publication details
Download Publication
Share


