5. Australian children's screen time and participation in extracurricular activities
5. Australian children's screen time and participation in extracurricular activities

5.1 Introduction
Over the past decade, screen time has begun to play an increasing role in children's lives. Media devices such as computers and mobile devices have provided significant opportunities for sociability, learning, creativity, self-expression and entertainment, and television remains a central element of children's leisure time (Houghton et al., 2015). High levels of screen-based activities during childhood, however, have detrimental effects on aspects of children's wellbeing (Caroli, Argentieri, Cardone, & Masi, 2004; Laurson, Lee, Gentile, Walsh, & Eisenmann, 2014). As a consequence, there has been considerable interest in understanding more about how much time children spend on screen-based activities, how the amount of screen time varies across children from different families, and whether time spent on these activities is related to children's time spent on other activities and their wellbeing. This chapter uses LSAC data to explore some of these issues.
Use of new electronic media, such as computers and electronic games, has become increasingly prevalent in children's lives, with almost every Australian household with children under 15 years of age (96%) having access to the Internet at home in 2012-13 (Australian Bureau of Statistics, 2014). As at April 2012, 90% of children aged 5-14 years had accessed the Internet in the previous year (Australian Bureau of Statistics, 2012). According to this same survey, watching television (including DVDs and movies) consumed more of children's leisure time than other identified recreational activities (Australian Bureau of Statistics, 2012), and so remains an important area to explore in relation to screen time.
Concerns about potential negative effects of excessive screen time have led to recommendations about placing limits on children's screen time. For example, the Australian Government, as part of its physical activity and sedentary behaviour guidelines for children aged 5-12 years (Department of Health, 2014) recommends that electronic media use for entertainment purposes be limited to a maximum of 2 hours per day. This recommendation was originally made for children in the United States (American Academy of Pediatrics, 2013). Acknowledging the changed technological environment in which children are now growing up, the American Academy of Pediatrics expects to publish revised guidelines in 2016. For Australia and the US (as well as other countries), current guidelines concerning screen time go beyond the 2-hour recommended limit; including suggesting parents limit access to screens in children's bedrooms, monitor how children are using screens, spend screen time together with their children and act as role models by also limiting their own screen time. In anticipation of publishing revised guidelines, a 2015 article by the American Academy of Pediatrics (2015) accentuated the importance of these broader approaches to managing children's screen time.
Much research has focused on the extent to which children adhere to the recommended 2-hour daily maximum of screen time, with it increasingly apparent that most children, across a number of countries, spend more time on screens than this (see Houghton et al., 2015; Melkevik, Torsheim, Iannotti, & Wold, 2010). For example, Houghton et al. (2015) reported that the proportion of 8-16 year olds exceeding 2 hours of screen-based activities (all forms, not just entertainment) per weekday, increased from 45% of 8 years olds up to 80% of 16 years olds. Hardy, Dobbins, Denney-Wilson, Okely, and Booth (2006), in a study of 11-15 year olds in selected schools in New South Wales, found that 53% of children in primary school and 72% of children in secondary school spent 2 or more hours per day on small-screen recreation (including television, computers, video and DVDs). In a sample of children aged 3-5 in Melbourne, Victoria (Hinkley, Salmon, Okely, Crawford, & Hesketh, 2012) children spent an average of 113 minutes per day on screen-based entertainment, including television viewing, computer/Internet and electronic games use during a typical week.
Children's screen time encompasses a broad range of activities, with mobile screen media, such as mobile phones and iPads, providing young people with access to an increased variety of activities throughout the day. This includes recreational activities such as watching television and playing games, as well as educational activities and social networking (Houghton et al., 2015; Straker, Smith, Hands, Olds, & Abbott, 2013). The guidelines for screen time noted above refer to screen time for entertainment reasons, but estimates of children's screen time often include these other activities. Clearly, it is important to go beyond aggregate measures of screen time to take account of such differences, especially when thinking about the possible implications of screen time for children's wellbeing (Straker et al., 2013). Time spent on different screen-based activities provides some indicator of children's potential exposure to risk and opportunities for their wellbeing, and we will focus on time in this chapter. Of course, there are other dimensions to this, such as the content of the program or game and the degree to which it actually involves physical activity or communication with others. We are not able to explore these aspects with LSAC.
Factors related to screen-based activities
In exploring differences in the amount of time children spend on screen-based activities a key focus has been on children's gender. Some studies have found that boys are more likely than girls to spend more than 2 hours daily on screen-based activities (Carlson & Berger, 2010; Hardy et al., 2006; Hesketh, Wake, Graham, & Waters, 2007), while others have found the opposite (Houghton et al., 2015). It is likely different findings reflect differences in how screen time is measured, given that gender differences are apparent for specific types of screen-based activities. Studies have found similar computer usage and computer access between boys and girls (see Marshall, Gorely, & Biddle, 2006), but significant differences in purpose and intensity between the two groups may exist. For example, in a study by Houghton et al. (2015), boys spent more time on screen-based activities for gaming than girls, while girls spent more time than boys on screen-based activities for social networking.
Age-related differences are also apparent, with older children spending more time than younger children on screen-time activities (Carlson & Berger, 2010; Houghton et al., 2015). Longitudinal studies also indicate that screen time tends to increase with age. Marshall et al. (2006), for example, reported that screen time increased from early childhood, peaking at about age 9-12 years, and decreasing in adolescence. In a study of 1,039 children aged 10-13 years in South Australia, Olds, Ridley, and Dollman (2006) reported that screen time increased at an overall rate of about 16 minutes per year of age. The overall age trends are not necessarily reflected in all screen-time activities. For example, Houghton et al. (2015) showed that spending more than 2 hours per day "gaming" declined with age while spending more than 2 hours per day on social networking peaked at grade 9, compared to younger ages.
Time use research shows that children of parents with higher levels of education spend less time watching television and more time reading (Bianchi & Robinson, 1997; Hofferth & Sandberg, 2001; Timmer, Eccles, & O'Brien, 1985), although when looking at other forms of screen time, parental education is not always a correlate. For example, Christakis, Ebel, Rivara, and Zimmerman (2004) found that children's time spent playing computer games did not vary with parental education, although they found higher education was associated with decreased hours of television and video viewing. Exploring parental education differences for specific types of screen time will be a focus of this chapter.
Accessibility of electronic media and family regulation also has an important influence on the amount of time children spend on screen-based activities (LeBlanc et al., 2015). Having more televisions in the household, a computer in the child's bedroom and not having rules for television watching or computer use are related to more time spent on related sedentary behaviours (Carlson & Berger, 2010; De Jong, Visscher, HiraSing, Heymans, Seidell, & Renders, 2013; Tandon, Zhou, Sallis, Cain, Frank, & Saelens, 2012). There is also considerable diversity across Australian families in the degree to which children have access to televisions, and in the different sets of rules and ways of enforcing these rules within the home (Bittman & Sipthorp, 2011). As these are modifiable factors for parents, it is not surprising that these are some of the factors targeted in recommendations for parents on ways to manage their children's screen time (American Academy of Pediatrics, 2015; Australian Government Department of Health, 2014).
We will be exploring these factors here, and looking at not only how much time children spend on screen-time activities (overall, and specific activities) but also the times of day that screen-time activities occur.
A key concern about screen-based activities is that they may displace time spent in activities that are more developmentally beneficial to children. In this chapter, we explore how screen time varies according to children's participation in extracurricular activities, such as team and individual sports, art and music lessons and involvement with community groups. Activities such as these are generally linked with positive outcomes for children (see discussion in Simoncini & Caltabiano, 2012).
Much of the concern about screen time is that the typically sedentary nature of this time may cause health problems such as obesity. There are numerous studies that have confirmed a relationship between the amount of screen time (or specific types of screen time) and poorer health outcomes among children (e.g., Caroli et al., 2004; Fairclough, Boddy, Hackett, & Stratton, 2009; Hancox & Poulton, 2005; Laurson et al., 2014). A possible explanation for the associations between screen time and poorer health outcomes is that spending time on screen-based activities detracts from children's time spent in active pursuits, but there is no strong evidence of this being the case, with some research finding that time spent on screen-based activities is not negatively correlated with time spent on active pastimes (De Jong et al., 2013; Melkevik et al., 2010).
In this chapter, we will consider how children's screen time varies according to children's self-reported health and their enjoyment of physical activities to provide new insights on the way in which screen time and health may be related. Self-report indicators such as these are associated with children's participation in physical activities outside of school (Mullan & Maguire, 2012).
Debate continues on the possible long-term effects of children's screen time on children's social and educational wellbeing. We will not be exploring this here, but LSAC will offer opportunities to analyse such associations as the children grow older.
Research questions
This chapter assesses LSAC children's time spent on different types of screen-based activities at home, including watching television, playing electronic games and using computers. This study includes analyses of parent reports, children's reports as well as children's time use information to explore this topic. The specific research questions examined in this chapter are:
- What are the patterns of screen time (watching television, using the computer and playing electronic games) among Australian children from the ages of 4-5 to 12-13 years?
- Does children's screen time vary according to the child's gender and parental education?
- To what extent is children's screen time associated with their participation in extracurricular activities at early adolescence?
- Does children's screen time relate to self-rated physical wellbeing and enjoyment of physical activities?
This chapter first introduces the data used (section 5.2). Then the overall patterns of screen time activities are described in section 5.3. This is followed by analyses of television viewing in section 5.4, and computer use and electronic games in section 5.5. Within these sections, the differences in children's time use according to the child's gender and parental education are examined. The relationship between children's screen time and their participation in extracurricular activities is explored in section 5.6. In section 5.7 associations between screen time and child-reported physical wellbeing and the level of enjoyment of physical activity are investigated. We conclude the chapter with a summary of the results and implications.
5.2 Data and measures
Information about children's screen-based activities has been collected at each wave of LSAC, and analysed here for the K cohort Waves 1 to 5, when children were aged 4-5 to 12-13 years old. Information presented here includes data gathered through parent reports and the children's time use diary (TUD) for three types of screen-based activities (television viewing, computer use and electronic games). The parent-reported data varied a little over the waves, as will be described in the analytical sections below. One of the unique features of LSAC is the children's time use data, as collected through time use diaries. In Waves 1 to 3, the parents reported children's time use and, in Waves 4 and 5, the children reported their time use. These approaches, and the resulting data, are described in Box 1. Using the children's time use data is especially valuable, as research has shown this methodology is able to produce valid and reliable estimates of time use (Juster & Stafford, 1985).
All children were in scope, and differences by child age were a key focus for the initial analyses of different types of screen-time activities. Within later sections, the focus of the analyses was on particular ages, to provide illustrations of some associations between screen time and other aspects of children's lives:
- For examination of the associations between screen time and participation in extracurricular activities we focus only on 12-13 year olds, using parent-reported survey data on their child's participation in extracurricular activities and child-reported TUD data on their screen time at Wave 5.
- For analyses of screen time and children's physical wellbeing and enjoyment of physical activities, we focus on data from Waves 4 and 5, when children were aged 10-11 and 12-13 years.
Details about the data analysed are described in full in those sections.
5.3 Overview of screen-time activities
Using the TUD data, television viewing, computer use and electronic gaming were combined to calculate the total screen time on the sampled day for Waves 1 to 5, as shown in Figure 5.1. On weekdays:
- children spent an average of 132 minutes (2.2 hours) on screen time activities on the sampled day at 4-5 years, 94 minutes (1.6 hours) at 6-7 years, 115 minutes (1.9 hours) at 8-9 years, 164 minutes (2.7 hours) at age 10-11 years and 196 minutes (3.3 hours) at 12-13 years;
- the percentage of children spending more than 2 hours on screen-based activities was 44% at 4-5 years. This proportion decreased to 25% at 6-7 years, then increased every 2 years after that, with 64% of children at age 12-13 spending more than 2 hours on screen-based activities on a weekday.
Figure 5.1: Children's total screen time on weekdays and weekend days, 4-5 to 12-13 years
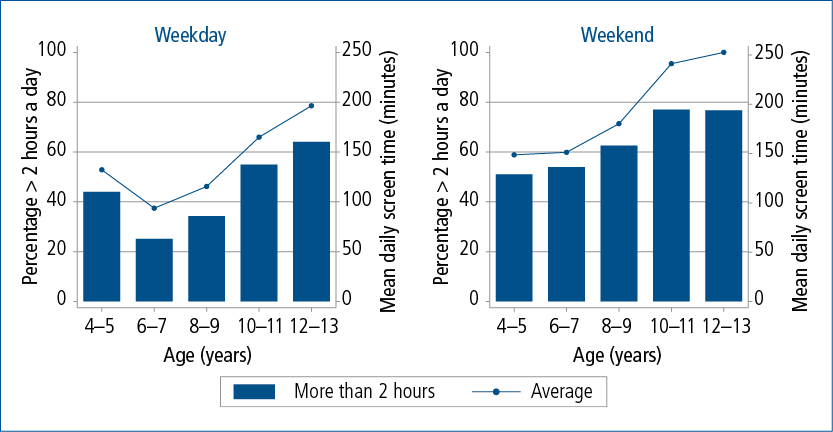
Note: See Table 5.1 and Table 5.2 for sample sizes.
Source: LSAC K cohort, TUD data Waves 1 to 5
Box 1: Children's time use data
In Waves 1 to 3 of LSAC, parents completed a time use diary (TUD) to provide information on the activities of the study child for two randomly assigned days, one weekday and one weekend day. The diaries divided the 24-hour day into 96 15-minute time intervals. Children's activities were recorded by indicating whether they were doing any one or more of 26 activities listed (e.g., sleeping/napping, eating and drinking, walking). Relevant to this chapter, the list of activities included:1
- "Watching TV, video, DVD, movie" (described as television viewing); and
- "Using computer/computer game" (we assume this includes electronic games played on devices other than computers, as no other codes specifically captured this information).
In Waves 4 and 5, the children themselves provided details of their activities over one day (either a weekday or a weekend day, nominated as the day before the home visit for the main LSAC interview). Children completed a time use diary by recording their main activities, in sequence, from "awake" time to when they went to sleep at night. The activity data were later re-coded into a detailed classification of main activities. This new data collection process supported a more detailed classification of activities than in previous waves and, as a result, there were more specific categories for screen-based activities available from these data, which have been analysed using the following broad categories:2
- television viewing ("Watching TV, video, DVD, movie", as in the earlier waves);
- computer use excluding games (see below for details); and
- electronic games (includes from Wave 4: "Xbox, Playstation, Nintendo, Wii, etc.", "Computer games - not Internet", "Computer games - Internet" and from Wave 5: "Electronic devices: playing games").
Together, the sum of these three activities has been analysed as total screen time, and the last two combined into a total of computer use/computer games for comparison to the Waves 1 to 3 data. From these data, computer use could also be disaggregated into more detailed categories, although changes in the detailed classification from Wave 4 to Wave 5 produced some small inconsistencies:
- homework (includes from Wave 4: "Computer for homework - Internet", "Computer for homework - no Internet" and from Wave 5: "Electronic devices: doing homework");
- social networking/online communication (Includes from Wave 4: "Texting, email, social networking, such as Facebook or Twitter", "Skype or webcam" and from Wave 5: "Spending time on social networking sites", "Video chatting (e.g., Skype)", "Texting/emailing", "Online chatting/instant messaging");
- downloading/creating website/application use (not available at Wave 4, from Wave 5 includes "Downloading/posting media (e.g., music, videos, applications)", "Creating/maintaining websites", "General application use (e.g., Microsoft excluding homework)");
- Internet browsing and shopping (includes from Wave 4 "Internet not covered elsewhere" and from Wave 5 "General Internet browsing (excluding homework)" and "Internet shopping"); and
- other (includes from Wave 4 "Electronic media, games, computer use" and from Wave 5 "Electronic device use NEC").
From Waves 1 to 3, there were usually two diaries per responding family. Analyses at Wave 1 are based on 3,497 weekday and 3,380 weekend diaries. At Wave 2, we use 3,222 weekday and 3,143 weekend diaries. At Wave 3, we use 2,797 weekday and 2,783 weekend diaries. For Waves 4 and 5 there was only one diary per family, and there were more weekday diaries than weekend diaries at these two waves: 3,178 weekday and 816 weekend diaries in Wave 4; and 2,906 weekday and 740 weekend diaries in Wave 5. A significant proportion of the weekday diaries were not school days for children, as they were often completed during school holidays.
While we will not explore this further in this chapter, it is worth noting that many of the weekday diaries actually referred to days on which children were not at school and, not surprisingly, if we focus only on weekdays when children were in school, their time on screen-time activities was lower than for all weekdays. Looking only at school-day diaries (e.g., excluding data collected during school holiday periods across the various states/territories), for children aged 6-7 years and over:
- At age 6-7 years children spent an average of 81 minutes (1.4 hours) on screen time activities on the sampled school day. This increased at 8-9 years to 94 minutes (1.6 hours), at age 10-11 years to 105 minutes (1.7 hours) and at 12-13 years to 129 minutes (2.2 hours).
Compared to weekdays, children spent longer on screen time activities on weekends:
- Children spent approximately 2.5 hours per weekend day, on average, doing screen-based activities at ages 4-5 and 6-7 (149-151 minutes). After this, the average weekend screen time increased with age, with children spending an average of 253 minutes (4.2 hours) per day on screen-based activities at age 12-13.
- On weekends, half of the children at age 4-5 spent more than 2 hours per weekend day on screen time activities. This proportion increased to 77% at 10-11 years and 12-13 years.
In later sections, we explore these data in more detail to report separately on children's time spent watching television, playing electronic games and using the computer. Television is by far the greater contributor to screen time at all ages. For example:
- at 4-5 years, the weekday total screen time (132 minutes) includes 119 minutes of television viewing; and
- at 12-13 years, the weekday total screen time (196 minutes) includes 116 minutes of television viewing.
The children's time use diaries provide a unique opportunity to examine how children's screen time is distributed throughout the day. This information provides insights on the peak times of screen-based activities, and sheds light on the degree to which children undertake these activities at times that they might otherwise be engaged in active pastimes or perhaps even sleep. Figure 5.2 shows, from 6 am to 12 am (midnight) on weekdays and weekends, the percentage of children who are at the time engaged in screen-based activities. The figure shows the percentage doing any screen-based activity, then separately shows the percentage watching television and the percentage using the computer (for any reason, including games). Data are shown for children at 4-5 years, 8-9 years and 12-13 years. Weekend and weekday patterns tend to differ, given that children are often in school on weekdays at ages 8-9 years and 12-13 years.
Figure 5.2: Children's screen-based activities over weekdays and weekend days, 4-5, 8-9 and 12-13 years
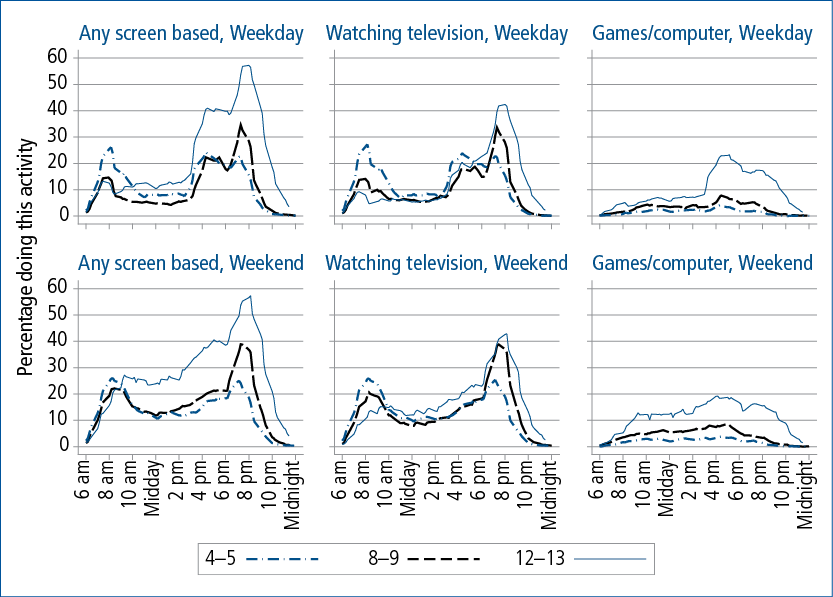
Note: The time use diary data were used to derive, for each 15-minute interval across the day, an indicator of whether or not children undertook this activity within that interval. This figure shows the percentage undertaking this activity within each 15-minute interval from 6am to midnight, for the ages of children indicated.
- The overall patterns on both weekdays and weekends are for screen-based activities to peak during the late afternoon, with a smaller peak for the younger children in the morning.
- Overall, at age 12-13 years, compared to younger ages, children more often engaged in screen-based activities during the daytime hours on weekend days or through the after-school hours and into the evening on weekdays. This largely reflects their being more likely to be engaged in games/computer activities, although in the evenings, the likelihood of children watching television to later times increased with age.
- The only time that the children at 12-13 years were less likely to engage in screen-based activities compared to when they were younger was in the morning. In particular, on weekday mornings, children were more often doing screen-based activities at 4-5 years than they were at older ages, due to a higher likelihood of watching television at this time.
The next two sections will focus specifically on children's time spent watching television and spent on electronic games and computers. Within each, we will draw upon these time use data, as well as parent-reported information about children's screen time.
5.4 Children's television viewing
As discussed above, a very large portion of children's screen time is spent watching television and this section explores that activity in more detail. We use data from the time use diaries as well as from parents' reports about children's television viewing on a typical weekday and weekend day. From Wave 2, parent-reported information has been captured in minutes per day, permitting averages to be calculated. In Wave 1, this information was collected in ranges so statistics comparable to later waves could not be incorporated here. The tables below include a range of statistics from these two different sources.
Overall findings
Information about television viewing on a weekday is shown in Table 5.1.
- From the time use diaries, it appears that after an average of two hours of television viewing at 4-5 years, children's average time spent watching television dips around 6-7 years, and increases but is still relatively low at 8-9 years. It then increases again at 10-11 and 12-13 years. The change from 4-5 years to 6-7 years likely reflects that at 6-7 years, and older, children's weekdays are more often taken up by school, perhaps limiting their time available for watching television (see also Figure 5.2).
- A majority of children watched television on the sampled weekday, with little variation over these ages, except that the proportion watching television is higher at 4-5 years than at older ages. Among children watching television, the duration spent doing this is also lowest at 6-7 years compared to the other ages.
- The parent-reported data yield somewhat different estimates of average time spent watching television at ages 6-7 and 8-9 years (resulting in higher estimates of television viewing time). For older children, however, the estimates are the same as given by the children. The trends in television viewing, by child age, follow a similar pattern to those seen with the time use data.
- The parent-reported data show that about one in five children watch more than 2 hours of television at 6-7 years and 8-9 years, with proportions higher at 10-11 and 12-13 years.
Notes: At Wave 1, television viewing was reported by parents in ranges. Overall, at this wave, on weekdays, 2% did not watch television, 15% watched for less than an hour, 64% watched for 1 up to 3 hours, 16% watched for 3 up to 5 hours and 4% watched for 5 hours or more. a While the mean times were virtually the same for parent-reported and time use data, the distribution was different within each, with a large number of parents reporting their children watched exactly 2 hours of television per day, which was not apparent in the time use data. This resulted in the two data sources producing very different proportions of children reported to watch more than 2 hours of television per day.
On average, children watched more television on a weekend day compared to a weekday. This is most apparent for age 6-7 years (see Table 5.2).
Note: At Wave 1, television viewing was reported by parents in ranges. Overall, at this wave, on weekend days, 5% did not watch television, 17% watched for less than an hour, 57% watched for 1 up to 3 hours, 18% watched for 3 up to 5 hours and 5% watched for 5 hours or more.
- According to the time use diaries, the average amount of time spent watching television on weekend days varied between 123 minutes (at 6-7 years) and 168 minutes (at 10-11 years), when all children were included in the estimates.
- The proportion of children watching television on a sampled weekend day remained quite steady at around 90% for ages 6-7 to ages 10-11, dropping slightly to 86% at 12-13 years.
- Estimates of time spent watching television on weekends, as reported by parents, were higher at all ages, but both parent reports and time use data showed significant proportions watching more than 2 hours of television on a weekend day, at less than 50% of children aged 4-5 years and 6-7 years, but more than 50% at older ages.
We will focus in later analyses on the proportion of children watching more than 2 hours of television per day since it aligns with recommendations about 2 hours of screen time. We largely use the parent-reported information about children's television viewing in later sections. However, given that this could not be derived from parent reports at 4-5 years, we have used the time use data to calculate this variable for children at this age.
Television and the home environment
Parents can influence their children's screen time by practices such as having rules about watching television (e.g., which television programs children are allowed to watch and how much time they can spend watching television) and also by controlling their physical environment (e.g., not allowing a television in the child's bedroom).
The physical home environment was measured in LSAC with the number of televisions in the household at Wave 1 as well as measures of ease of access to televisions and rules about watching television.
When children were 4-5 years old, very few families (less than 1%) had no television at home, 40% had one television, 42% had two and 18% had at least three in the home. This information was not updated at later waves. The number of televisions was clearly related to children's television viewing, as shown in Table 5.3. In particular, a larger proportion of children watched less than 1 hour of television in households with only one television compared to households with two or more televisions. The proportion of children who watched 3 or more hours of television increased with more televisions in the home.
Notes: Due to low numbers of children who lived in a household with no television at home (< 1 %), this group is not included in the analysis. Weekday: χ2 (4, n = 4,940) = 110.8, p < .001. Weekends: χ2 (4, n = 4,940) = 91.3, p < .001. Percentages may not exactly total 100.0% due to rounding.
Source: LSAC K cohort, survey data, Wave 1
Whether children had a television in their bedroom was collected at Waves 2 to 4, showing that at 6-7, 8-9 and 10-11 years, approximately one in four children had a television in their bedroom (Table 5.4). In Wave 5, the question was changed to ask whether the child had capacity to watch television programs or movies in his/her bedroom, so may include watching television programs or movies using other media devices such as a laptop. At age 12-13, almost half of the children could watch television in their bedroom.
Notes: a At 12-13 years, this indicates having a capacity to watch television or movies in the bedroom.
Source: LSAC K cohort, survey data, Waves 2 to 5
From Wave 2, parents also reported whether the family had rules about what television programs the child can watch and how long the child is allowed to watch television, although the study does not collect information about the precise rules that are in place. Across all these ages of children, the vast majority of families had rules about television programs and more than 50% had rules about how long children could watch television. At age 12-13 years, slightly fewer families had rules about television programs (90% at 10-11 vs 84% at 12-13 years) and more families had rules about how long the child could watch television as compared to 10-11 years (53% at 10-11 vs 58% at 12-13 years). This may reflect changes in the nature of parents' concerns; for example, being less concerned about restricting access to particular types of programs but being more concerned about how much time children spend watching television rather than on other activities such as schoolwork or exercise.
As Figure 5.3 demonstrates, at 6-7 years through to 12-13 years, children who had a television (or, at 12-13 years, the capacity to watch television) in their bedroom were significantly more likely to watch television for more than 2 hours per day than children who did not have a television in their bedroom.
Figure 5.3: Proportions of children watching television for more than 2 hours on weekdays and weekend days by television home environment, 6-7 to 12-13 years
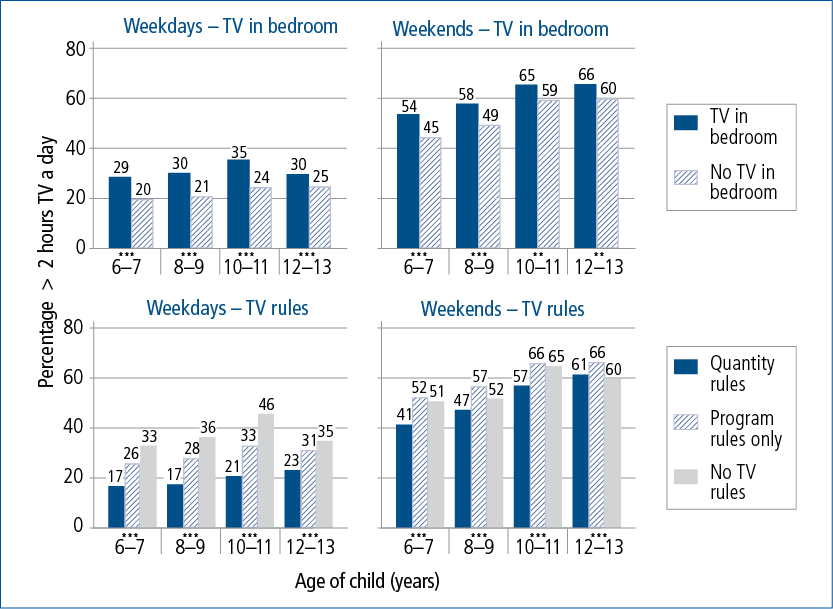
Note: At 12-13 years, "TV in bedroom" indicates having a capacity to watch television or movies in the bedroom. Wave 2 (6-7 years): n = 4,464; Wave 3 (8-9 years): n = 4,195; Wave 4 (10-11 years): n = 4,159; Wave 5 (12-13 years): n = 3,905. *** p < .001; ** p < .01; * p <. 05. Analyses were restricted to children who watched some television.
Source: LSAC K cohort, survey data, Waves 2 to 5
This figure also includes a comparison of the proportion of children watching more than 2 hours television per day according to the rules their family has about television viewing. Rules were grouped as those with rules about the amount of television they can watch (regardless of whether they have rules about the program content, since almost all have such rules), those with only rules about program content, and those with no rules at all. We excluded children watching no television from these analyses.
- On weekdays and weekend days, children in families with rules about the amount of television they can watch were the least likely to watch more than 2 hours of television per day (except at age 12-13 years, on weekends).
- On weekdays, children in families with no rules were most likely to spend more than 2 hours watching television.
- On weekend days, compared to children in families with no rules about television viewing, children in families who had rules about which television programs they can watch were actually more likely to spend more than 2 hours watching.
Child gender and television
Here we examine whether children's television viewing varies by child gender. The analyses focus on the percentage of children watching more than 2 hours of television per day. Figure 5.4 shows that the difference between boys and girls in the percentage watching more than 2 hours per day was not consistent across ages, for weekdays and weekend days.
Figure 5.4: Proportions watching more than 2 hours television on weekdays and weekend days by gender, 4-5 to 12-13 years
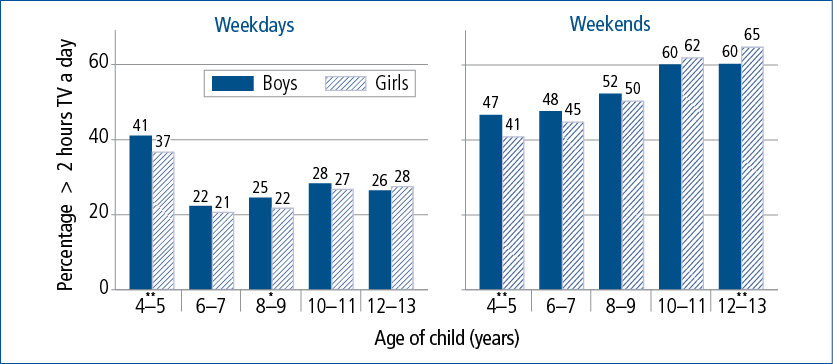
Notes: Wave 1 (4-5 years): n = 3,497 for weekdays and n = 3,380 for weekends; Wave 2 (6-7 years): n = 4,464; Wave 3 (8-9 years): n = 4,195; Wave 4 (10-11 years): n = 4,159; Wave 5 (12-13 years): n = 3,905. Statistically significances are noted: *** p < .001; ** p < .01; * p <. 05.
Source: LSAC K cohort, survey data, Waves 2 to 5 and time use diaries, Wave 1
- On weekdays, girls were significantly less likely to watch more than 2 hours of television than boys only at 4-5 years and 8-9 years.
- On weekend days, significant gender differences were apparent at 4-5 years and 12-13 years, with boys watching more television at 4-5 years but girls watching more television at 12-13 years.
Overall, these findings suggest that gender differences in television viewing at these ages of children are not particularly marked, at least as indicated by the percentage watching more than 2 hours of television per day. In a later section (see Table 5.8) we present details of screen time of 12-13 year olds, from the time use diaries, and those data also show no significant differences between boys and girls in the amount of time spent watching television.
Parental education and television
To examine differences by parental education, at each of the waves, information about the highest educational qualification of parents within the household was used. When there were two parents in the household, this was the highest qualification of these two parents, and when there was only one parent in the household (usually this was the mother), it was equal to the highest qualification of this parent. Qualifications were coded into a binary classification of "No bachelor degree" and "Bachelor degree or higher". As with the above analyses by child gender, these analyses focus on the percentage of children watching more than 2 hours television per day.
Figure 5.5 indicates that, within each age category, there are significant differences in children's time spent watching television by level of parental education. Across all age groups, a lesser proportion of children spent more than 2 hours per day watching television when their parent/s were more highly educated. The differences in the proportion of children spending more than 2 hours per day watching television were substantial on weekdays as well as weekend days.
Figure 5.5: Proportions of children watching television for more than 2 hours on weekdays and weekend days by parental education, 4-5 to 12-13 years
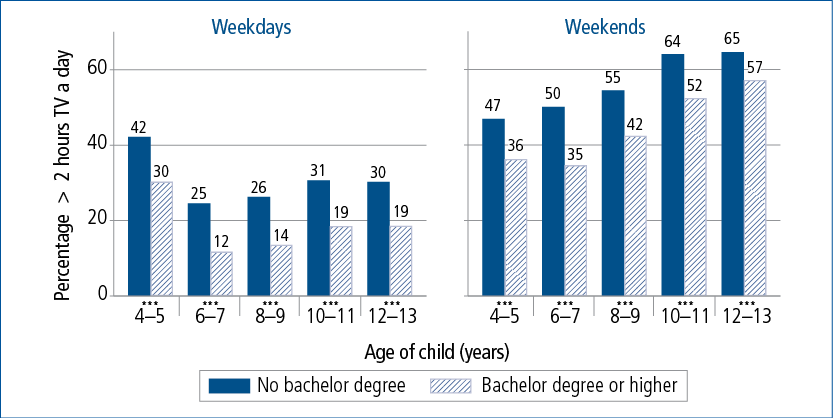
Notes: Parental education is the educational attainment of single parents or, in couple families, the highest qualification of the two parents in the household. Wave 1 (4-5 years): n = 3,497 for weekdays and n = 3,380 for weekends; Wave 2: n = 4,464; Wave 3: n = 4,195; Wave 4: n = 4,159; Wave 5: n = 3,905. *** p < .001; ** p < .01; * p < .05.
Source: LSAC K cohort, survey data, Waves 2 to 5 and time use diaries, Wave 1
The analyses of 12-13 year olds' screen time, from the time use diaries (see Table 5.8) revealed that on weekdays, children of higher educated parents watched less television, on average, but that on weekends, the average time spent watching television did not vary significantly by level of parental education.
Summary: Children's television viewing time.
In summary, we found that:
- Television viewing remains the screen-time activity that contributes most to children's total screen time compared to other screen-time activities.
- Children watched more television on weekends than on weekdays from ages 4-5 to 12-13.
- Children's television viewing on weekdays was high at age 4-5, decreased at age 6-7 and increased thereafter with age.
- The proportion of children watching television for more than 2 hours:
- was higher in households with a large number of televisions at home, a television in the child's bedroom or no rules limiting the amount of television that children can watch;
- did not vary significantly by gender, except for some small differences at particular ages; and
- was related to lower levels of parental education.
5.5 Children's electronic games and home computer use
This section focuses on children's time spent on electronic games and computers. At the older ages explored here, a majority of children have access to games and computers at home. This increased with age, which may be a factor of age itself, or related to trends in the availability (cost and popularity among children and families) of different devices.3 The trends by age showed:
- For electronic games, access at home increased from 56% at 6-7 years to 78% at 8-9 years, 92% at 10-11 years and 96% at age 12-13.
- For computers, access at home increased from 75% of children at 4-5 years to 87% at 6-7 years, 91% at 8-9 years and 95% at 10-11 years.
Estimates of the amount of time children spent on electronic games and on computers is presented here, drawing upon children's time use data (described in section 5.2) and parent-reported information about these activities. All children are included in the estimates below, including those who do not have electronic games or computer access at home. The time use data have initially been presented as the aggregate amount of time children spend on either games or computers, as this could not be disaggregated further at all ages. This is explored in more detail for older children later in this section. For the parent-reported data, we have separate information about children's time spent on a typical weekday and weekend day on electronic games and on computers. The question about electronic games was introduced in Wave 2 when the children were aged 6-7 years, and continued to Wave 5 when children were aged 12-13 years.4In collecting information about computer use in Waves 2 to 4, parents were asked about computer use at home, and were specifically told that these questions did not refer to devices such as handheld or TV plug-in computerised games (e.g., Playstation, Wii, Xbox, Nintendo DS, PSP). Parent-reported information about children's computer use will include children's time doing various activities on the computer, including playing games. New questions about computer use were introduced in Wave 5 but they have not been analysed in this chapter.
Overall findings
Children's time spent on games and computers on weekdays is presented first, in Table 5.5.
Notes: a Particpants' average total time is calculated only for those who participated in this activity.
Source: LSAC K cohort, TUD and survey data from Waves 1 to 5
- The proportion of children who played electronic games or used the computer increased with age - according to the time use data, the percentage spending some time on this activity increased from 24% up to 69% for the ages 4-5 years through to 12-13 years.
- The average time spent on this activity increased with age also, according to the time use data and the parent reports.
- The percentage spending one or more hours in total per weekday, on games or the computer, according to parent reports, was 25% at age 6-7 years, 36% at 8-9 years and 53% at 10-11 years.
- The percentages reporting spending one or more hours per day on these activities in the time use diaries were smaller, but likewise showed increases from 6-7 years up to 12--13 years.
- When disaggregated into "electronic games" and "computers", both types of screen time took up more of children's time as they grew. Of the two of these, children spent more time on computers, at least up until 10-11 years. From parent reports, this information is not available at 12-13 years. (See later analyses of time use data to explore this further.)
Not surprisingly, children spend more time on games and computers on weekend days, compared to weekdays (Table 5.6).
Notes: a Participants' average total time is calculated only for those who participated in this activity.
Source: LSAC K cohort, TUD and survey data from Waves 1 to 5
- Increases were also apparent by child age, as for weekdays.
- As with the weekday data, the time use estimates are somewhat lower than the parent-reported estimates. It is unclear whether differences are due to over-estimation of screen time by parents, or under-reporting of the screen time activities within the time use diaries.
The more detailed time use data collected at Waves 4 and 5 (for children at 10-11 and 12-13 years) allow us to examine the types of activities undertaken by children while they are using the computer. This information is particularly important - while there might be concerns about children's excessive time spent on screen time activities, certain aspects of using a computer or other media devices may actually be advantageous to the development (and application) of skills that are relevant to children's educational (and possible future labour market) outcomes (Bavelier, Green, & Dye, 2010; Durkin & Barber, 2002; Malamud & Pop-Eleches, 2010).
These data, along with the other screen time activity data, are presented in Table 5.7 for weekdays and weekend days. Note that time spent playing electronic/computer games reported here combines time spent on activities such as games consoles with time spent using the computer for games. The parent-reported information about children's time spent using the computer reported above does not disaggregate the activities done on the computer, so will include games as well as the types of activities explored with the time use data below.
Notes: Children who did not participate in a particular screen-based activity are included in the calculations, with a zero value for the time spent on that activity. Estimates include screen time as main or secondary activities. Most computer-based screen time was a main activity.
Source: LSAC K cohort, TUD data from Waves 4 and 5
- A significant contributor to children's screen time is the amount of time spent playing electronic/computer games, although much more time is spent watching television, at both ages and on weekdays and weekends. Children's time spent playing computer/electronic games does not vary much by age but is higher on weekends than weekdays.
- At 10-11 years, very little time was spent using the computer for reasons other than playing games, this averaging just 9-10 minutes per day across all children. More of this time was spent doing homework than other activities.
- At 12-13 years, children devoted more time to using the computer for reasons other than playing games. Compared to when they were 10-11 years, more time was spent doing homework (16-17 minutes, on average) and also on social networking and online communication (17 minutes, on average). Patterns of computer use for these activities were similar for weekends and weekdays.
In Figure 5.1 we presented estimates of the proportion spending more than 2 hours on screen time activities, by age. These estimates included all screen-based activities, while national guidelines actually refer to the time spent on screens for entertainment reasons. If we use this more detailed activity data, we can calculate estimates just for entertainment screen time activities (television or games) for children at 10-11 and 12-13 years.
- At 10-11 years, the proportion spending more than 2 hours on entertainment screen-time activities was 51% on weekdays and 75% on weekends - only marginally lower than the 55% and 78%, respectively, spending more than 2 hours on any screen activities.
- At 12-13 years, the proportion spending more than 2 hours on entertainment screen activities was 51% on weekdays and 68% on weekends, compared to 64% on weekdays and 77% on weekends on any screen-based activities for a total of more than 2 hours. The differences between these estimates were greater at this age, as children were more likely to be using computers for homework and for social networking, which were not included in summing total entertainment time on screens.
Child gender and time spent on games and computers
Here we explore how children's time spent on games and computers varies by child gender. Figure 5.6 shows, for girls and boys on weekdays and weekends, the percentage spending one hour or more on games and the percentage spending one hour or more per day using the computer.
Figure 5.6: Proportions spending one hour or more on games and on computers on weekdays and weekend days by gender, 4-5 to 12-13 years
Note: Wave 1: n = 4,982; Wave 2: n = 4,464; Wave 3: n = 4,195; Wave 4: n = 4,159; Wave 5: n = 3,905. Chi-square tests were used to test for differences. Significant differences are noted: *** p < .001; ** p < .01; * p < .05.
Source: LSAC K cohort, survey data from Wave 1-5
Boys were significantly more likely than girls to have spent at least an hour per day on electronic games within each age category. These differences were quite marked, with the increased likelihood of spending at least one hour on electronic games at older ages (as shown in Tables 5.5 and 5.6) apparent for girls as well as boys.
Gender differences in time spent using the computer were much smaller. At 6-7 and 8-9 years, the proportion of boys who used a computer for more than one hour per day on weekdays was significantly higher than that for girls, although the percentages only differed by a few percentage points. Significant differences were not apparent for weekdays at 4-5 years and 10-11 years. On weekend days, the only significant gender difference was observed at age 6-7, again with more boys using computers for 1 hour or more (36%) than girls (31%).
While the analysis above showed little difference between boys and girls in the proportion spending one hour or more using the computer each day, previous research suggests that gender differences may be more apparent if exploring the nature of activities undertaken with the computer (Houghton et al., 2015). We explore this using the time use data for 12-13 year olds, since children at younger ages spend little time using the computer for reasons other than playing games (Table 5.7). Table 5.8 includes children's time spent watching television and total screen time, but below we focus on the findings as it relates to specific computer activities.
- On weekdays and weekends boys spent much more time playing computer/electronic games compared to girls. This is consistent with the parent-reported information about electronic game use presented above but combines electronic game use with games played on computers.
- Overall, these data show girls spending more time than boys using the computer for reasons other than games. This was true on weekdays and weekends.
- On weekdays, girls spent more time using the computer for homework compared to boys, and more time using the computer for social networking and online communication.
- Girls spent a little less time than boys on "other" activities, which includes downloading/creating websites/using computer applications, Internet shopping and browsing and other unspecified activities.
- The gendered differences in time spent using the computer were also apparent on weekend days, but this difference was not statistically significant in regard to the "other" activities.
Notes: Children who did not participate in a particular screen-based activity are included in the calculations, with a zero value for the time spent on that activity. Differences in duration were tested with a regression that included only an indicator for child gender. ***p < .001; ** p < .01; * p <. 05.
Source: LSAC K cohort, TUD, Wave 5
We can also explore gender differences further, by looking at the proportion of girls and boys doing these activities by time of day. Figure 5.7 presents, for boys and girls, for the weekday after-school hours (from 3pm onwards), the proportion spending time doing computer/electronic games, the proportion using the computer for homework and the proportion using the computer for other reasons (including social networking and online communication as well as other activities).
Figure 5.7: Details of screen-based activities over the day, 12-13 year olds on weekdays
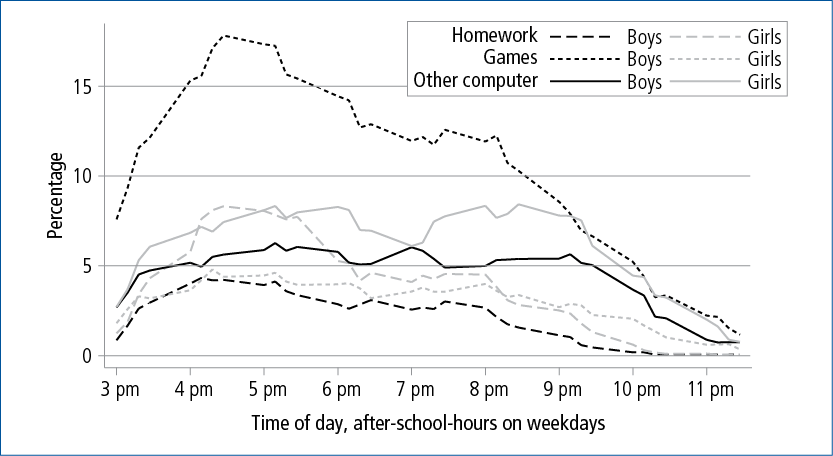
Notes: The time use diary data were used to derive, for each 15-minute interval across the day, an indicator of whether or not children undertook specified activities within that interval. This figure shows the percentage of boys and girls undertaking these activities within each 15-minute interval from 3pm to midnight.
Source: LSAC K cohort, TUD data at Wave 5
The gender differences in playing electronic games is the most obvious aspect of these data with boys being more likely than girls to be playing games through to the evening hours. The peak time for 12-13 year old boys to be playing games was between 4 pm and 5 pm, when about 15-18% of boys were doing this. In comparison, fewer than 5% of girls were playing electronic games at this time. About 5% of boys were still playing electronic games at 10pm.
Gender differences are also apparent for doing homework on the computer, although the differences are less marked than for playing games. Consistent with overall averages, girls were more likely to be using the computer for homework in the afternoon, especially in the hours shortly after school. For example, within each 15-minute period between about 4.15 pm and 5.45 pm, about 8% of girls were doing homework on the computer, compared to about 4% of boys. This was the peak time for doing homework with the computer.
For other computer-based activities, the patterns are less apparent by time of day and gender, except for the decline in this activity (and other computer-based activities) as the day progressed.
Parental education and time spent on games and computers
We explore here how children's games/computer use varies with level of parental education.
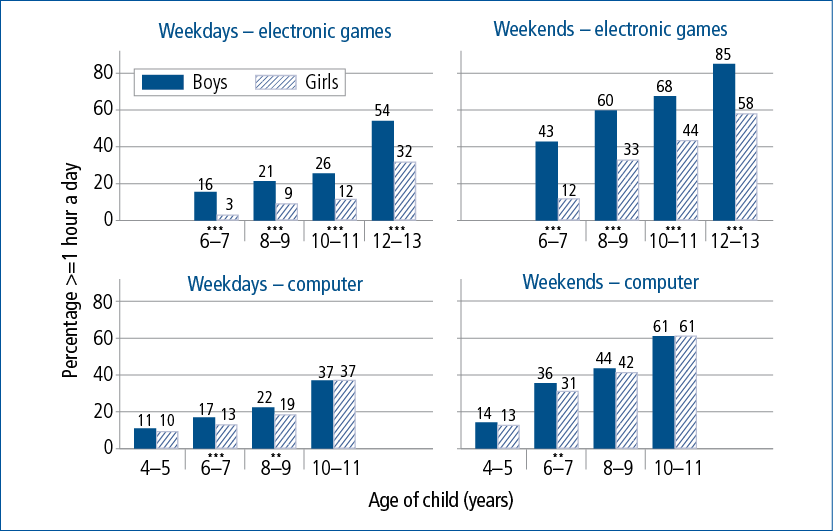
As seen in Figure 5.8, parental education was negatively related to the amount of time children spent playing electronic games. For weekdays, compared to children whose parents did not have tertiary-level qualifications, children of more highly educated parents were consistently less likely to spend 1 hour or more on this activity from 6-7 years through to 12-13 years. For weekends, findings were similar, although not statistically significant at 12-13 years.
Figure 5.8: Proportions spending one hour or more on computers and on games on weekdays and weekend days by parental education, 4-5 to 10-11 years
Note: Wave 1: n = 4,982; Wave 2: n = 4,464; Wave 3: n = 4,195; Wave 4: n = 4,159.Chi-square tests were used to test for differences. Significant differences are noted: *** p < .001; ** p < .01; * p < .05.
Source: LSAC K cohort, survey data, Waves 1-4
Figure 5.8 shows that the proportion of children spending 1 hour or more using the computer on weekdays varied little according to parents' educational level, although there was a statistically significant difference at 6-7 years. At this age, children whose parents did not have a bachelor degree or higher were most likely to spend 1 hour or more using a computer. On weekends, for children at 4-5 years, 6-7 years and 8-9 years, compared to children whose parents did not have a bachelor degree, children of more highly educated parents were more likely to spend 1 hour or more using a computer. A statistically significant difference was not observed at age 10-11.
Differences by parental education are also explored below looking at specific activities from the time use data for children age 12-13 years. Table 5.9 shows:
- None of the measures of weekend screen time varied significantly by parental education. Analyses of weekend time use are based on smaller sample sizes, which may contribute to differences found to be non-significant.
- At this age the amount of time children spent playing games on the computer or other electronic devices was not significantly different by parental education. Also, the overall amount of weekday time children spent on the computer for reasons other than games did not vary by parental education.
- Differences according to parental education were significant for the amount of weekday time spent using the computer for homework, with average time spent on this being higher when parents were more highly educated.
- Some differences in time spent social networking/online communication were apparent, with higher amounts of weekday time spent on this, on average, by children with parents whose educational attainment was lower than a bachelor degree.
Notes: Children who did not participate in a particular screen-based activity are included in the calculations, with a zero value for the time spent on that activity. Differences in duration were tested with a regression that included only an indicator for the education variable. *** p < .001; ** p < .01; * p <. 05.
Source: LSAC K cohort, TUD, Wave 5
Summary of findings about children's time playing games and using computers
This analysis of children's computer and game use showed that:
- Children's computer or game time increased from ages 4-5 to 12-13 years. This increase may partly reflect the greater availability of different devices across these years, but increased use of computers for homework highlights the changing nature of screen time as children grow.
- Children spent more time on computer use and electronic games on weekends than on weekdays at all ages.
- Gender differences were not generally apparent when comparing the proportion of children spending an hour or more using the computer. When we looked at how children used the computer for reasons other than games, some small gendered differences emerged; for example, with girls spending more time using computers for homework compared to boys.
- Gender differences were quite marked in exploring children's time spent playing electronic games, including playing games on the computer. Boys tended to spend more time on this activity than girls. This was especially apparent on weekdays in the hours after school.
- Looking at differences by parental education there were only small differences in respect to children's use of the computer, although on weekdays differences in use of the computer to do homework were apparent, with children of more highly educated parents spending more time on this.
5.6 Screen time and extracurricular activities
A concern about children spending excessive amounts of time on screen-based activities is that these activities may substitute for other activities that may be more beneficial to children's wellbeing. Here we explore associations between children's participation in extracurricular activities and screen time, for boys and girls at ages 12-13 years. Children's extracurricular activities include physical activities such as team and individual sports, as well as art and music classes and community activities. Participation in activities such as these is generally linked to more positive outcomes for children (Simoncini & Caltabiano, 2012).
Previous research leads us to expect that children who are engaged in extracurricular activities may spend less time on screen-based activities. For example, Carlson and Berger (2010) showed that children in more organised out-of-school physical activity sessions per week were less likely to exceed 2 hours of screen time. In this section, we examine how children's time spent on screen-based activities (from the children's time use diaries) varies according to their participation in extracurricular activities, as reported by parents. This is only descriptive analysis, so does not take into account that participation in extracurricular activities is more likely for certain children (e.g., those who enjoy particular activities) and children from certain types of families (e.g., higher socio-economic families) (Covay & Carbonaro, 2010; Mullan & Maguire, 2012).
In Wave 5, when children were aged 12-13 years, parents were asked whether their child had, in the previous week, participated in a range of extracurricular activities. We explore the following:
- community group or club (e.g., scouts, guides or cultural group) (10% of boys and girls participated);
- team sport (e.g., football, cricket or netball) (52% of boys and 42% of girls participated);
- individual sport (e.g., swimming, tennis, karate or gymnastics) (27% of boys and 26% of girls participated); and
- art, music, dance, performance lessons (e.g., piano, dance, choir or drama) (25% of boys and 43% of girls).
Parents were asked about other extracurricular activities that we have not included here (e.g., academic lessons and religious activities), but we focus on just the above to provide some initial insights on the associations with children's screen time. Our analyses only include those children who completed a weekday diary. While we do not know whether or not the extracurricular activities occurred on weekends, the focus on only weekday diaries allows easier interpretation of the findings. Findings are presented in Table 5.10.
Notes: Children who did not participate in a particular screen-based activity are included in the calculations, with a zero value for the time spent on that activity. *** p < .001; ** p < .01; * p < .05; ns = not significant.
Source: LSAC K cohort, survey and TUD data, Wave 5
For both boys and girls, the proportion of children exceeding 2 hours of cumulative screen time on the sampled weekday was significantly lower among those who participated in a team sport or an art/music activity. For girls, it was also lower for those who participated in an individual sport. This proportion did not vary significantly for girls' or boys' participation in a community group. The average screen time was lower among those children who participated in each of the extracurricular activities, except it was not statistically significant for boys according to their involvement in community groups.
Statistically significant differences by extracurricular participation were generally apparent for total time screen time and for time spent watching television, but for other screen-based activities, the differences were not as marked.
- The average time viewing television was lower among those children who participated in community groups (only significant for girls), team sports (only significant for boys), individual sports and art or music activities.
- For boys, the average amount of time spent on computer use excluding games did not vary significantly according to whether children participated in any of the extracurricular activities. For girls, the average time spent on computer use excluding games was significantly lower among those who participated in individual sports.
- Time spent playing electronic/computer games did not vary significantly according to children's participation in community groups or art/music activities. Boys spent significantly less time playing games if they participated in team sports or individual sports, and girls spent less time playing games if they participated in individual sports.
To fully understand the mechanisms that underlie these associations we would need to understand more about how children's time is allocated to different activities. It may be that screen time is a default activity for many children who do not have other organised activities. However, family characteristics as well as children's own interests and parents' views about appropriate patterns of time use no doubt contribute to their engagement in different types of extracurricular activities and their time use at home.
5.7 Children's screen time, enjoyment of physical activities and physical wellbeing
A key area of research concerning children's screen time has been in relation to the implications for children's physical wellbeing, given concerns about the typically sedentary nature of such activities, and rising concern about childhood obesity. In this section, we examine how children's screen time varies according to their enjoyment of physical activity and their own assessments of their physical wellbeing. We have focused on these self-reported measures because measures such as these have elsewhere been associated with children's participation in physical activities (Mullan & Maguire, 2012; Sallis, Prochaska, & Taylor, 2000).
The children's time use data are again used, focusing on those who spent more than 2 hours on the sampled day on screen-time activities. These data are related to child reports at Waves 4 and 5 (10-11 and 12-13 years) on one item about enjoyment of physical activities and two about physical wellbeing. These items are described below.
Children's enjoyment of physical activities was captured with the question, "How much do you enjoy being physically active (doing things like sports, active games, walking or running, swimming)?" on a 4-point scale ("A lot", "Quite a lot", "Not very much" or "Not at all"). The last two categories were combined as very few answered "Not at all".
- Among boys at 10-11 years, 69% enjoyed physical activities a lot, 24% quite a lot and 6% not much/at all. At 12-13 years the percentages were 59% liked physical activities a lot, 32% quite a lot and 8% not much/at all.
- Among girls at 10-11 years, 59% enjoyed physical activities a lot, 33% quite a lot and 7% not much/at all. At 12-13 years the percentages were 54% liked physical activities a lot, 34% quite a lot and 12% not much/at all.
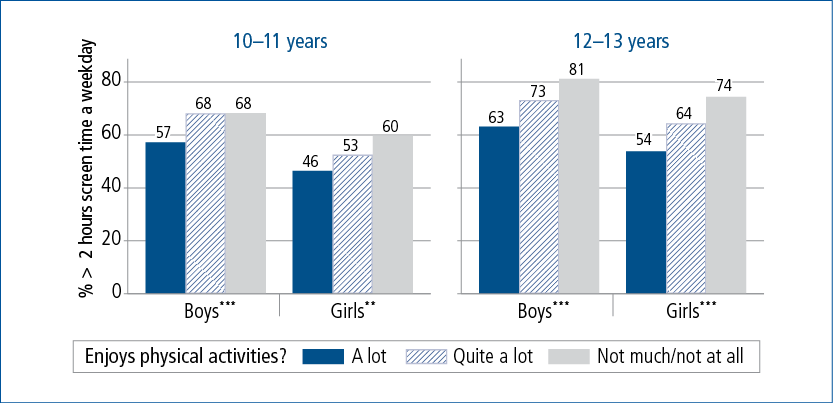
Figure 5.9 shows some significant differences in the percentage spending more than 2 hours on screen-based activities, according to enjoyment of physical activities.
- At 10-11 years, boys who enjoyed physical activity "a lot" were significantly less likely to exceed 2 hours of weekday screen time (57%), compared to boys who enjoyed physical activity "quite a lot" or "not much/at all"(68%).
- For boys at 12-13 years, and girls at both ages, there was a clearer relationship between screen time and enjoyment of physical activities, as those who enjoyed physical activity more were the least likely to spend more than 2 hours on screen-time activities, and those who enjoyed it the least, the most likely to spend more than 2 hours per weekday on screen-time activities.
Figure 5.9: Proportion of children spending > 2 hours screen time per weekday by enjoyment of physical activities of boys and girls, 10-11 and 12-13 years
Notes: Wave 4: boys (n = 2,026), girls (n = 1,952). Wave 5: boys (n = 1,801), girls (n = 1,936). *** p < .001; ** p < .01; * p <. 05.
Source: LSAC K cohort, survey and TUD, Waves 4 and 5
To assess relationships between screen time and children's perceptions of their physical wellbeing, we use information collected in Wave 4 from children's responses to two questions.
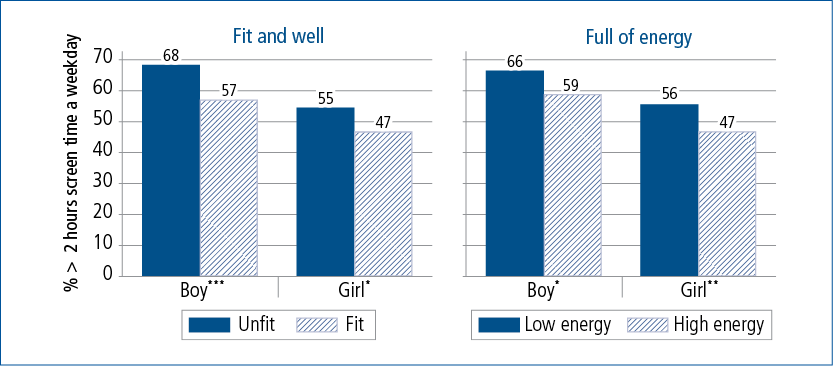
- One question asked, "Have you felt fit and well over the last week?" Responses were grouped into categories "Fit" (including those who responded "extremely" or "very" to this question) and "Unfit" (including those who responded "not at all", "slightly" or "moderately"). Overall, 68% of boys and 67% of girls were classified as "Fit".
- The other question asked, "Have you felt full of energy over the last week?" Responses were classified as "High" (including those who responded "extremely" or "very") and "Low" (including those who responded "not at all", "slightly", "moderately"). Overall, 77% of boys and 70% of girls were classified as "High" energy.
Figure 5.10 shows that:
- Boys and girls who were classified as "Fit" were significantly less likely to spend more than 2 hours in screen time activities on the sampled weekday, compared to those classified as "Unfit". The differences were a little more marked for boys than for girls.
- Compared to children classified as "Low" energy, boys and girls classified as "High" energy were significantly less likely to exceed 2 hours per day of screen time.
Figure 5.10: Proportion of children spending > 2 hours total screen times per day by physical wellbeing of boys and girls, 10-11 years
Notes: Boys (n = 2,026), girls (n = 1,952). *** p < .001; ** p < .01; * p <. 05.
Source: LSAC K cohort, Wave 4 survey and TUD data
The findings here indicate that children's time spent on screen-based activities does vary according to children's assessments of their enjoyment of physical activities and their sense of physical wellbeing. What drives these associations is clearly important. One possible explanation for this result is that children who have a higher preference for physical activities and feel fit and well have a lower preference for screen-based activities. Another possible explanation is that more of their time may be allocated to physical activities, leaving less time for screen-based activities. These associations may also reflect that children who spend more time doing sedentary, screen-based activities feel less energetic and less fit. There may be other considerations also, such as children having a health limitation or medical condition that might mean they are less likely to enjoy physical activity and more likely to spend more time on screen-based activities. Further analyses of these data would be needed to better understand these associations.
5.8 Summary and discussion
Overview of children's screen time
This chapter described Australian children's screen time as they moved from early childhood to the late primary school years. A majority of Australian children at all ages spent some time on screen-based activities, when captured to include any television viewing, computer use and electronic gaming.
These data were collected from Wave 1 (in 2004) to Wave 5 (in 2012) of the Longitudinal Study of Australian Children. We note that even over this period of data collection there was significant change in the availability of technology. These changes may mean we have not captured all of children's screen-based activities, especially those undertaken through the more portable and accessible media devices such as smartphones and tablets that have become more accessible in recent years. How and where children spend time on these new media (e.g., home, school, transport) will be an important direction for future research.
Throughout this chapter we referred to findings derived from children's time use diaries and to findings from parents' reports about children's screen time. On the whole, the trends and patterns that emerged from these different data sources were consistent. However, in places we saw that the estimated time spent on screen-time activities differed considerably from these different sources. This was especially the case for estimates of children's time spent playing electronic games or using the computer on weekends, for which estimates were considerably higher according to parents' reports. Further analyses of these data may be needed to understand whether estimates based on parent reports of screen time on a typical day are over-estimates, or from time use diaries under-estimates, of the true measure of children's time use. In the parent-reported data, we were unable from these data to ascertain what a "typical" day meant to parents, and whether this likely reflected daily exposure to screen time over a week, or only over selected days of the week. Further, as these analyses only drew upon the reports of parents in the LSAC primary household, we have not taken into account whether screen time behaviours differ when children are spending time in another household, most notably, when they are staying with a parent living elsewhere.
Australian children's screen time increased from ages 4-5 to 12-13 years. On average, by 12-13 years, children spent 3 hours per weekday and almost 4 hours per weekend day using screens, which equates to around 20% of their waking time on weekdays and 30% on weekends. The increase in screen time as children grew may be partly due to the rapid development of technology in the past decade, along with the growing availability of portable and affordable media devices. It is also likely to reflect children's needs and desires for exploration and acquisition of new knowledge and skill as they grow older. Throughout this chapter we compared children's total screen time to the recommended limit of no more than 2 hours per day screen time for entertainment. Consistent with other Australian and international studies, the analyses of LSAC presented here showed that children very often exceed the recommended amount of screen time (see Houghton et al., 2015; Melkevik et al., 2010).
Television viewing was the most common screen-based activity, with most children watching some television on weekdays and weekend days. Spending time using a computer was less common but increased with age. For some children, computer use was for playing games, perhaps supplementing playing games on other electronic devices. Also, and increasingly at 12-13 years, the computer was used for activities such as homework and social networking.
Children's screen time differed according to their gender. Consistent with other studies, we found boys spent more time than girls playing electronic games on both weekdays and weekends. This was especially apparent during the after school hours on weekdays.
Some differences in children's screen time were found according to parents' education levels with higher levels of parental education associated with less time watching television and more time using computers for homework. According to parents' reports of children's time spent on electronic games, the likelihood of spending one hour or more on this activity was negatively related to parental education. These educational differences may reflect inherent differences in children's own preferences for types of activities (e.g., reading), or they may reflect differences in parental regulation, investment in extracurricular activities and attitudes towards screen time.
The home environment and children's screen time
An important focus of the Australian (and US) guidelines about children's screen time is the advice to parents about providing an environment that minimises children's screen time and encourages greater parental participation in the screen time that occurs. One suggestion in the Australian guidelines is to make children's bedrooms a television/computer-free zone. In the current sample, a quarter of children at 6-7 through to 10-11 years had televisions in their bedrooms, and almost half of children at age 12-13 years were able to watch television programs in their bedroom. Another suggestion concerned setting rules; for example, to have no screen time at certain times of day. With regard to television viewing, a majority of children (84-91%) at all ages had rules about what television programs they could watch, while 50-60% had rules about how much television they could watch. Clearly, it is also important to understand to what extent children had rules about other forms of screen time, but we did not explore this here. Consistent with previous studies (De Jong et al., 2013; Veldhuis, van Grieken, Renders, HiraSing, & Raat, 2014), we generally found that children watched less television if they did not have a television in their bedroom or when families had rules about television viewing. However, our results suggested that as children get older, rules may be less effective, with nearly half of the 12-13 year olds who had rules about television viewing exceeding 2 hours of television on weekends. This highlights the importance of developing effective and age-appropriate strategies to reduce children's time spent on screen-based activities.
Alternative activities and screen time
The analysis presented here showed that engaging in certain extracurricular activities is associated with lower volumes of screen-time use at 12-13 years. However, from these analyses we cannot say whether children participating in extracurricular activities have different preferences about how they spend their time, are more constrained in the time they have available for screen time activities or have different patterns of time use due to other family characteristics (or vice versa). Nevertheless, increased availability of and child participation in extracurricular activities may be one strategy that could help reduce children's allocation of time to screen time activities, especially if screen time activities are largely done to fill in time that is not taken up by more structured activities.
Children's self-reported enjoyment of physical activity and physical wellbeing were also related to their screen-based behaviours, although the descriptive analyses likewise cannot be used to explain the mechanisms underlying this relationship. While these analyses do not provide evidence of a causal relationship, it may be that if children are provided with opportunities to engage in physical activities that they enjoy, that promote their feelings of wellbeing and fitness, a consequence may be that they will engage in these activities and reduce their screen time.
Implications of these findings
Time spent by children in front of screens has been found to be a significant factor in explaining differences in children's health problems such as obesity (Caroli et al., 2004; Fairclough et al., 2009; Hancox & Poulton, 2005; Hardy, Dobbins, Denney-Wilson, Okely, & Booth, 2009; Laurson et al., 2014). Therefore, guidelines concerning limits on the amount of time children spend using screens for entertainment are important. However, as children's access to screens through television, computers and mobile devices becomes more ubiquitous, it may be expected that achieving a maximum of 2 hours of screen time for entertainment will become more and more unrealistic, and certainly, more difficult for parents to manage. It will be interesting to see whether these guidelines are revised as screen time becomes more a part of everyday life, for children as well as adults.
Guidelines about screen time currently state a proposed limit on children's screen time for entertainment reasons. Of course, children are also exposed to screens more and more through school and outside school, for social reasons and homework. To the extent that these activities also are limiting children's time spent on active pastimes, consideration of this screen time may need to be taken into account.
Despite concerns about children's screen time, it is important to acknowledge that there are positive aspects to this time. Digital technology is an essential part of children's lives in today's world and the effective use of computing technology is key to unlocking new professions and prosperity for the future. As results presented here suggest, children are using computers for schoolwork, gathering information and socialising with others. Such screen-based activities have value in that they enable children to develop digital skills and progress towards becoming expert users (Bavelier et al., 2010).
As has been identified in relation to television programming, understanding the implications of screen time for children's wellbeing needs to take account of content and context, not just the amount of exposure (Bavelier et al., 2010). Here we have explored this to some extent, by reporting on the different types of screen-based activities undertaken by children. Nevertheless, we were unable to explore the content of television or of games, and did not explore whether parents or others were involved in these screen-based activities with children. Aspects such as these are among those identified as being important for parents to consider when managing their children's screen time to ensure children use screens in a safe and beneficial manner. Expanding research to gain greater insights on these aspects of children's screen time will be important in the future, especially considering that screens are only likely to become more prevalent as vehicles of children's entertainment, schooling and communication.
Children are clearly spending a large amount of time on screen time activities, with a majority of children spending more than 2 hours per day on these activities. Regardless of there being questions about whether or not the recommended 2 hour limit on screen time for entertainment is realistic, it is still important that children's screen time is managed to ensure that time involves quality engagement with television, computers or games, and to ensure that children do not undertake these activities to the detriment of other activities that may be essential for their wellbeing. Finding effective mechanisms to inform and assist parents to manage children's screen time is needed, especially in the current environment in which screens are integral to many facets of children's and adults' lives.
5.9 References
American Academy of Pediatrics. (2013). Children, adolescents, and the media. Pediatrics, 132(5), 958-961.
American Academy of Pediatrics. (2015). Beyond 'turn if off': How to advise families on media use (1098-4275). Elk Grove Village, IL: AAP.
Australian Bureau of Statistics. (2012). Children's participation in cultural and leisure activities, Australia, April 2012 (4901.0). Canberra: ABS.
Australian Bureau of Statistics. (2014). Household Use of Information Technology, Australia, 2012-13 (8146.0). Canberra: ABS.
Bavelier, D., Green, C. S., & Dye, M. W. (2010). Children, wired: For better and for worse. Neuron, 67(5), 692-701.
Bianchi, S. M., & Robinson, J. (1997). What did you do today? Children's use of time, family composition, and the acquisition of social capital. Journal of Marriage and Family, 59(2), 332-344.
Bittman, M., & Sipthorp, M. (2011). Turned on, tuned in or dropped out?: Young children's use of television and transmission of social advantage. In Australian Institute of Family Studies (Eds.), LSAC Annual Statistical Report 2011, (pp. 43-54). Melbourne: Australian Institute of Family Studies.
Carlson, M. J., & Berger, L. M. (2010). What kids get from parents: Packages of parental involvement across complex family forms. (Unpublished working paper.) Madison, WI: University of Wisconsin-Madison.
Caroli, M., Argentieri, L., Cardone, M., & Masi, A. (2004). Role of television in childhood obesity prevention. International Journal of Obesity, 28, S104-S108.
Christakis, D. A., Ebel, B. E., Rivara, F. P., & Zimmerman, F. J. (2004). Television, video, and computer game usage in children under 11 years of age. The Journal of pediatrics, 145(5), 652-656.
Covay, E., & Carbonaro, W. (2010). After the bell participation in extracurricular activities, classroom behavior, and academic achievement. Sociology of Education, 83(1), 20-45.
De Jong, E., Visscher, T., HiraSing, R., Heymans, M., Seidell, J., & Renders, C. (2013). Association between TV viewing, computer use and overweight, determinants and competing activities of screen time in 4- to 13-year-old children. International Journal of Obesity, 37(1), 47-53.
Department of Health. (2014). Make your move - Sit less - Be active for life! Canberra: Commonwealth of Australia.
Durkin, K., & Barber, B. (2002). Not so doomed: Computer game play and positive adolescent development. Journal of applied developmental psychology, 23(4), 373-392.
Fairclough, S. J., Boddy, L. M., Hackett, A. F., & Stratton, G. (2009). Associations between children's socioeconomic status, weight status, and sex, with screen-based sedentary behaviours and sport participation. International Journal of Pediatric Obesity, 4(4), 299-305.
Hancox, R., & Poulton, R. (2005). Watching television is associated with childhood obesity: But is it clinically important? International Journal of Obesity, 30(1), 171-175.
Hardy, L. L., Dobbins, T. A., Denney-Wilson, E. A., Okely, A. D., & Booth, M. L. (2006). Descriptive epidemiology of small screen recreation among Australian adolescents. Journal of Paediatrics and Child Health, 42(11), 709-714.
Hardy, L. L., Dobbins, T. A., Denney-Wilson, E. A., Okely, A. D., & Booth, M. L. (2009). Sedentariness, small-screen recreation, and fitness in youth. American Journal of Preventive Medicine, 36(2), 120-125.
Hesketh, K., Wake, M., Graham, M., & Waters, E. (2007). Stability of television viewing and electronic game/computer use in a prospective cohort study of Australian children: Relationship with body mass index. International Journal of Behavioral Nutrition and Physical Activity, 4(1), 60.
Hinkley, T., Salmon, J., Okely, A. D., Crawford, D., & Hesketh, K. (2012). Preschoolers' physical activity, screen time, and compliance with recommendations. Medicine and Science in Sports and Exercise, 44(3), 458-465.
Hofferth, S. L., & Sandberg, J. F. (2001). How American children spend their time. Journal of Marriage and Family, 63(2), 295-308.
Houghton, S., Hunter, S. C., Rosenberg, M., Wood, L., Zadow, C., Martin, K., & Shilton, T. (2015). Virtually impossible: Limiting Australian children and adolescents daily screen based media use. BMC Public Health, 15(1), 5.
Juster, F. T., & Stafford, F. P. (1985). Time, goods, and well-being. Ann Arbor, Michigan: Survey Research Center, Institute for Social Research University of Michigan.
Laurson, K. R., Lee, J. A., Gentile, D. A., Walsh, D. A., & Eisenmann, J. C. (2014). Concurrent associations between physical activity, screen time, and sleep duration with childhood obesity. International Scholarly Research Notices, 2014.
LeBlanc, A. G., Katzmarzyk, P. T., Barreira, T. V., Broyles, S. T., Chaput, J.-P., Church, T. S. et al. (2015). Correlates of total sedentary time and screen time in 9-11 year-old children around the world: The International Study of Childhood Obesity, Lifestyle and the Environment. PloS One, 10(6), 1-20.
Malamud, O., & Pop-Eleches, C. (2010). Home computer use and the development of human capital (NBER Working paper 15814). Cambridge, MA: National Bureau of Economic Research.
Marshall, S. J., Gorely, T., & Biddle, S. J. (2006). A descriptive epidemiology of screen-based media use in youth: A review and critique. Journal of adolescence, 29(3), 333-349.
Melkevik, O., Torsheim, T., Iannotti, R. J., & Wold, B. (2010). Is spending time in screen-based sedentary behaviors associated with less physical activity: A cross national investigation. International Journal of Behavioral Nutrition and Physical Activity, 7(46), 1-10.
Mullan, K., & Maguire, B. (2012). How engaged are children in organised and unorganised physical activity during their late primary school years. In Australian Institute of Family Studies (Eds.), The Longitudinal Study of Australian Children Annual Statistical Report 2011. Melbourne: AIFS.
Olds, T., Ridley, K., & Dollman, J. (2006). Screenieboppers and extreme screenies: The place of screen time in the time budgets of 10-13 year old Australian children. Australian and New Zealand Journal of Public Health, 30(2), 137-142.
Sallis, J. F., Prochaska, J. J., & Taylor, W. C. (2000). A review of correlates of physical activity of children and adolescents. Medicine and Science in Sports and Exercise, 32(5), 963-975.
Simoncini, K., & Caltabiano, N. (2012). Young school-aged children's behaviour and their participation in extra-curricular activities. Australasian Journal of Early Childhood, 37, 35-42.
Straker, L., Smith, A., Hands, B., Olds, T., & Abbott, R. (2013). Screen-based media use clusters are related to other activity behaviours and health indicators in adolescents. BMC Public Health, 13(1), 1174.
Tandon, P. S., Zhou, C., Sallis, J. F., Cain, K. L., Frank, L. D., & Saelens, B. E. (2012). Home environment relationships with children's physical activity, sedentary time, and screen time by socioeconomic status. International Journal of Behavioral Nutrition and Physical Activity, 9, 88.
Timmer, S., Eccles, J., & O'Brien, K. (1985). How children use time. In F. T. Juster & F. P. Stafford (Eds.), Time, goods, and well-being (pp. 353-382). Ann Arbor, Michigan: Survey Research Center, Institute for Social Research University of Michigan.
Veldhuis, L., van Grieken, A., Renders, C. M., HiraSing, R. A., & Raat, H. (2014). Parenting style, the home environment, and screen time of 5-year-old children: The 'Be active, eat right'study. PloS One, 9(2), e88486.
1 This chapter includes analyses of the amount of time, per day, children were said to have spent on these activities. For these calculations, it was assumed that the child spent the entire 15-minute period on any activity they were reported to do.
2 Activities were described in words, and start and end times of each activity recorded. Children identified their main activities as well as what else they were doing at the time (that is, secondary activities). Interviewers went through the diaries with children to check the quality of data collected, and classified main and secondary activities. We have included main and secondary activities in the derivations shown here, unless otherwise stated. The days on which the diaries were completed in Waves 4 and 5 were spread relatively evenly across the weekdays. The weekend diaries more often referred to Sundays than Saturdays, with only 4% of all diaries at Waves 4 and 5 being for a Saturday. When children are in school, their main activity is generally listed as "school", so we do not tend to capture any screen-based activities during school time.
3 For example, some evidence of this is that the B cohort of LSAC, when aged 6-7 years and 8-9 years, were much more likely to have electronic game access at these ages compared to the K cohort at the same ages. At 6-7 years, 56% of the K cohort and 81% of the B cohort had access to electronic games; at 8-9 years the percentages were 78% for the K cohort and 95% for the B cohort.
4 In Waves 2 and 3, this question included "such as Nintendo, Gameboy or Playstation?" and in Wave 4, this included "such as Playstation, Wii, Xbox, Nintendo DS, PSP". These activities were popular and available at the time of data collection. In Wave 1, a question about electronic games was not asked, and use of computers was collected in ranges, and so does not allow for average time to be computed.
Share


