4. Demographic, attitudinal and psychosocial factors associated with childhood immunisation
4. Demographic, attitudinal and psychosocial factors associated with childhood immunisation
4.1 Introduction
In June 2014 over 90% of Australian children were fully immunised at the milestone ages of 12, 24 and 60 months (Hull, 2015). These excellent levels of coverage must be improved and maintained over time. To achieve this, it is important to identify which potentially modifiable factors are related to incomplete immunisation. This chapter uses LSAC data linked to the Australian Childhood Immunisation Register to examine the demographic, psychosocial and attitudinal factors related to incomplete immunisation at 12, 24 and 60 months. For historical context, Box 4.1 provides an overview of major immunisation policy initiatives in Australia in the last 20 years.
The Australian Childhood Immunisation Register (ACIR) was established on 1 January 1996. It is the first purpose-built immunisation register established in the world. The ACIR holds identification and immunisation details for all children up to 7 years of age who are enrolled in Medicare, which is 99% of children by 12 months of age.1 The National Centre for Immunisation Research and Surveillance of Vaccine Preventable Diseases (NCIRS) has used the ACIR to report on rates of immunisation in the population; for example, through the Immunisation Coverage Annual Reports (Hull, Dey, Menzies, Brotherton, & McIntyre, 2012; Hull et al., 2011; Hull, Mahajan, Dey, Menzies, & McIntyre, 2010).
Since December 2007, coverage has been reported for children at three milestone ages: 12 months, 24 months and 60 months. The 2012 annual report showed rates of complete immunisation above 90% at these ages in most states and territories (Hull et al., 2012). Rates of complete immunisation have been historically lower for Aboriginal and Torres Strait Islander children (Hull et al., 2010, 2011), but coverage for standard vaccines at 24 and 60 months has improved in recent years and is now comparable to coverage for non-Indigenous children. Coverage for Indigenous children at 12 months remains lower than coverage for non-Indigenous children (Hull et al., 2012; Naidu et al., 2013). Homel and Edwards (2016) provide an overview of national immunisation coverage for the period 2000-09, which is when the children in LSAC were receiving childhood vaccinations.2
To better understand incomplete immunisation, Australian researchers have linked ACIR data to other databases that provide information about the children on the register, as well as their families and communities. Using linked postcode data, Hull, McIntyre, and Sayer (2001) found that high proportions of people born overseas and single parents were associated with lower coverage of DTPa (diphtheria, tetanus and pertussis) and MMR (measles, mumps, rubella) at 12 and 24 months in all areas. In metropolitan postcodes, lower coverage was associated with high levels of education and occupation and a high proportion of Indigenous residents. In rural postcodes, high unemployment was associated with lower rates of coverage. However, across all postcodes the strongest correlate of low coverage was a high proportion of children in the postcode who had not received immunisation by 3 months of age.
In another example, Haynes and Stone (2004) linked ACIR data for children born in 1998 at the individual level with perinatal and birth defect databases for the state of Victoria. Incomplete immunisation at 12 and 24 months was associated with mothers having had more births, 12-23 months spacing between pregnancy, being divorced or separated or a single parent, mothers being under 25 years of age at birth, mothers being Indigenous or born overseas, living in the most advantaged or most disadvantaged socio-economic areas compared to the middle socio-economic areas, having no private health insurance, having had a home birth, a metropolitan place of birth and children with low birth weight (for immunisation at 12 months only).
These Australian findings accord with the international literature on demographic and social factors associated with childhood immunisation rates (Brown et al., 2010; Pearce, Law, Elliman, Cole, Bedord, & the Millenium Cohort Study Child Health Group, 2008). A systematic review of this literature highlighted low socio-economic status, lack of health insurance, low parental education, younger maternal age, large family size, being in a minority ethnic group and negative attitudes towards immunisation as factors frequently associated with incomplete immunisation (Falagas & Zarkadoulia, 2008).
Fewer studies have examined whether correlates of non-immunisation differ from correlates of partial immunisation. However, the existing evidence suggests that families of children who are non-immunised are generally more affluent than families of children who are fully immunised. Families of children who are partially immunised, on the other hand, are more disadvantaged than families of children who are fully immunised. For instance, a large US study reported that children who were not immunised at all (compared to those who were fully immunised) had parents who were more likely to have safety concerns about vaccines, not trust doctors, were white, married, had a university degree, had high household income and had a child who was male (Smith, Chu, & Barker, 2004). Children who were partially immunised (compared to those who were fully immunised) were more likely to have parents who were black, not married, had no university degree, lived near the poverty level, and lived in a central city. Analysis from the UK Millenium Cohort study also suggests a different profile for the two groups (Samad et al., 2006). Compared to children who were fully immunised at 12 months, children who were non-immunised were more likely to have mothers who were university educated, older and were of black Caribbean ethnicity, while children who were partially immunised were more likely to be living in disadvantaged areas, had larger families, had parents who were lone or teenage parents, had mothers who smoked during pregnancy, and were more likely to have been admitted to hospital by 9 months. If these findings are replicated in Australia, they suggest that policy responses and information campaigns need to be different for these two groups.
Using the linked data from the ACIR to the LSAC sample, this chapter will explore patterns and predictors of full, partial and non-immunisation at the milestone ages of 12, 24 and 60 months. The rich data from LSAC can be used to provide a demographic profile of children who were not fully immunised at these milestone ages, and also enable us to explore the importance of possible barriers to immunisation such as remoteness. In addition, we examine the role of psychosocial factors such as maternal depression, stress and parenting. Mothers who experience depressive symptoms and high levels of stress may have difficulties in accessing preventive health measures for their child (Kavanaugh, Halterman, Montes, Epstein, Hightower, & Weitzman, 2006) but these factors have not been considered in previous studies of immunisation. Parents' understanding of whether their child is up to date with their immunisations will also be cross-referenced with immunisations in the ACIR to gauge whether parental understanding was consistent with the vaccination schedule at the time of data collection.
Notably, LSAC collected information about parental attitudes to childhood immunisation. Parent disagreement with immunisation has been identified in a number of studies as a robust predictor of incomplete immunisation (Falagas & Zarkadoulia, 2008), but the association between parent disagreement and partial immunisation has not been examined. In Australia, 1.6% of children born in 2010 had parents who lodged an official conscientious objection to immunisation. A further 2% had no vaccines recorded on the ACIR. To our knowledge, this is the first nationally representative study with linked data to compare the importance of attitudes with the importance of demographic and psychosocial factors in predicting both partial and non-immunisation.
Research questions
This chapter addresses the following research questions:
- What are the rates of full, partial and non-immunisation in the LSAC children?
- How persistent is incomplete immunisation between 12 and 60 months?
- How accurate is parents' understanding of whether children are up to date with the immunisation schedule?
- What demographic, psychosocial and attitudinal factors are associated with full, partial and non-immunisation?
- What are the most important correlates of partial immunisation and non-immunisation?
Box 4.1: Historical context: Summary of policies to increase childhood immunisation in Australia since 19963
Timeline of major policy responses
1996 ACIR notification payment for general practices introduced.
1997 First National Immunisation Program (NIP) introduced with a Seven Point Plan to increase immunisation coverage nationally.
1998 Parental incentives introduced (the Maternity Immunisation Allowance (MIA) and Child Care Assistance Rebate and Child Care Cash Rebate) and school-entry requirements. Provider incentives introduced from July 1 - the General Practice Immunisation Incentive Scheme (GPII)
2000 Child care assistance and cash rebates replaced by Child Care Rebate.
2008 Service Incentive Payment (SIP) component of GPII discontinued.
2012 1 July: MIA discontinued. Family Tax Benefit (FTB) Part A supplement tied to immunisation, medical exemption or conscientious objection. Outcomes Bonus payment component of the GPII discontinued.
2013 New National Immunisation Strategy for 2013-2018 published.
2016 From 1 January, the vaccine conscientious objection no longer considered an exemption category for immunisation, meaning that families with children who do not meet the immunisation requirements and do not have a medical exemption will not receive the Child Care Benefit, Child Care Rebate, or the FTB Part A end-of-year supplement.
Accompanying this change is funding over 4 years to increase national immunisation rates
(see Immunise Australia, 21 April 2015). Activities under this initiative will:
- provide additional incentives to immunisation providers to identify children who are delayed for immunisation and perform catch-up vaccinations;
- provide a range of tools to assist providers in having conversations with vaccine-hesitant parents; and
- initiate public awareness campaigns about the importance of immunisation.
Details of selected policy responses
Surveys in the 1980s revealed substantial disparities across states and territories in funding and access to vaccines, with some estimates suggesting only about 53% of children were fully immunised. This gave rise to the first National Immunisation Strategy in 1993, followed by the establishment of the ACIR in 1996. In 1997, the Immunise Australia program was introduced
(also known as the National Immunisation Program, or NIP). The Immunise Australia Program outlined a Seven Point Plan to improve immunisation coverage across the nation. The seven initiatives were: (1) incentives for parents, including the MIA and immunisation requirements for childcare payments; (2) establishment of incentives for GPs, under the GPII; (3) monitoring and evaluation of immunisation targets using ACIR; (4) immunisation days targeted at areas of low coverage; (5) initiatives aimed at measles eradication; (6) education and research, including information campaigns to the public and service providers; and the establishment of the National Centre for Immunisation Research and Surveillance (NCIRS); and (7) school entry requirements. We outline a few of these here.
Incentives for parents were designed to prompt parents to complete immunisations,
or to register their medical exemptions or conscientious objection to immunisation.
The MIA: The MIA was a one-off, non-taxable payment that could be claimed on or before a child's 5th birthday if the child was shown to have completed the immunisation schedule, or the parent was a registered conscientious objector, or the child had a medical exemption (Chin, Crawford, Rowles, & Buttery, 2012). Originally it was means-tested but this was removed in July 2004. In 2008 the payment was $236 (Department of Social Services, 2015a). From 2009 the MIA was paid in two instalments. In July 2012 the MIA was discontinued and, instead, eligibility for the Family Tax Benefit (FTB) Part A supplement was linked to immunisation. To be eligible for the payment, children need to be fully immunised, or have an approved medical or conscientious exemption, during the financial years that each child turns 1, 2 and 5 years old (Department of Human Services, 2015).
Child care payments: From April 1998, families applying for the Child Care Assistance and Child Care Cash Rebate were required to demonstrate that their child's immunisation coverage was
up to date for their age, or that they had an approved medical or conscientious objection. From July 2000, these payments were replaced by the Child Care Benefit (CCB) and Child Care Rebate (CCR). To receive CCB and CCR, all children under 7 must meet immunisation requirements, or have approved exemptions.
Until the end of 2015, parents who registered a conscientious objection by talking to a doctor and completing the appropriate form were considered to have met immunisation requirements and could receive the payments. The incentives were designed to encourage, rather than coerce, parents to promptly immunise their children. From January 2016, however, vaccine objectors are not considered to have met immunisation requirements (Department of Social Services, 2015b).
Incentives for providers: there have been a number of incentives for providers since 1996. The ACIR notification payment (or Information Payment) of up to $6 is paid to all providers after notification that all NIP vaccines for a milestone age have been administered for a child (Hull et al., 2012).
From 1998, the GPII was designed to encourage providers to report immunisation to ACIR, and to achieve increasingly high targets of proportions of children under 7 years in their practices immunised. The GPII included several payments. The Service Incentive Payment (SIP) of $18.50 was paid to the provider upon notification to ACIR that an immunisation schedule had been completed for a child at key milestone ages. The Outcomes Bonus payment of $3.50 per whole-patient equivalent was paid quarterly to general practices that achieved an immunisation level of 70% or better, with this percentage increased progressively to 90%. The SIP was discontinued in 2008 and the Outcomes Bonus payment ceased in July 2012 (Chin et al, 2012; Hull et al., 2012).
From 1 July 2016, providers will be paid an incentive of $6 for identifying children in their practice who are more than 2 months overdue, and calling them in for catch-up vaccines. The payment can be made for each childhood schedule caught-up, potentially up to $36 for the full schedule. This is on top of the existing $6 payment.
School entry requirements were worked out with states and territories. Parents must provide an immunisation status certificate, which can be obtained from ACIR. Children not immunised or children of conscientious objectors can attend but may be excluded from school if an outbreak of a vaccine-preventable disease occurs.
4.2 Data and method
Linked data from the Australian Childhood Immunisation Register
We examined immunisation in 4,779 B-cohort children using linked data from the Australian Childhood Immunisation Register (ACIR). Of the 5,107 children in the B cohort, 328 (6.4%) were not included because parents either did not give consent for their children's data to be linked with Medicare data, or because incomplete consent forms meant data could not be linked (see the LSAC Data User Guide, Australian Institute of Family Studies, 2013).
The B cohort was selected to be representative of the population of Australian children born between March 2003 and February 2004. In the analyses we use population weights so that estimates reflect rates of immunisation in this larger population of Australian children. However, some very remote postcodes were not included in the sample design, and temporary residents were not included (Soloff, Lawrence & Johnstone, 2005). In addition, the 328 children who could not be linked to ACIR mean that our estimates of this population are around 230,000. The representativeness of the LSAC-ACIR linked data is discussed in Homel and Edwards (2016). Homel and Edwards concluded that the LSAC linked sample slightly over-represents completely immunised children.
Defining immunisation status at 12, 24 and 60 months
Immunisation status was defined according to criteria developed by the ACIR and initially reported in O'Brien, Sam, and Mead (1998). In this study we use the ACIR data matched to LSAC participants to assess full immunisation, partial immunisation and non-immunisation at three milestone ages: 12 months, 24 months and 60 months (5 years old). To be fully immunised at each of these ages a child should have completed all the required types and doses of vaccinations listed in the Australian Standard Vaccination Schedule. The relevant schedules for the B cohort are in the Australian Immunisation Handbook, 7th edition (2000) and 8th edition (2003), and in quarterly and annual coverage reports using ACIR data for the period, by the National Centre for Immunisation Research and Surveillance (NCIRS) (Hull et al., 2010).
Table 4.1 summarises the types and number of doses of vaccines the B-cohort children should have received by each age. To make it clear how immunisation status is defined at each age, we emphasise the following points:
1. The ages at which vaccines are due according to the schedule are much earlier than the milestone age at which they are assessed. Specifically:
- All the vaccines that are required to be fully immunised at 12 months are due by 6 months.
- All the vaccines that are required to be fully immunised at 24 months are due by 12 months.
- All the vaccines that are required to be fully immunised at 60 months are due by 48 months
(i.e., 4 years old).
Therefore, the milestone ages are either 6 or 12 months later than the age at which vaccines are due according to the schedule. This means that even children who are several months delayed in receiving scheduled vaccinations have usually received them by the milestone age.
2. A child was considered to have received a scheduled vaccine if the final dose was recorded on or before his or her birthday at the relevant milestone age. For example, there are three doses of DTPa due at 2, 4 and 6 months. A child born on 1 April 2003 was considered to have received the DTPa vaccine for the 12-month milestone age if the third dose was recorded in the ACIR on or before 1 April 2004. This assumes that the first and second doses have also been received, and this assumption has been shown to be valid (Hull & McIntyre, 2000; Hull, Lawrence, MacIntyre, & McIntyre, 2003).
3. Children were defined as fully immunised at 12, 24 or 60 months if they had received all the required doses outlined in Table 4.1. For example, a fully-immunised child at 12 months had received the third doses of DTPa and IPV, and the second or third doses of Hib and HepB. Children were defined as partially immunised if they had received some doses but not others. For instance, a 12 month old who had received the third dose of DTPa but no other vaccines was defined as partially immunised at 12 months. Children were defined as non-immunised at each age if they had not received any doses.
4. Immunisation status at each milestone age is independent from other ages. This means that each milestone is assessed as its own event, without taking into account the status of the child at the previous milestone. For example, as long as a K-cohort child has received the doses that are assessed at 72 months (see Table 4.1), she is fully immunised even if she was not fully immunised at 24 months.
Note: * The number of doses required for Hib and HepB varied by the type of vaccine used and by state or territory.
Source: Chin, et al. (2012); National Health and Medical Research Council (2000, 2003); O'Brien et al. (1998)
Using LSAC variables as predictors of immunisation status at milestone ages
We used information from the Wave 1 LSAC interview to examine demographic and psychosocial factors associated with immunisation at 12 and 24 months, and information from Wave 2 to examine factors associated with immunisation at 60 months. Therefore, at 24 and 60 months the demographic and psychosocial factors preceded the ages at which immunisation occurred. At 12 months, these factors were assessed around the time that vaccines were received.
4.3 Results
How many children are fully, partially and non-immunised?
Table 4.2 shows the percentage and number of children born between March 2003 and February 2004 who were fully, partially or non-immunised at 12, 24 and 60 months. Because LSAC is a nationally representative sample of children born between March 2003 and February 2004, the estimates reflect rates of immunisation in the broader population of Australian children in this birth cohort. At 12 and 24 months, over 90% of children were fully immunised, but this dropped to just over 80% by 60 months. These rates are 1-2 percentage points higher at 12 and 24 months than the national estimates published by the NCIRS for the period, but consistent with the national estimates at 60 months (NCIRS, 2007; 2010).
Although only a small percentage of children were partially or non-immunised at 12 and 24 months, these nonetheless represent about 15,000 and 11,000 children respectively. By the 60-month milestone, the number of children who had not received the scheduled final vaccinations (4th doses of polio and DTPa and a 2nd dose of MMR) increased to about 42,000.
Notes: Total observations in sample = 4,779. Total n in population = 226,872. CI = confidence interval.
How persistent is incomplete immunisation over time?
About 79% of children (n = 180,000) were fully immunised at each age, and about 2% (n = 4,273) of children were not immunised at any age. This shows that although full immunisation was the norm, there was quite a large group who fluctuated between complete and incomplete immunisation before the age of 5. Table 4.3 shows how immunisation status changed from 12 to 24 months, and Table 4.4 shows how immunisation status changed from 24 to 60 months.
Between 12 and 24 months, most children remained fully immunised or became fully immunised. Of children who were fully immunised at 12 months, 99% remained fully immunised at 24 months. Further, two-thirds of children who were partially immunised at 12 months were fully immunised at 24 months, suggesting that there is "catch-up" over this period. In contrast, non-immunisation was quite stable, with 89% of non-immunised 12 month olds still non-immunised at 24 months. This was also true between 24 and 60 months (Table 4.4).
Maintenance of full immunisation was much less consistent from 24 to 60 months. Although most children who were fully immunised at 24 months were also fully immunised at 60 months, about 16% were partially immunised. This means that although these children had received all the required doses for the 24-month milestone, they had not received the final doses of DTPa, IPV and MMR due by 48 months and assessed at 60 months (see Table 4.1). Some incomplete immunisation at 60 months in this cohort may be due to the fact that the milestone assessment age changed from 72 months to 60 months from January 2008. Although all the children in this study reached the milestone after this change, it may have taken some parents and providers time to adjust to the change as coverage increased into 2009. However, this change does not make results for the current sample unrepresentative of the population. About 40% of the children who were partially immunised at 24 months were fully immunised at 60 months, but the remainder were still partially immunised at 60 months.
How accurate is parents' understanding of whether children are up to date with the immunisation schedule?
In the first wave of the LSAC survey, the parent who knew the child best (Parent 1, usually the child's mother) was asked:
Is [your child] up to date with his/her immunisations, that is needles or injections?
In response, the parent could answer:
(1) Yes, completely up to date, (2) No, but has had most, (3) No, but has had some, or (4) No, hasn't had any.
Most parents (91%) said their child was completely up to date, 7% said the child had had most immunisations, 1% said their child had had some immunisations, and 2% said their child had received no immunisations.
We examined how this parental knowledge was related to actual immunisation status at Wave 1. We used a subsample of 2,636 children (55.2% of the B cohort) who were aged between 7 months and 11 months at the time of the parent interview. This was because all of the vaccines assessed at 12 months (outlined in Table 4.1) are actually due to be administered at 2, 4 and 6 months. Children who were 7 months or older at the time of the Wave 1 interview would have had the opportunity to have received the 2, 4 and 6 month vaccines before the question was asked. Children younger than 11 months would also not yet be due for the 12-month doses (see Table 4.1), avoiding problems interpreting what parents mean when asked whether their child is up to date.
Figure 4.1: Immunisation status at Wave 1 for children aged 7-10 months old by level of parental knowledge about completeness of child's immunisation
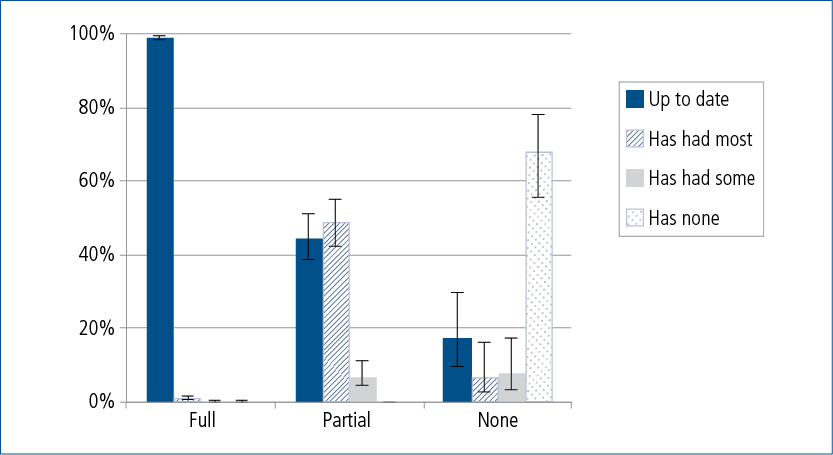
Figure 4.1 shows the cross-tabulation of parental knowledge and immunisation status at Wave 1. The bars show the percentage of children within each immunisation status whose parents said they were up to date, had most immunisations, had some immunisations, or had no immunisations. It is clear that parents of fully immunised children were most accurate about their child's immunisation status, parents of partially immunised children were least accurate, and parents of non-immunised children were moderately accurate.
Of all fully immunised children, 99% of parents correctly said their child was up to date. However, 44% of parents of partially immunised children also said their child was completely up to date with immunisations - representing about 6,160 children aged 7 to 10 months. Of children who were not immunised, 18% of parents said their child was up to date, about 730 children. A further 15% said their child had had most or some immunisations. The majority, 68%, said accurately that their child had received no immunisations.
Overall, 5% of parents (equating to a poopulation estimate of just under 7,000 children aged 7 to 10 months) reported that their child was fully immunised when he or she was not fully immunised. Most of these children were partially immunised. These patterns suggest that parents of partially immunised children, in particular, may be unaware that their child is not up to date with the immunisation schedule.
What demographic, psychosocial and attitudinal factors are associated with full, partial and non-immunisation?
In this section we describe the results of analyses, examining how a wide range of demographic, psychosocial and attitudinal variables were associated with full, partial and non-immunisation at 12, 24 and 60 months.
Variables in the models
The demographic and psychosocial variablesincluded in our models are described in Table 4.5. Many of the demographic variables were selected because they have been linked to incomplete immunisation in past studies in Australia, the US and the UK (Bond, Nolan, & Lester, 1999; Brenner, Simons-Morton, Bhaskar, Das, Clemens, & NIH-D.C. Initiative Immunization Working Group, 2001; Brown et al., 2010; Falagas & Zarkadoulia, 2008; Hanna, Wakefield, Doolan, & Messner, 1994; Haynes & Stone, 2004; Luman, Mason, Shefer, & Chu, 2003; Pearce et al., 2008; Samad et al., 2006; Smith et al., 2004). We also considered whether immunisation status was related to whether a family received the Child Care Benefit, because meeting immunisation requirements is an eligibility criterion for receiving this benefit. In addition to these demographic and household factors, we examined a range of psychosocial variables assessing maternal depressive symptoms, stress and parenting.
Notes: * These variables were considered fixed demographic factors and were used in all analyses.
** These variables were assessed at Wave 1 only and were not included in the model predicting immunisation status at 60 months.
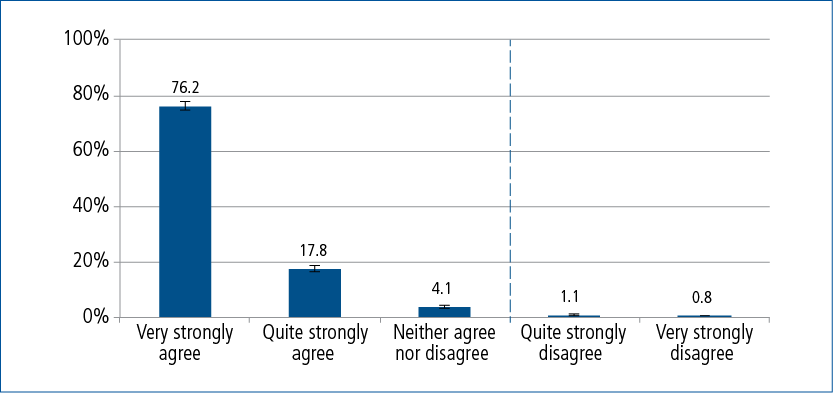
Finally, we examined the importance of parental attitudes to child immunisation. In the first wave of the LSAC survey, the child's parent was asked:
Overall, how much do you agree with children being immunised, that is having their needles or injections?
In response, the parent could answer:
(1) Very strongly agree, (2) Quite strongly agree, (3) Neither agree nor disagree, (4) Quite strongly disagree, or (5) Very strongly disagree.
Figure 4.2 shows that a large majority of parents agreed with children being immunised. Only 1.9% said they quite or very strongly disagreed with immunisation. This equates to about 4,390 parents in the Australian population of 1 year olds.
To assist interpretation, in the models the five responses were dichotomised as 0 if the response was 1, 2 or 3 (very strongly or quite strongly agree, or neutral) and 1 if the response was 4 or 5 (disagree very strongly or quite strongly). The dotted line in Figure 4.2 illustrates how responses were dichotomised.
It is important to note that parents who disagreed with childhood immunisation were not necessarily conscientious objectors. In Australia, parents whose child is registered with Medicare can choose to lodge an official objection to immunisation. However, they may still object to immunisation and not register as a conscientious objector (Hull et al., 2012). Data on conscientious objections are not available in the ACIR linked data. Therefore, it is impossible to know how many of the 1.9% of parents who quite or very strongly disagreed with immunisation were conscientious objectors.
Figure 4.2: Parental attitude to child immunisation in the B cohort
Data analysis
We examined the relationship between immunisation status at 12, 24 and 60 months and the demographic/household factors, psychosocial factors and parental attitude to immunisation using multinomial logistic regression. Separate analyses were carried out for immunisation status at each milestone age of 12, 24 and 60 months. For each immunisation status outcome, we first examined univariate models, in which only one predictor variable at a time was included. We then examined a multivariate model, in which all the relevant predictor variables in Table 4.5 and parental attitude to immunisation were simultaneously included. Therefore, the results of each multivariate model estimate the effect of each variable on the immunisation status outcome after controlling for effects of all other variables. For each immunisation status outcome, the same sample was used for the univariate and multivariate models.
To assist interpretation, in the sections below, we discuss separately the results for demographic factors, psychosocial factors and parental attitude. However, in the multivariate models the results are from models that include all predictor variables so, for example, results for demographic factors are adjusted for psychosocial factors and parental attitude. Estimates are presented as the average percentage point change in the probability of each immunisation status (i.e., fully immunised, partially immunised, non-immunised) associated with a one-unit increase in each predictor variable. Because all of the predictor variables are categorical, this means a change to being in one category compared to the reference category; for example, having two study-child siblings in the household compared to no study-child siblings.
Results for demographic characteristics
Table 4.6 shows univariate and multivariate estimates for effects of demographic characteristics on full, partial and non-immunisation status at 12 months. Table 4.7 shows effects for 24 months. In the univariate models for immunisation status at 12 months, the following patterns emerged:
- Children in single-mother households were less likely to be fully immunised, and more likely
to be partially immunised. - Children living in households with a greater number of children had a lower likelihood
of full immunisation, and higher likelihood of partial immunisation. - Children in households that had experienced financial stress were less likely to be fully
immunised and more likely to be partially immunised. - Children in households receiving the Child Care Benefit were less likely to be non-immunised.
- Children who had moved residence at least once since birth were more likely to be partially immunised.
At 24 months, the univariate models for immunisation status showed only two key patterns:
- Children living in households with a greater number of children had a lower likelihood of full immunisation, and higher likelihood of partial immunisation, though these effects were not as strong as at 12 months.
- Children in households in the lowest income quintile were less likely to be fully immunised and more likely to be partially immunised.
Notes: Statistically significant differences are noted: * p < .05; ** p < .01; *** p < .001. Analyses control for psychosocial factors and parental attitude to immunisation.
Source: B cohort, Wave 1 (n = 3,755)
Notes: Statistically significant differences are noted: * p < .05; ** p < .01; *** p < .001. Analyses control for psychosocial factors and parental attitude to immunisation.
Source: B cohort, Wave 1 (n = 3,755)
In the multivariate model for 12 months, effects for being in a single-mother household, financial hardship and residential mobility were no longer significant. Consequently, multivariate results for
12- and 24-month status were quite similar. At both ages, a higher number of siblings was associated with a higher likelihood of partial immunisation, and receipt of the Child Care Benefit with a lower likelihood of non-immunisation. At 24 months, low parental income continued to be associated with a higher likelihood of partial immunisation. In the multivariate models only, children of mothers who were born outside Australia were less likely to be fully immunised, although at 12 months, children of mothers who spoke English at home were also less likely to be fully immunised.
The effects of demographic factors on immunisation at 60 months are shown in Table 4.8. There was only one variable (low income) that was significantly associated with partial immunisation in the univariate models that was no longer significant in the multivariate model. All other variables that were significantly associated with non-immunisation in the univariate models were still associated with non-immunisation in the multivariate model, except that effect sizes were somewhat attenuated. We discuss estimates from the multivariate model.
Findings showed that having more siblings in the household continued to be strongly associated with partial immunisation. The likelihood of partial immunisation at 60 months was 17 percentage points higher for study children in a household with three or more siblings compared to children in a household with no siblings. Also, a few statistically significant factors emerged that had not been significant in multivariate models at earlier ages. At 60 months, the likelihood of partial immunisation was 7 percentage points higher in children in single-mother households than children in dual-parent households. Experience of financial stress in the last 12 months was also associated with an increased likelihood of partial immunisation. Finally, children who had moved at least once in the last 12 months were less likely to be fully immunised. This may be because residential mobility is an indicator of disadvantage (Edwards, Mullan, Katz, & Higgins, 2014), or because moving disrupts connections between parents and health care providers. Regardless, the findings suggest that indicators of disadvantage are a little more strongly connected to partial immunisation at 60 months compared to 12 and 24 months. It is likely that the much larger percentage of partially immunised 60 month olds provides the necessary power for these factors to reach statistical significance.
Results for psychosocial factors
Table 4.9 shows univariate and multivariate estimates for effects of psychosocial factors on full, partial and non-immunisation status at 12 months, and Table 4.10 shows effects at 24 months. Only a few psychosocial variables were significantly associated with immunisation status at 12 or 24 months:
- In both the 12- and 24-month univariate models, children of mothers who reported experiencing more stressful life events, especially three events and more, were less likely to be fully immunised and more likely to be non-immunised. The association between stressful life events and immunisation status was reduced in size in the 12-month multivariate model, and was non-significant in the 24-month multivariate model.
- In the 12-month univariate model children of mothers who reported symptomatic levels of depressive symptoms were more likely to be partially immunised, but this was not statistically significant in the multivariate model.
- In the 12-month univariate model medium levels of warm parenting (compared to low levels of warm parenting) were associated with a higher likelihood of full immunisation, but this was not significant in the multivariate model.
Table 4.11 shows univariate and multivariate estimates for effects of psychosocial factors on the probability of full, partial and non-immunisation status at 60 months. The same variables were significant in both univariate and multivariate models, so we focus on the multivariate estimates. By the time children were 5 years old, mothers' experience of frequent time pressure was associated with a decreased probability of full immunisation and an increased probability of partial immunisation. Interestingly, higher levels of hostile parenting at Wave 2 were associated with a higher probability of full immunisation and a lower probability of partial immunisation: the likelihood of full immunisation at 60 months was 5 percentage points higher in children of parents who reported high levels of harsh parenting compared to low levels of harsh parenting.
Notes: Statistically significant differences are noted: * p < .05; ** p < .01; *** p < .001. Analyses control for psychosocial factors and parental attitude to immunisation. a The numbers of children participating at each wave of LSAC vary, meaning that the sample size used to predict immunisation status at 60 months differs slightly from the sample size used to predict immunisation at12 and 24 months. This means that some of the differences observed between the apparent effects of the same predictors measured at Wave 1 vs Wave 2 could be due to this change in sample size.
Source: B cohort, Wave 2 (n = 3,069)
Notes: Statistically significant differences are noted: * p < .05; ** p < .01; *** p < .001. Analyses control for demographic/household factors and parental attitude to immunisation.
Source: B cohort, Wave 1 (n = 3,755)
Notes: Statistically significant differences are noted: * p < .05; ** p < .01; *** p < .001. Analyses control for demographic/household factors and parental attitude to immunisation.
Source: B cohort, Wave 1 (n = 3,755)
Notes: Statistically significant differences are noted: * p < .05; ** p < .01; *** p < .001. Analyses control for demographic/household factors and parental attitude to immunisation.
† The upper two 33% percentiles were not unique for parenting warmth at Wave 2, therefore parenting warmth was classified as low and medium/high
Source: B cohort, Wave 2 (n = 3,069)
Results for parental attitude to childhood immunisation
Table 4.12 shows the effect of a parent disagreeing very strongly or quite strongly (compared to agreeing very strongly or quite strongly, or being neutral) on predicted change in the probability of being fully immunised, partially immunised and non-immunised at 12 and 24 months, and of being non-immunised at 60 months. At all ages, and in both univariate and multivariate models, parental disagreement was associated with at least a 60 percentage point lower likelihood of full immunisation. However, parental disagreement was not related to partial immunisation at 12 and 24 months. This strongly suggests that non-immunisation is mostly the result of parental choice, while partial immunisation may be better accounted for by demographic or other psychosocial factors.
Notes: Statistically significant differences are noted: * p < .05; ** p < .01; *** p < .001.
Analyses control for demographic/household and psychosocial factors.
Source: 1 B cohort, Wave 1 (n = 3,755); 2 B cohort, Wave 2 (n = 3,069).
What are the most important correlates of non- and partial immunisation?
The results of the multivariate models discussed above showed that several demographic variables increased the risk of partial immunisation. Consistent with the literature, children with more siblings were at increased risk of not being fully immunised (Bond, Nolan, & Lester, 1999; Brown et al., 2010; Falagas & Zarkadoulia, 2008; Haynes & Stone, 2004; Pearce et al., 2008; Samad et al., 2006). Children in households experiencing indicators of disadvantage (e.g., low income, financial strain, residential mobility) were at slightly higher risk of being partially immunised than children in households not experiencing these indicators of disadvantage. These effects were strongest at 60 months and smallest at 24 months. Effects of psychosocial variables were small and inconsistent over time, but generally suggested that stressful life events and lack of time played some role in hindering full immunisation.
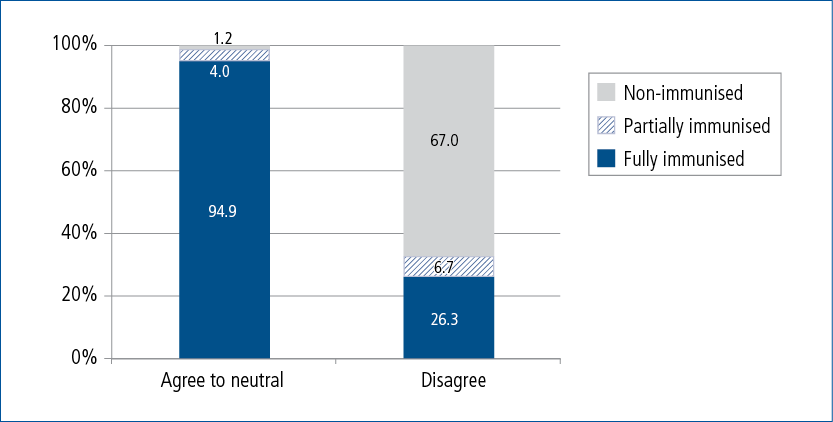
Overall, however, results showed that parental attitude was far and away the most important correlate of non-immunisation (but not partial immunisation) at all three ages. Figure 4.3 illustrates this with simple cross-tabulation of the dichotomised parental attitude variable with immunisation status at 12 months. Parents who agreed with immunisation were very likely to immunise their child. On the other hand, 67% of children whose parents disagreed - either quite strongly or very strongly - were non-immunised. In the population of Australian 1 year olds in 2004, this would equate to between 2,190 and 3,689 children.
Figure 4.3: Parental attitude to child immunisation and immunisation status at 12 months
Exploring the role of parental attitudes in childhood immunisation
Given the importance of parental attitudes, we carried out follow-up analyses to understand how much of an impact changing parental attitude might have. First, we estimated the population attributable fraction for parental attitudes with regard to non-immunisation. The population attributable fraction (Greenland & Drescher, 1993) provides an estimate of how much non-immunisation can be accounted for by parent disagreement. For instance, it can suggest how much of the existing proportion of non-immunisation in the whole sample might be prevented if some kind of intervention could make all parents not disagree with immunisation. Additionally, it can tell us how much of the non-immunisation among disagreeing parents only might be prevented if all these parents agreed with immunisation. All these estimates assume that parental attitude to childhood immunisation has a causal effect on non-immunisation, and that all other factors (i.e., demographics, psychosocial factors) remain the same.
Figure 4.4 shows these population attributable fractions for non-immunisation at 12, 24 and 60 months. In the whole sample at 12 and 24 months, around 50% of all non-immunisation was attributable to parent disagreement with childhood immunisation, and at 60 months around 62% of non-immunisation was attributable to this parent disagreement. Therefore, at each of these ages, between 2,000 and 3,000 cases of non-immunisation might be prevented if parental disagreement could be removed. In parents who disagree, virtually all of the non-immunisation at 12, 24 and 60 months is attributable to this disagreement.
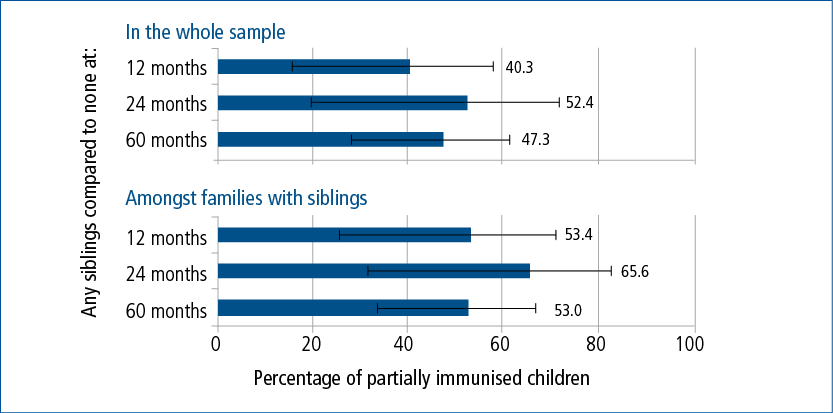
For comparison, we carried out the same analyses for number of siblings with regard to partial immunisation, as siblings were the next most consistent predictor of immunisation status. The results are shown in Figure 4.5. We pooled across siblings, estimating at each age how many cases of partial immunisation were attributable to living in a household with at least one sibling, compared to no siblings. At 12 months, about 40% of partial immunisation in the whole sample was attributable to number of siblings, rising to about 50% at 24 and 60 months. Among families with siblings, between half and two-thirds of cases of partial immunisation were attributable to number of siblings (50% at 12 months and 60 months; 65% at 24 months). Two features of these analyses may be noted in comparison to those for attitudes. First, the confidence intervals are much larger, showing that the estimates for the role of siblings in partial immunisation are less stable than for attitudes. Second, among larger families only about 50-60% of cases of partial immunisation were attributable to family size. Both these features suggest that it is not family size alone that increases the risk of partial immunisation, but other factors that may be correlated with family size such as lack of time, lack of transport, difficulties with child care arrangements and lower financial resources.
4.4 Conclusion
The aim of this chapter was to describe patterns and predictors of incomplete immunisation at 12, 24 and 60 months in the LSAC B cohort. The LSAC data were linked to immunisation records. This enabled us to use the extensive information about children's families and communities available in LSAC to examine how children's immunisation status was related to a range of demographic and psychosocial factors.
Figure 4.4: The percentage of non-immunisation at 12, 24 and 60 months that is attributable to parent disagreement with childhood immunisation
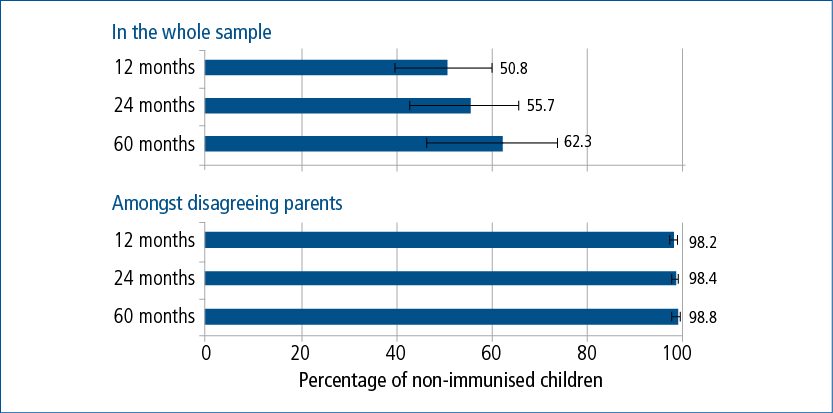
Figure 4.5: The percentage of partial immunisation at 12, 24 and 60 months that is attributable to children living in a household with at least one sibling
These analyses make two important contributions to the literature. First, unlike most previous studies that have examined predictors of incomplete immunisation, we considered how children who were fully immunised were different from both children who were partially immunised, and from children who were not immunised at all. Our results are consistent with international studies showing that there are some important differences between these groups (Samad et al., 2006; Smith et al., 2004). Second, this is the first nationally representative study to show that parental attitude to immunisation is a stronger correlate of incomplete immunisation than demographic or psychosocial variables. We discuss these findings in more detail shortly.
Patterns of full, partial, and non-immunisation
Our first three research questions asked:
- What are the rates of full, partial and non-immunisation in the LSAC children?
- How persistent is incomplete immunisation between 12 and 60 months?
- How accurate is parents' understanding of whether children are up to date with the immunisation schedule?
Rates of full immunisation at 12 and 24 months were above 90%, and at 60 months the rate was a little over 80%, which are comparable with national estimates from the period. To date, studies have not examined the extent to which children's immunisation status persists over time. Our descriptive results showed that most children who started out partially immunised went on to be fully immunised at older ages, but that children who started out non-immunised were very unlikely to be even partially immunised in the future. This suggests that strategies to encourage catch-up immunisation might need to be different for these groups.
Parents' perceptions of how up to date their children were with the immunisation schedule provided another interesting perspective on immunisation status and gives an insight into whether information campaigns would be effective in raising the immunisation rate. Using a subsample of children who were aged 7-10 months old at the Wave 1 interview, we found that 44% of parents of partially immunised children thought their child was fully up to date with the immunisation schedule. In contrast, 99% of parents of fully immunised children said their child was fully up to date, and parents of non-immunised children were also quite accurate (about 18% thought their child was fully up to date).
The poor correspondence between parent perceptions and actual immunisation record data for partially immunised children, in particular, suggests that increasing parents' knowledge about the schedule may lead to higher rates of full immunisation. It may also lead to children achieving the full immunisation status earlier, given that those with partial immunisation are likely to eventually become fully immunised. While contemporary parents may have more knowledge than parents in 2004-08, we cannot know if this is the case because contemporary data of this nature are not available. Moreover, the schedule has been expanded in recent years, adding to the amount of information parents must retain.
Predictors of full, partial and non-immunisation
Our last two research questions were:
4. What demographic, psychosocial and attitudinal factors are associated with full, partial, and non-immunisation?
5. What are the most important correlates of partial immunisation and non-immunisation?
The importance of parental attitude to childhood immunisation
Previous studies examining incomplete immunisation have generally focused on demographic and social factors, especially indicators of poverty and disadvantage. However, objection to vaccination is one of the factors contributing to outbreaks of diseases such as measles and whooping cough (Dawson & Apte, 2015). Our results demonstrate for the first time that about 50% of non-immunisation in Australian children at the childhood milestones of 12, 24 and 60 months (between 2004 and 2006) was attributable to parent disagreement with immunisation. Partial immunisation, on the other hand, was not related to parental disagreement.
It is interesting to note that at 12 and 24 months, there were about as many non-immunised children of parents who agreed with immunisation as there were non-immunised children of parents who disagreed with immunisation. The key difference is that among parents who disagreed almost all non-immunisation of children was attributable to parental attitudes (see Figure 4.4). Whereas, non-immunisation in the children of parents who agreed with immunisation was not well explained and was not attributable to any single factor included in our analysis. As we discuss shortly, the other demographic and psychosocial variables were not strongly related to non-immunisation.
Demographic and psychosocial factors
The relatively small influences for demographic and psychosocial factors are a notable feature of these analyses, especially in comparison to studies that have shown a strong influence of these factors (e.g., Haynes & Stone, 2004). There are two main reasons that probably account for the small influence of non-attitudinal factors in this study. First, some demographic and psychosocial variables were not associated with immunisation status in the multivariate models because they were correlated with other variables in the model, and thus had no unique explanatory power for immunisation status. For example, the univariate models for immunisation status at 12 months showed that single-parent families and low income were associated with incomplete immunisation, but these associations were not statistically significant in the multivariate model. These associations were small even in the univariate models, so overall we conclude that collinearity is not the only explanation for the small influences of demographic and psychosocial variables. The second reason is that partial and non-immunisation were rare, especially at 12 and 24 months, and there was insufficient power to observe associations between demographic variables and these outcomes that affected only 5-7% of the sample. Studies of whole populations in Australia have uncovered associations between indicators of low socio-economic status and incomplete immunisation (e.g., Haynes & Stone, 2004; Hull et al., 2001). A sample with a larger proportion of disadvantaged families might be required to more thoroughly investigate demographic risk factors for partial and non-immunisation, especially at 12 and 24 months.
However, some of the demographic and psychosocial variables did emerge as statistically significant predictors of immunisation status in the first two years:
- At 12 and 24 months, children in families with more siblings were more likely to be partially immunised.
- At 12 and 24 months, children in families who were receiving the Child Care Benefit were more likely to be fully immunised, or less likely to be non-immunised. As complete immunisation was an eligibility requirement for the Child Care Benefit, this likely reflects the incentive to immunise.
- At 24 months only, children in households in the lowest income quintile were more likely to be partially immunised.
- At 12 months only, children of mothers who had experienced three or more stressful life events in the past year were more likely to be non-immunised.
- At 12 and 24 months, there was a small decrease in the likelihood of full immunisation among the children of mothers born outside Australia. Other Australian research has shown that having a mother born overseas is associated with increased risk of incomplete immunisation (Haynes & Stone, 2004). However, in the present study, we also found that full immunisation at 12 months was less likely in children of mothers who spoke English at home. This makes it unclear how to interpret these two coefficients. Given that the effects were small and not statistically significant in the univariate models, we do not interpret these effects further.
The demographic and psychosocial variables were more strongly related to immunisation status at 60 months. A higher likelihood of incomplete immunisation at 60 months was related to:
- having more siblings;
- single parenthood;
- experience of financial stress;
- having moved in the last 2 years;
- a mother often or always feeling rushed; and
- lower levels of parenting hostility.
Moreover, the effects sizes for siblings were substantially larger at 60 months than at 12 or 24 months. These results suggest that financial and time pressures may make it difficult for some parents of 4 year olds to keep up with the immunisation schedule. However, all these influences were small in comparison to the role of parental attitudes.
The relationship between more hostile parenting and a higher likelihood of full immunisation at 60 months is puzzling. One possibility is that low levels of hostility actually indicate parenting that is overly permissive, or low in control. "Control" refers to firm discipline and the setting of appropriate limits and expectations on children's behaviour. Appropriate control is generally associated with a wide range of positive child outcomes, including health outcomes (Amato & Fowler, 2002). For example, a study using the K cohort found that low paternal parenting control increased the odds of 4-5 year olds being overweight or obese (Wake, Nicholson, Hardy, & Smith, 2007). It is possible that low control could also lead to delayed immunisation, especially if parents are also stressed in other ways. There could also be a complex relationship between parenting style and parental attitude to immunisation (such as parents with a harsh discipline style being more rule-bound, socially conservative and compliant), or this could be a chance finding. Understanding this finding requires more research.
Apart from attitudes, the only factor that was consistently associated with immunisation status at 12, 24 and 60 months was the number of siblings in the household. At all ages, children with siblings were less likely to be fully immunised, or more likely to be partially immunised, compared to children with no siblings in the household. This finding is consistent with past studies that have frequently found large family size to be related to incomplete immunisation (Falagas & Zarkadoulia, 2008; Luman et al., 2003) and suggests that caring for many children might create barriers to immunisation. For instance, it is possible that factors such as time pressure and financial stress are clustered in some larger families.
Partial immunisation versus non-immunisation
Previous studies comparing partial and non-immunisation suggest that partially immunised children are from less affluent families than both fully immunised and non-immunised children (e.g., Samad et al., 2006; Smith et al., 2004). However, in LSAC data, demographic factors were not as strongly related to the probability of children being partially immunised as we expected, especially at 12 and 24 months. One reason for this may be that because infant immunisation coverage in Australia is high, even children from high-risk families are engaged by the public health system. As discussed, however, it is also likely that we had insufficient power to uncover the reasons why a small group of children are not fully immunised, even though their parents have not made the choice to reject vaccination entirely.
Subtypes of incompletely immunised children
Comparison of the univariate and multivariate models generally suggests that the demographic factors, psychosocial factors and attitudes to immunisation operate somewhat independently to their relationship to immunisation status. This raises the possibility that there may be fairly distinct groups of incomplete-immunising parents, perhaps including those who disagree, those who have difficulties accessing timely vaccinations because of disadvantage or lack of time or lack of knowledge of the schedule, and those whose children have health concerns that prevent complete immunisation. Some researchers have begun to explore a subgroup approach to non-immunisation (Pearce, Marshall, Bedford, & Lynch, 2015) and this is an issue for future research.
Limitations
The strengths of this study include its nationally representative design and linked administrative data on immunisation, eliminating the problems with parent or provider recall present in other studies of immunisation. It also fills a gap in the literature by examining the association between immunisation status and parental attitude to immunisation alongside demographic and psychosocial factors. While the availability of data on attitudes is an advantage, information about specific reasons for incomplete immunisation was not available, so we could not examine the role of health-related concerns or contra-indications. Another weakness was that the parental attitude item was available from the primary caregiver at Wave 1 only. This means that we could not assess the extent to which both parents agreed or disagreed with childhood immunisation. Also, changes in attitude could not be assessed. However, Wave 1 parental attitude remained strongly related to incomplete immunisation 4 years later, even after controlling for more contemporaneous factors. This suggests that the attitude of the primary caregiver might be quite stable in the first few years of a child's life. The LSAC data also cannot examine geographic variations in immunisation coverage and conscientious objection (Hull, Dey, Menzies, & McIntyre, 2013; Hull et al., 2012).
Another limitation is that the LSAC sample excluded temporary residents, who may be new arrivals to Australia (Soloff et al., 2005). Research shows that children born overseas are also less likely to be completely immunised. Children from some developing countries, or who are refugees, may arrive without adequate immunisation. Also, immunisations received overseas are not always transferred to the ACIR (Gibbs, Hoskins, & Effler, 2015). The correlation between maternal or child overseas birth and partial/non-immunisation would need to be examined using other data.
Finally, these data are now 7-10 years old, somewhat limiting the extent to which conclusions can be drawn about Australian infants and parents in the present. As coverage at 12 and 24 months has remained relatively stable, it is likely that contemporary findings would be similar to our findings for 12 and 24 months. As coverage at 60 months has increased to over 90%, however, our findings could be less applicable to a contemporary 60-month cohort.
Policy implications
The present study highlighted improvement in parental attitudes as the factor that could yield the greatest increase in immunisation coverage at all ages. For example, 2,000 to 3,000 more children Australia-wide might be immunised at 12 months if all parents agreed with immunisation. However, the evidence suggests that it is very difficult to shift the attitudes of those who object to immunisation. Some information and education campaigns have reported small improvements in parents' intentions to vaccinate (Gowdra, Schaffer, Kopec, Markel, & Dempsey, 2013; Williams, Rothman, Offit, Schaffner, Sullivan, & Edwards, 2013) but a recent nationally representative US trial of a vaccine-information campaign found that it actually decreased intent to vaccinate among parents who had the least favourable attitudes towards vaccines (Nyhan, Reifler, Richey, & Freed, 2014). Therefore, targeting committed vaccine-objectors may not be an effective approach.
A more cost-effective approach might be to instead target those who are vaccine hesitant, rather than hardened objectors. Researchers have begun to develop communication frameworks for GPs and other immunisation providers for talking with vaccine-hesitant parents (Danchin & Nolan, 2014; Leask, Kinnersley, Jackson, Cheater, Bedford, & Rowles, 2012). These frameworks emphasise respectful communication that is tailored to specific parents' concerns, and that aims to guide - rather than direct - the parent towards making a quality, evidence-based decision. Such approaches have been useful in other areas of health promotion such as smoking cessation, but evidence in the vaccine setting is still sparse. An important component of the current funding boost to the National Immunisation Program involves providing tools to assist immunisation providers to talk with vaccine-hesitant parents, as well as awareness campaigns (see Box 4.1). To support the development of these policy initiatives, future research should explore the role of mild disagreement with immunisation for explaining immunisation status at key milestones.
Other effective approaches are to address logistic problems that some families, especially those with several children, may have in accessing immunisation. Recall and reminder systems at both the provider and family level could be effective in increasing vaccine uptake (Harvey, Reissland, & Mason, 2015), as could "catch-up plans" for delayed and overdue vaccinations (Ward, Chow, King, & Leask, 2012). As we found that 44% of parents of partially immunised children thought their child was fully up to date with the schedule, these strategies to remind parents, in concert with targeted messages addressing the concerns of immunisation-hesitant parents, should be especially useful in addressing partial immunisation.
Future research
This study has contributed to our understanding of some factors underlying partial and non-immunisation in an Australian birth cohort. However, much remains to be learned about reasons for incomplete immunisation in Australia. Future researchers should consider focusing on sub-populations that may be at high risk of incomplete immunisation, such as very disadvantaged families and new arrivals to Australia. The specific reasons for late immunisation in large families should be more closely examined, in order to design effective interventions. More detailed measures of parental attitudes towards immunisation should also be examined, especially vaccine hesitancy. In addition, it would be interesting to consider whether the identification of distinct clusters of parents, defined by demographic and attitudinal differences, would be useful for targeting policy initiatives.
4.5 References
Amato, P., & Fowler, F. (2002). Parenting practices, child adjustment, and family diversity.
Journal of Marriage and the Family, 64, 703-716.
Australian Institute of Family Studies. (2013). The Longitudinal Study of Australian Children. Data User Guide. Melbourne: Australian Institute of Family Studies. Retrieved from <www.growingupinaustralia.gov.au/data/docs/userguide.pdf>.
Bond, L., Nolan, T., & Lester, R. (1999). Immunisation uptake, services required and government incentives for users of formal day care. Australian and New Zealand Journal of Public Health, 23, 368-376.
Brenner, R., Simons-Morton, B., Bhaskar, B., Das, A., Clemens, J., & the NIH-D.C. Initiative Immunization Working Group. (2001). Prevalence and predictors of immunization among inner-city infants: a birth cohort study. Pediatrics, 180, 661-670.
Brown, K., Kroll, J., Hudson, M., Ramsay, M., Green, J., Long, S. et al. (2010). Factors underlying parental decisions about combination childhood vaccinations including MMR: A systematic review. Vaccine, 28, 4235-4248.
Chin, L., Crawford, N., Rowles, G., & Buttery, J. (2012). Australian immunisation registers: Established foundations and opportunities for improvement. Eurosurveillance, 17(16. Art. No. 20148)
Danchin, M., & Nolan, T. (2014). A positive approach to parents with concerns about vaccination for the family physician. Australian Family Physician, 43(10), 690-694.
Dawson, B., & Apte, S. (2015). Measles outbreaks in Australia: obstacles to vaccination.
Australian and New Zealand Journal of Public Health (published online). doi: 10.1111/1753-6405.12328.
Department of Health (2013). National Immunisation Strategy for Australia 2013-2018. Canberra, ACT: Department of Health. Retrieved from <www.immunise.health.gov.au/internet/immunise/publishing.nsf/Content/immu....
Department of Human Services. (2015). Immunising your children. Canberra, ACT: Department of Health. Retrieved from <www.humanservices.gov.au/customer/subjects/immunising-your-children>.
Department of Social Services. (2015a). Guide to social policy law, family assistance guide. Version 1.181 (Released 21 September 2015). Canberra: Department of Social Services. Retrieved from <guides.dss.gov.au/family-assistance-guide/3/6/4>.
Department of Social Services (2015b). Strengthening immunisation requirements: Fact Sheet. Canberra: Department of Social Services. Retrieved from from <www.dss.gov.au/our-responsibilities/families-and-children/benefits-payme....
Edwards, B., Mullan, K., Katz, I., & Higgins, D. (2014). The Stronger Families in Australia (SFIA) Study: Phase 2, (Research Report No. 29). Melbourne: AIFS. Retrieved from <aifs.gov.au/publications/stronger-families-australia-sfia-study-phase-2>.
Falagas, M., & Zarkadoulia, E. (2008). Factors associated with suboptimal compliance to vaccinations in children in developed countries: A systematic review. Current Medical Research and Opinion, 24, 1719-1741.
Gibbs, R., Hoskins, C., & Effler, P. (2015). Children with no vaccinations recorded on the Australian Childhood Immunisation Register. Australian and New Zealand Journal of Public Health, 39, 294-295. doi: 10.1111/1753-6405.12354
Greenland S., & Drescher, K. (1993). Maximum likelihood estimation of the attributable fraction from logistic models. Biometrics, 49, 865-872.
Gowdra, C., Schaffer, S., Kopec, K., Markel, A., & Dempsey, A. (2013). A pilot study on the effects of individually tailored education for MMR vaccine-hesitant parents on MMR vaccination intention. Human Vaccines and Immunotherapeutics, 9, 437-445. doi: http://dx.doi.org/10.4161/hv.22821.
Hanna, J., Wakefield, J., Doolan, C., & Messner, J. (1994). Childhood immunisation: Factors associated with failure to complete the recommended schedule by two years of age. Australian Journal of Public Health, 18, 15-21.
Harvey, H., Reissland, N., & Mason, J. (2015). Parental reminder, recall and educational interventions to improve early childhood immunisation uptake: A systematic review and meta-analysis. Vaccine, 33(25), 2862-2880.
Haynes, K., & Stone, C. (2004). Predictors of incomplete immunisation in Victorian children.
Australian and New Zealand Journal of Public Health, 28, 72-79.
Hilton, M. F., Whiteford, H. A., Sheridan, J. S., Cleary, C. M., Chant, D. C., Wang, P. S., et al. (2008). The prevalence of psychological distress in employees and associated occupational risk factors. Journal of Occupational and Environmental Medicine, 50, 746-757.
Homel, J., & Edwards, B. (2016). Using Australian Childhood Immunisation Register data in the Longitudinal Study of Australian Children, (LSAC Technical Report). Melbourne: AIFS.
Hull, B. (2015). Australian childhood immunisation coverage, 1 January to 31 March cohort, assessed as at 30 June 2014. Communicable Diseases Intelligence, 39, e165-e166.
Hull, B. P., Deeks, S. L., & McIntyre, P. B. (2009). The Australian Childhood Immunisation Register: A model for universal immunisation registers? Vaccine, 27(37), 5054-5060.
Hull, B., Dey, A., Mahajan, D., Menzies, R., & McIntyre, P. (2011). Immunisation coverage annual report, 2009.
Communicable Diseases Intelligence, 35(2), 132-148.
Hull, B., Dey, A., Menzies, R., Brotherton, J., & McIntyre, P. (2012). Immunisation coverage annual report, 2012. Communicable Diseases Intelligence, 38, E202-E231.
Hull B., Lawrence G., MacIntyre C., & McIntyre P. (2003). Estimating immunisation coverage: is the 'third dose assumption' still valid? Communicable Diseases Intelligence, 27, 357-361.
Hull, B., McIntyre, P., & Sayer, G. (2001). Factors associated with low uptake of measles and pertussis vaccines: An ecologic study based on the Australian Childhood Immunisation Register. Australian and New Zealand Journal of Public Health, 25, 405-410.
Hull B., & McIntyre P. (2000). Immunisation coverage reporting through the Australian Childhood Immunisation Register:
An evaluation of the third-dose assumption. Australian and New Zealand Journal of Public Health, 24, 17-21.
Hull, B., Mahajan, D., Dey, A. Menzies, R., & McIntyre, P. (2010). Immunisation coverage annual report, 2008.
Communicable Diseases Intelligence, 34, 241-258.
Hull, B., Dey, A., Menzies, R., & McIntyre, P. (2013). Immunisation coverage annual report, 2010.
Communicable Diseases Intelligence, 37(1), E21-E39.
Immunise Australia. (2015, 21 April). Improving immunisation coverage rates. Canberra: Department of Health. Retrieved from <www.immunise.health.gov.au/internet/immunise/publishing.nsf/Content/impr....
Kavanaugh, M., Halterman, J., Montes, G., Epstein, M., Hightower, D., & Weitzman, M. (2006). Maternal depressive symptoms are adversely associated with prevention practices and parenting behaviors for preschool children. Ambulatory Pediatrics, 6, 32-37.
KPMG Consulting. (2000). Evaluation of the General Practice Immunisation Incentives scheme. Report prepared for the Commonwealth Department of Health and Aged Care. Canberra: KPMG Consulting.
Leask, J., Kinnersley, P., Jackson, C., Cheater, F., Bedford, H., & Rowles, G. (2012). Communicating with parents about vaccination: A framework for health professionals. BMC Pediatrics, 12(1), 154. doi: 10.1186/1471-2431-12-154
Luman, E., Mason, M., Shefer, A., & Chu, S. (2003). Maternal characteristics associated with vaccination of young children. Pediatrics, 111, 1215-1218.
Naidu, L., Chiu, C., Habig, A., Lowbridge, C., Jayasinghe, S., Wang, H., McIntyre, P., & Menzies, R. (2013). Vaccine preventable diseases and vaccination coverage in Aboriginal and Torres Strait Islander people, Australia 2006-2010. Communicable Diseases Intelligence, 37(Suppl), S1-95.
National Centre for Immunisation Research and Surveillance of Vaccine PrevenTable Diseases. (2007). Vaccine preventable diseases and vaccination coverage in Australia, 2003-2005. Communicable Diseases Intelligence, 31 (Suppl. June), i-S152.
National Centre for Immunisation Research and Surveillance of Vaccine PrevenTable Diseases (2010). Vaccine prevenTable diseases and vaccination coverage in Australia, 2005-2007. Communicable Diseases Intelligence, 34 (Suppl. December), i-S167.
National Health and Medical Research Council. (2000). The Australian Immunisation Handbook. 7th Edition. Canberra: Commonwealth of Australia.
National Health and Medical Research Council. (2003). The Australian Immunisation Handbook. 8th Edition. Canberra: Commonwealth of Australia.
Nyhan, B., Reifler, J., Richey, S., & Freed, G. (2014). Effective messages in vaccine promotion: A randomized trial. Pediatrics, 133, e835-e842. doi: 10.1542/peds.2013-2365
O'Brien, E., Sam, G., & Mead, C. (1998). Methodology for measuring Australia's childhood immunisation coverage. Communicable Diseases Intelligence, 22, 36-37.
Pearce, A., Law, C., Elliman, D., Cole, T., Bedord, H., & the Millenium Cohort Study Child Health Group (2008). Factors associated with uptake of measles, mumps, and rubella vaccine (MMR) and use of single antigen vaccines in a contemporary UK cohort: prospective cohort study. BMJ, 336, 754.
Pearce, A., Marshall, H., Bedford, H., & Lynch, J. (2015). Barriers to childhood immunisation: Findings from the Longitudinal Study of Australian Children. Vaccine, 33, 3377-3383. doi: http://dx.doi.org/10.1016/j.vaccine.2015.04.089
Ruff, T. A., Taylor, K., & Nolan, T. (2012). Australia's contribution to global immunisation. Australian and New Zealand Journal of Public Health, 36(6), 564-569.
Salmon, D., Teret, S., MacIntyre, C., Salisbury, D., Burgess, M. & Halsey, N. (2006). Compulsory vaccination and conscientious or philosophical exemptions: past, present and future. Lancet, 367, 436-442.
Samad, L., Tate, A., Dezateux, C., Peckham, C., Butler, N., Bedord, H. & the Millenium Cohort Study Child Health Group. (2006). Differences in risk factors for partial and no immunisation in the first year of life: prospective cohort study. BMJ, 332, 1312-1313.
Smith, P., Chu, S., & Barker, L. (2004). Children who have received no vaccines: Who are they are where do they live? Pediatrics, 114, 187-195.
Soloff, C., Lawrence, D., & Johnstone, R. (2005). Sample Design, (LSAC Technical Paper No. 1). Melbourne: Australian Institute of Family Studies.
Wake, M., Nicholson, J., Hardy, P., & Smith, K. (2007). Preschooler obesity and parenting styles of mothers and fathers: Australian national population study. Pediatrics, 120, e1520-e1527.
Ward, K., Chow, M., King, C., & Leask, J. (2012). Strategies to improve vaccination uptake in Australia, a systematic review of types and effectiveness. Australian and New Zealand Journal of Public Health, 36, 369-377. doi: 10.1111/j.1753-6405.2012.00897.x
Williams, S., Rothman, R., Offit, P., Schaffner, W., Sullivan, M., & Edwards, K. (2013). A randomized trial to increase acceptance of childhood vaccines by vaccine-hesitant parents: A pilot study. Academic Pediatrics, 13, 475-480. doi: 10.1016/j.acap.2013.03.011.
1 This was changed to under 20 years of age from 1 January 2016
2 Comprehensive comparative information about international rates of immunisation are provided by the World Health Organization <www.who.int/topics/immunization/en/>. For an overview and history of conscientious objection and compulsory vaccination in international perspective see Salmon et al. (2006).
3 This is a summary of main initiatives only. For more details, refer to Chin et al. (2012); Hull, Deeks & McIntyre, (2009); Hull et al. (2012); KPMG Consulting's (2000) evaluation of the General Practice Immunisation Incentives (GPII) Scheme; NCIRS coverage reports 2003-2005 (NCIRS, 2007) and 2005-2007 (NCIRS, 2010); Ruff, Taylor & Nolan (2012); and the Department of Health (2013) National Immunisation Strategy for Australia 2013-2018.
Share


