3. Diversity, complexity and change in children's households
3. Diversity, complexity and change in children's households

3.1 Introduction
While the majority of Australian children live with their two biological parents throughout their childhood (de Vaus & Gray, 2007), the changing demography of families has meant that a significant number of children experience more complex family relationships (Baxter, Edwards, & Maguire, 2012; de Vaus & Gray, 2007). Family complexity as discussed in this chapter refers to children living with a single parent or with parent figures who are not biological parents (and also when they are cared for by parents who live in two households, usually post-separation), when they live with step- or half-siblings, or with adults other than parents or parent figures.1 This is consistent with recent approaches taken in analyses of family complexity in the United States (e.g., Brown, Manning, & Stykes, 2015; Manning, Brown, & Stykes, 2014). That is, children are considered here to not be living in a complex family if they live only with their two biological parents and only full biological siblings or no siblings at all.
While the chapter begins here with a discussion of family complexity, in analysing the LSAC data we instead refer to "household complexity", given that some households contain non-family members. We have not separately examined to what extent households are made up of more than one family, but have instead focused on describing the various relationships of household members to the LSAC study child. It is this child-focused perspective on complexity that is the key contribution of this chapter. The chapter presents this complexity from a demographic perspective. While this perspective is useful to gain some awareness of who may be part of children's lives, it is worth noting that children (and other household members) may have different views on who constitutes their family (Mason & Tipper, 2008).
Long-term demographic trends that have contributed to family complexity include the rise in divorce rates (Weston & Qu, 2014), meaning a substantial number of children today experience the separation of their parents (de Vaus & Gray, 2004). The growth in cohabiting relationships, which tend to be more unstable than marriage (Weston & Qu, 2014), has also contributed to this trend. For children who do not live with both parents, there may be complex across-household relationships when children spend some time living with each of the parents. Some children, then, have living arrangements that may be described as having a "double family" (Villeneuve-Gokalp, 2000). While it is not common for children to spend equal amounts of time in each parents' household, there are significant numbers of children who live predominantly with one parent yet spend some time in their other parent's household (Weston & Qu, 2014). Further, re-partnering by parents leads to a new set of relationships for children, within and potentially beyond their primary household (considered here to be the household within which they are enumerated for LSAC) (Baxter et al., 2012). In this chapter, the analyses begin by exploring children's experiences of complexity through a description of their relationships with parents.
Looking beyond the complexity created by children's relationships with parents noted above, some children have complex households through another related or unrelated person living in the same household. A particular example is that of three-generation households, with extended family members such as grandparents co-resident (Brandon, 2012; Pilkauskas & Martinson, 2014). For example, Pilkauskas and Martinson (2014), using the first three waves of the B cohort of LSAC, reported that 11% of children lived in a three-generation household at some time over their early childhood. (See also Dunifon, Ziol-Guest, and Kopko (2014) for related US research.) For some children, co-resident adults may be otherwise related (such as an aunt or uncle), or not related at all, and along with grandparent co-residence, this will be explored in this chapter.
Children's relationships with parents (and other co-resident adults if applicable) do not capture all aspects of potential family complexity. As stated by Brown et al. (2015), "[the] traditional approach to conceptualising children's living arrangement relies on a measure of family structure that captures children's relationship to the parental adult(s) in the household, ignoring children's relationships to siblings as well as family members outside the household" (p. 177). Thinking about sibling relationships, even for children living with two biological parents, these relationships may be less straightforward, with the possibility of step- and half-siblings also living in the household (Cancian, Meyer, & Cook, 2011). Sibling relationships are also explored in this chapter.
Of course, family structures are not always fixed, and over a period of years children may experience various types of complexity and associated transitions. Broadening our understanding of children's complex family relationships, as described above, can be extended to consider these relationships over time. How stable are children's relationships with others, especially in more complex families? There has been some research on the incidence of parental relationship transitions (separation or divorce, or re-partnering and step-parenting) using LSAC (Baxter et al., 2012; Maguire, 2011). In other Australian analyses, using HILDA, de Vaus and Gray (2004) examined children's experiences of different family forms over childhood. For example, for children born between 1984 and 1989, one in four had experienced a period of living without at least one of their birth parents by the age of 12 years. For a recent example that uses three waves of LSAC to analyse three-generation households see Pilkauskas and Martinson (2014).
With five waves of LSAC data, we have the opportunity to extend Australian research to build up a picture of household complexity experienced by Australian children. The LSAC data allow longitudinal analyses of complex family relationships, covering ages 0-1 year to 8-9 years for the B cohort, and 4-5 years to 12-13 years for the K cohort. This allows insights on children's experiences of transitions in and stability of family relationships across these years. Analysing complexity in this way will be done throughout the chapter; to explore children's experience of family complexity to be analysed both cross-sectionally and longitudinally.
A particular focus of research on complex families has been on exploring whether children growing up in such families experience poorer outcomes than other children (e.g., Magnuson & Berger, 2009). This research is complicated by the reality that complex families are often more financially disadvantaged than other families, and tend to vary on other characteristics such as ethnicity of families (see Brown et al., 2015; Furstenberg, 2014; Manning et al., 2014; McLanahan & Percheski, 2008). Links between family complexity and children's outcomes are not explored in this chapter, but an introduction to the possible implications for children is presented by exploring how the incidence of family complexity varies across a selection of parental characteristics.
Research questions
The main research questions addressed in this chapter are:
- To what extent do Australian children experience different forms of household complexity?
- How does the experience of household complexity change as children grow?
- How stable are more complex household relationships?
- How does the incidence of household complexity vary with selected parental characteristics?
These research questions are addressed throughout the report, with household complexity explored in three main sections. Section 3.3 examines parental relationships to the child, section 3.4 examines the presence of other non-parental adults in the household and section 3.5 examines the presence of siblings or of other children. A final section (section 3.6) summarises household complexity and explores how complexity varies by parental education, parents' childhood experiences of parental separation and ethnicity, to provide some initial insights into the extent to which household complexity is more apparent within certain demographic groups in the Australian context.
Given the depth of other data analysed here, this chapter does not differentiate households according to the gender of parents. When there is a clear gender pattern, this is noted in the text, rather than adding detail to the classifications. Further, no distinction is made between cohabiting and married couples, even though it is likely that cohabiting two-parent households are more unstable than married ones (Baxter et al., 2012; Weston & Qu, 2014).
3.2 Data and method
Analyses of the LSAC data were undertaken, using Waves 1 to 5 of both cohorts, to describe children's relationships with parents and others in the household of their primary carer ("the primary household") and, where applicable, the household of their other parent. For the purposes of these analyses, the primary household is the household in which children are enumerated in the main LSAC interview.2
The central data for this chapter come from information about household relationships, with each person's relationship within the primary household considered relative to the LSAC child.3 These data are particularly well suited for the analyses of children's experiences of complex households given that the child is the focal unit. Data collections often do not capture this detail, instead only capturing relationships of household members back to a key adult reference person, so concealing possible complexity of relationships between children and others in the household.
A key issue was the identification and reporting of parental relationships, to make a distinction between these relationships and the presence of other adults in a household who were not identified as parents. This was straightforward in households with two biological parents, as these parents were clearly the ones in the parental role. Any other adults present in these households were identified as non-parental co-resident adults. (Siblings of the child were not counted as other co-resident adults - they are captured in the presentation of sibling relationships in section 3.5.) In households comprising single parents and no other co-resident adults, relationships were likewise simple to classify, even though in a small number of cases the single parent was not a biological parent of the child.
To present information on parental relationships, adults in the household were counted as parents if they were identified as being a biological, step, adoptive or foster parent to the study child. Further, "parents" could include grandparents, other relatives or adults who were unrelated to the child if parent 1 reported that they had a parental role, such that they were assigned as either "Parent 1" or "Parent 2" of the child. A maximum of two parents were identified in each household. If an adult was present and not assigned as either Parent 1 or Parent 2, they were classified as being a non-parental co-resident adult.4
Information about parental relationships is extended to consider whether living arrangements for children include staying some nights with a parent who lives in another household, referred to as a parent living elsewhere (PLE). The number of nights children stayed with their PLE, as reported by the primary carer in the LSAC interview, was categorised as being "below regular care" (children staying 0-51 nights per year with their PLE), "regular care" (staying 52-127 nights with their PLE) and "shared or majority care" (staying 128 or more nights with their PLE).5 Below regular care reflects spending up to 13% of nights out of a year at the home of their PLE, regular care is 14-34% of nights, while shared or majority care involves spending 35% or more of nights at the home of their PLE.
Information about parental relationships with a PLE was expanded by examining PLE household information, as provided by PLE respondents in Waves 4 and 5. This information was only used for households in which children had at least regular care provided by the PLE. It was nevertheless missing for a number of children, for whom parental information about the PLE household is recorded as unknown.
The data were analysed in several different ways, with results for each cohort presented separately:
- Relationships at the time of each wave are presented, for the full sample at each wave for whom there was valid relationship information. The wave-specific sample weights were used to take account of non-response that might affect some households more than others. In some parts of the chapter, population weights were used to derive estimates of the number of children from the LSAC cohorts living with certain types of family complexity.6
- The full five waves of data were used together, for those with valid relationship data across five waves, to undertake some longitudinal analysis. This was done in three different ways:
- The across-wave data were aggregated to present how many of the five waves of children were living within each of the different household structures. The longitudinal survey weights were used.
- Information about household relationships at each wave, for each child, was put together to identify children's sequences of these relationships across waves. The different patterns of such sequences, across all children in each cohort, were identified and presented in sequence index plots (Brzinsky-Fay, Kohler, & Luniak, 2006). These plots are useful for identifying the different pathways children take, as (or if) their parents' relationships change over a number of years, or if there are other changes in household structure. For example, one child might be recorded as living with two biological parents at Waves 1 and 2, with a single parent at Waves 3 and 4 (following the parents' separation) and at Wave 5 be living in another two-parent family, including a non-biological parent (following the re-partnering of the single parent). All possible pathways, such as these, are presented through these analyses. These analyses were unweighted, as they were used to portray the experiences of children at the individual level.
- Transitions in household relationship categories across consecutive waves of LSAC were examined, to be able to see how stable relationships were across two waves, and for those with unstable patterns, to be able to describe the likely transitions. For these analyses, the longitudinal survey weights were used.
Longitudinal analyses were not undertaken for the analyses of children's living arrangements in the PLE household, given the relatively small sample size and very diverse arrangements observed in these households.
Statistical tests were not used to compare across groups, nor were confidence intervals calculated. However, where relative standard errors (RSEs) of presented statistics were greater than 25%, the estimates have been flagged.
3.3 Parental relationships
Parental relationships in the child's primary household - cross-sectional findings
The analysis of household relationships commences by focusing on parental relationships to children. This first subsection - the single household perspective - looks only at children's relationships to parents or parent figures living in the child's primary household. For most children, their primary household will be their only household, but children who have a parent living elsewhere may spend some time in that parent's household. This will be examined later in this section.
To report on children's living arrangements, typically children are described as living with two parents or a single parent, as is shown in Table 3.1. This information shows that the majority of children lived in households with two parents, although the proportion in this category declined as children grew and became more likely to live with single parents, reflecting the cumulative effects of relationship breakdown among parents.
The simplicity of this classification makes the description of changing household structures somewhat easy, but it conceals the diversity within these different households that are explored throughout this chapter. The main areas of diversity focused on with regard to parental relationships are:
- two-parent households that may include one or more parents who are not the biological parent of the child; and
- as noted above, children living with two parents or a single parent in their primary household who may also have a parent living elsewhere.
There may also be other adults living in the household who are not considered to be parents of the study child. This is explored in section 3.4.
| Child's parents or parent figures in child's primary household | 0-1 year (%) | 2-3 years (%) | 4-5 years (%) | 6-7 years (%) | 8-9 years (%) | 10-11 years (%) | 12-13 years (%) |
|---|---|---|---|---|---|---|---|
| B cohort | |||||||
| Two parents/ parent figures | 89.5 | 86.7 | 85.8 | 84.0 | 84.0 | ||
| Single parent/ parent figure | 10.5 | 13.3 | 14.2 | 16.0 | 16.0 | ||
| Total | 100.0 | 100.0 | 100.0 | 100.0 | 100.0 | ||
| No. of observations | 5,107 | 4,606 | 4,386 | 4,242 | 4,077 | ||
| K cohort | |||||||
| Two parents/ parent figures | 85.0 | 83.2 | 83.1 | 81.0 | 81.8 | ||
| Single parent/ parent figure | 15.0 | 16.8 | 16.9 | 19.0 | 18.2 | ||
| Total | 100.0 | 100.0 | 100.0 | 100.0 | 100.0 | ||
| No. of observations | 4,983 | 4,464 | 4,331 | 4,163 | 3,951 | ||
Notes: "Two parents" includes households with two parents or parent figures, including those both with two biological parents and those with either or both being non-biological but nevertheless identified as parents to the study child. This includes step-parents, adoptive parents, foster parents, grandparents, other relatives and unrelated adults. See Table 3.2. One-parent households may also include other adults who are not said to be a "parent" to the study child.
Table 3.2 shows an expanded classification of parent-child relationships (within the primary household). This table specifically shows information about how the parents or parent figures are related to the LSAC child. This information updates and extends that provided in an earlier analysis of these LSAC data by Maguire (2011).
Notes: # Relative Standard Error > 25%. Percentages may not total exactly 100.0% due to rounding.
- In their primary household, the vast majority of children lived with both their biological parents (i.e., a mother and a father), although this declined from 89% of children at age 0-1 year to 72% of children at age 12-13 years.
- As children grew, the likelihood that this primary household included one biological parent plus one other parent or parent figure progressively increased.
- This non-biological parent figure was usually identified as step-parent to the study child.
- In some households, there was a biological parent and an unrelated adult. This "unrelated adult" was usually the cohabiting (rather than married) partner to the biological parent (83% of cases).
- In an even smaller percentage of households, the non-biological parent was related to the child, most often being the child's grandparent.
- A very small percentage of children lived with two non-biological parents (less than 1% of children at each wave, within each cohort). This was similarly true of children living with only one non-biological parent. These households included those headed by adoptive parents, grandparents or other relatives, and foster parents.
- Most commonly, children's primary households included two biological parents. The next most common household structure within the primary household, in terms of the parental relationships identified in Table 3.2, was that of children living with a single (biological) parent. At age 0-1 year, 10% of children lived with one biological parent, and this increased as children grew, with 18% of the oldest children (the K cohort at 12-13 years) living with one biological parent.
There were some gendered patterns that were masked within the classifications used in Table 3.2.
- Most of the single parents in these LSAC data were single mothers. Combining the single parents across cohorts and waves, 97% were single mothers and 3% single fathers. Note that this predominance of single mothers to some extent reflects the LSAC study design, that means children are often enumerated in the household of their mother, even if they spend more of their time in their father's household (see footnote 2). These percentages therefore are not indicative of the gender balance of single parents in the population. For example, according to the Australian Bureau of Statistics (ABS) 2012-13 Family Characteristics Survey, of all children aged less than 15 years living with a single parent, 87% lived with a single mother and 13% with a single father.7
- Across the pooled data across waves and cohorts, of all the households comprising a biological parent and another parent figure, in 93% of cases, the child lived with their biological mother and another adult.
In section 3.4, the co-residence of adults other than those with a parental role is considered. This includes some grandparent co-residents, for example, as well as cohabiting partners who were reported by LSAC respondents to have no parental role with respect to the LSAC child (see footnote 4).
Parental relationships in the child's primary household - longitudinal findings
Table 3.2 showed that the majority of children, at each wave of LSAC, lived with two biological parents, but as children grew, they were more likely to live with a step-parent or with a single parent. The five waves of LSAC are now used to examine the stability of these parental relationships within the primary household. To do this, the relationships are classified broadly into that of living with two biological parents, living with "other two parents" (including one biological and one other parent or two non-biological parents) and living with a single parent (whether biological parent or not). The analyses are based on those children for whom there was valid parental relationship information across all five waves.
Table 3.3 shows that 93% of the B cohort children and 85% of the K cohort children were living with two biological parents in their primary household for at least one wave of LSAC. In fact, 73% of the B cohort and 69% of the K cohort had two co-residing biological parents at each of the five waves of LSAC. Consistent with Table 3.2, smaller percentages had spent any time (across waves) with "other two-parents", with very few spending four or five out of the five waves in this household form. Living at some time with a single parent was common (25% in the B cohort and 28% in the K cohort having lived with a single parent for at least one of the five waves). However, those who lived with a single parent at one or more waves were quite diverse, some having spent all five waves living with one parent, but more having done so for fewer waves.
As shown in Table 3.3, the majority of children in LSAC lived with both biological parents at all five waves. For all other children, Figure 3.1 provides a visual representation of the different parental relationship sequences experienced across the waves of LSAC. The figure shows all sequences of parental relationship that occurred within the LSAC sample, focusing on children in all five waves, excluding those children who lived with two biological parents at each wave. The transition from living with two biological parents into other household structures is apparent in this figure, with children having often transitioned first to living with a single parent and then to living with "other two parents", which generally comprises a biological parent plus one other adult, such as a step-parent.
Of the 3,753 B-cohort children present for all waves, at some time across the five waves:
- 496 children (13%) changed from living with two biological parents to living with a single parent; and
- 179 (5%) changed from living with a single parent to living with two parents where one or both were not the biological parent.
For the 3,689 K-cohort children in all waves, at some time across the five waves:
- 439 (12%) changed from living with two biological parents to living with a single parent; and
- 267 (7%) changed from living with a single parent to living with two parents where one or both were not the biological parent.
Notes: These data are from households responding to all waves of LSAC. N = 3,753 for B cohort and 3,678 for K cohort. Single parents include single parent figures. # Relative Standard Error > 25%. Percentages may not total exactly 100.0% due to rounding
Figure 3.1: Selected sequences of parental relationships in the primary household across five waves of LSAC
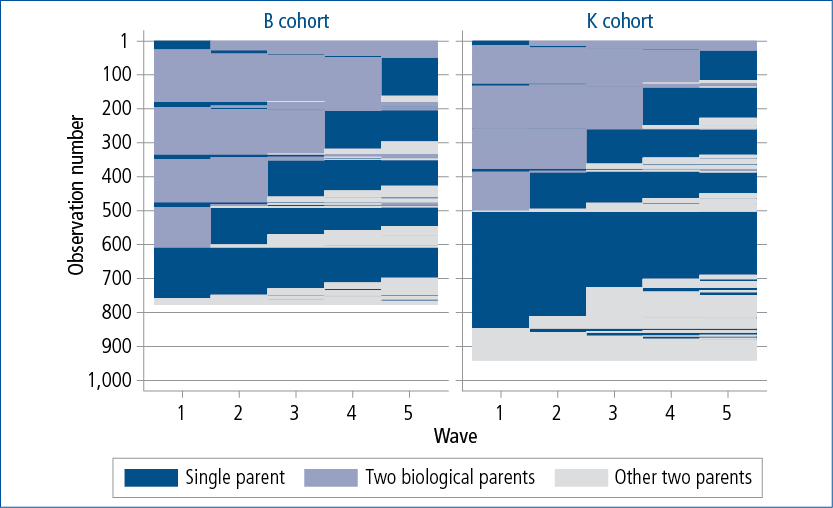
Notes: These data are not weighted, since they are based on the sequences of individual observations within the balanced panel (households responding to all waves of LSAC: n = 3,753 for B cohort and 3,678 for K cohort). The figure does not include children who lived with both biological parents at all five waves, leaving the transitions shown for the subsamples comprising n = 776 for B cohort and 940 for K cohort. "Other two parents" is predominantly biological parent plus one other adult, with the other adult most commonly being a step-parent (as seen in Table 3.2).
Parental relationship transitions within the primary household can also be considered by exploring transitions between consecutive waves of LSAC, as shown in Figure 3.2. To do this, relationship at "time 2" is disaggregated for each relationship category at "time 1", covering transitions from Wave 1 to 2, Wave 2 to 3, Wave 3 to 4 and Wave 4 to 5. All these transitions are pooled in Figure 3.2. Findings were similar for each cohort:
- Usually children remained living in households with parents whose relationship category did not change across two waves, and this was most apparent for children living with two biological parents, for whom 95-96% of those living with two biological parents at one wave were still living with those parents at the subsequent wave. For the minority of children whose family relationships changed, almost all were living with a single parent at the subsequent wave.
- There was also considerable stability for those living in an "other two parent family", with 81-86% of those in this household form in one wave, being so again in the subsequent wave.
- Even among children living with a single parent at one wave, 77-81% were living with a single parent at the next wave. In the B cohort there was some evidence of families newly forming or re-forming across waves, as 9% of children who had been living with a single parent were living with two biological parents at the subsequent wave. This was less common for the older (K cohort) children. For both cohorts, 14-16% had transitioned to another two-parent family, which generally reflected the single parent having a new partner.
Figure 3.2: Parental relationship transitions within the primary household, by cohort
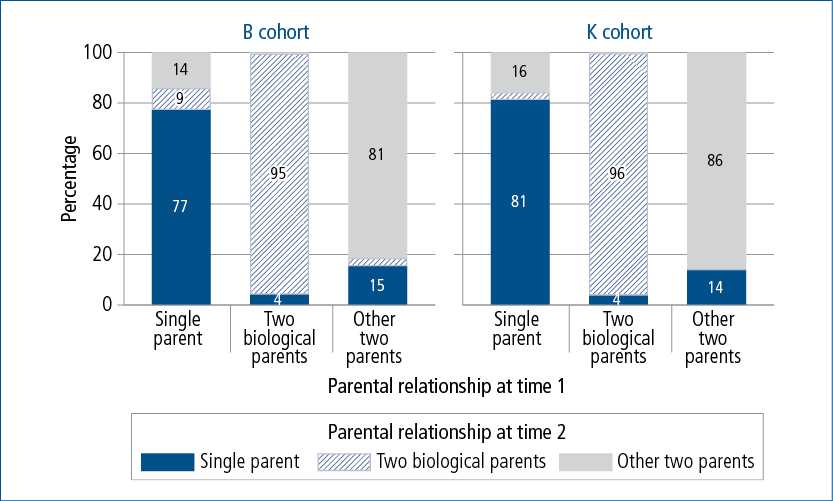
Notes: These data are from households responding to all waves of LSAC (n = 3,753 for B cohort and 3,678 for K cohort), but each cross-wave transition counted separately, giving a final n = 15,012 for the B cohort and n = 14,712 for the K cohort for this figure. "Other two parents" is predominantly biological parent plus one other adult, with the other adult most commonly being a step-parent (as seen in Table 3.2).
Children with parents in two households
The above analysis focused only on the child's primary household, which for this analysis is the household in which they are enumerated for the main interview of LSAC. This single household perspective provides a somewhat simplistic view of children's living arrangements for those who also have a parent living elsewhere (PLE), in another household, with whom they live some of the time.
This section starts by exploring to what extent children stay some nights during the year with a PLE. This is commonly used to classify children's care arrangements, as it is relevant in considering child support eligibility (see footnote 5), although it clearly does not provide a full picture of the possible diversity of experiences among children in their involvement with their PLE. The number of nights children stay with their other parent (as reported by Parent 1 in the primary household) was used to classify applicable children's care arrangements as being "below regular care" (0-51 nights per year with a PLE), "regular care" (52-127 nights per year with a PLE) and "shared or majority care" (128 or more nights per year with a PLE).8 These groups are shown by cohort and wave for children with a PLE in Table 3.4. Children without a PLE are also shown in the table, according to whether they live in a two-parent or one-parent family. For this section, the question of whether children with a PLE live in a single- or two-parent family in either household is set aside. This is explored in the next subsection.
| Children's parents or parent figures in the primary household and PLE care arrangements | 0-1 year (%) | 2-3 years (%) | 4-5 years (%) | 6-7 years (%) | 8-9 years (%) | 10-11 years (%) | 12-13 years (%) |
|---|---|---|---|---|---|---|---|
| B cohort | |||||||
| Two biological parents only (no PLE) | 88.9 | 85.7 | 82.8 | 78.4 | 76.5 | ||
| One biological parent only (no PLE) | 0.3# | 0.7 | 0.8 | 1.0 | 0.9 | ||
| Other, no PLE | 0.2# | 0.3# | 0.4# | 0.7 | 0.6 | ||
| One or two parents, child has PLE | 10.7 | 13.4 | 16.0 | 19.9 | 22.0 | ||
| PLE care = below regular care | 9.2 | 9.5 | 10.0 | 11.8 | 12.1 | ||
| PLE care = regular care | 1.0 | 3.1 | 5.1 | 6.5 | 7.0 | ||
| PLE care = shared or majority care | 0.2# | 0.6 | 0.8 | 1.6 | 3.0 | ||
| Total | 100.0 | 100.0 | 100.0 | 100.0 | 100.0 | ||
| No. of observations | 5,107 | 4,606 | 4,386 | 4,242 | 4,077 | ||
| K cohort | |||||||
| Two biological parents only (no PLE) | 81.7 | 79.0 | 75.8 | 71.9 | 72.1 | ||
| One biological parent only (no PLE) | 0.5 | 1.6 | 1.5 | 1.7 | 1.8 | ||
| Other, no PLE | 0.5 | 0.7 | 0.9 | 1.3 | 1.2 | ||
| One or two parents, child has PLE | 17.3 | 18.8 | 21.8 | 25.1 | 25.0 | ||
| PLE care = below regular care | 11.0 | 10.9 | 12.6 | 14.9 | 15.0 | ||
| PLE care = regular care | 5.3 | 6.4 | 7.0 | 7.6 | 7.5 | ||
| PLE care = shared or majority care | 0.8 | 1.3 | 1.9 | 2.6 | 2.5 | ||
| Total | 100.0 | 100.0 | 100.0 | 100.0 | 100.0 | ||
| No. of observations | 4,983 | 4,464 | 4,331 | 4,163 | 3,951 | ||
Notes: "Other, no PLE" is predominantly two-parent families including a non-biological parent, but includes a small number of single parents who are not biological parents. # Relative Standard Error > 25%. For a small number of children with a PLE, care arrangement information was missing (not shown in table). Percentages may not total exactly 100.0% due to rounding.
Before examining these data, it is worth noting how the PLEs are related to the study child. Across the waves, within each cohort, 99% of PLEs were biological parents, the remainder being step-parents, foster parents, grandparents and others. Most PLEs were biological fathers (overall, 95% were biological fathers and 6% were biological mothers). However, as children grew, it became more common for the PLE to be the biological mother (and for the child to be living with the biological father in the LSAC primary household). Within the B cohort, at age 0-1 year 2% of PLEs were biological mothers and by 8-9 years this had increased to 6%. Within the K cohort, at 4-5 years 5% of PLEs were biological mothers and this had increased to 10% of PLEs at 12-13 years. (See also footnote 2.)
Looking now at Table 3.4, in the B cohort, the percentage of children with a PLE increased from 11% of 0-1 year olds to 22% of 8-9 year olds. Similarly, in the K cohort, the percentage increased from 17% of 4-5 year olds to 25% of 12-13 year olds.
At each wave, for both cohorts, it was most common for children with a PLE to have a care arrangement classified as "below regular care", which includes those children with no contact with a PLE, who only see this parent during the day-time or who stay overnight with them less frequently than approximately once a week. For the 0-1 year old children, this represented 9% of all children. For the 12-13 year olds, it represented 15% of all children. The percentages in "regular care" were low at the youngest ages (1% of children aged 0-1 year), increasing to between 7 and 8% from ages 8-9 years through to 12-13 years. The lowest percentage of children was in shared or majority care, which was the situation for 2.5% of the 12-13 year olds.
The percentages with different care arrangements are small, given that the majority of children live with both biological parents. However, when these data are used to estimate the number of children across Australia with these different care arrangements, the numbers are nevertheless significant, as is shown in Table 3.5. For example, of children born between March 1999 and February 2000, an estimated 6,600 children at 10-11 years and 6,300 children at 12-13 years spent significant amounts of time with each of their parents, having a care arrangement classified as shared or majority care.
These estimates show that just as the number and percentage of children with a PLE is progressively higher at each child age (except for between 10-11 and 12-13 years), there are generally increases in each of the different care arrangements.
Notes: a Estimates refer to children born within a one-year time frame, excluding children in remote areas of Australia. For the B cohort, the time frame is between March 2003 and February 2004 and for the K cohort it is between March 1999 and February 2000. Given these time frames, the exact age of children at each survey spanned two possible years of age. b Care arrangements were unknown for a small number of observations (n = 50 across cohorts and waves). They were excluded in Table 3.4, but have been included in the total estimate of children with PLE here. # Relative Standard Error > 25%. For a small number of children with a PLE, care arrangement information was missing (not shown in table).
If we analyse children's care arrangements across waves of LSAC, after the cross-wave sequence of remaining with two biological parents (87% of children experienced this at some time), the next most common sequence as captured with this variable is that of remaining with below-regular contact with a PLE (11% of children experienced this at some time). Beyond this, there was much diversity in children's experiences of changing care arrangements, and so we have not explored these patterns using sequence plots. We focus instead on analysing children's possible transitions across waves (Wave 1 to 2, 2 to 3, 3 to 4, or 4 to 5), shown in Figure 3.3. The transitions are shown as children's care arrangements at one wave ("time 2"), according to their care arrangements the previous wave ("time 1").
Of particular interest is what children's care arrangements are like when they transition from a two-parent biological family to having a PLE; that is, soon after a parental relationship separation. In both the B and K cohorts, among those living with two parents at one wave, approximately 5% were not living with two parents at the next wave. The care arrangements these children entered were diverse, but similar percentages transitioned into "below regular care" and "regular care" (just under 2% of those previously in a two-parent family went into each of these, within each cohort), with smaller percentages transitioning into "shared or majority care".
For children with a PLE at one wave of LSAC, 74% still had a PLE at the following wave and had not changed their care arrangements. As seen in Figure 3.3, children in below regular care by their PLE were especially likely to be in that same category two years later (77% for the B cohort and 84% for the K cohort). This figure shows that among those who continued to have a PLE across waves, but had changes in care arrangements, those changes were varied with some involving children reducing their time with their PLE from one wave to the next and some increasing their time with their PLE.
Figure 3.3: Parental relationship and care transitions across five waves of LSAC
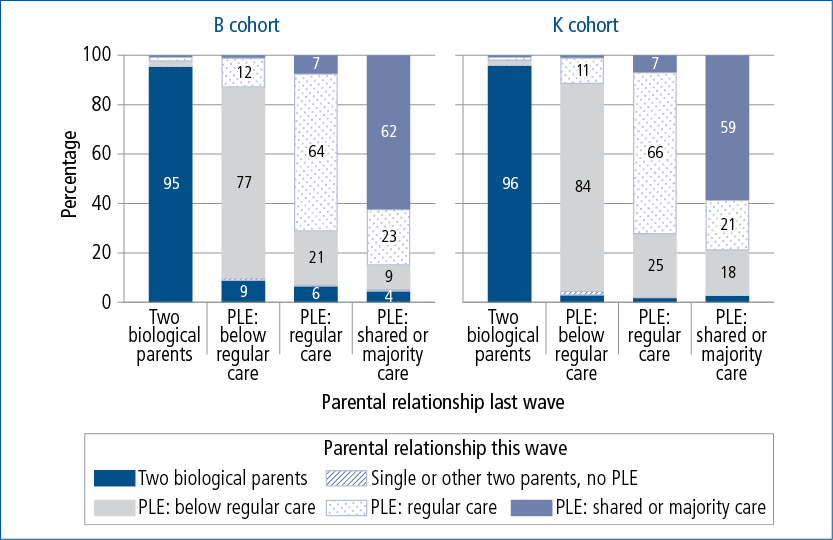
Notes: These data are from households with valid relationship and care data at all waves, with each cross-wave transition counted separately (n = 14,960 for the B cohort, n = 14,656 for the K cohort). PLE = parent living elsewhere. Transitions from "single or other two parent, no PLE" are not shown as they occur only for a small number of households.
Children's living arrangements when they have parents in two households
Children's care arrangements with a PLE were explored above to begin the expansion of the description of children's household forms, to take account of both parents' households. This is extended in this subsection, only for those children who have at least regular care by a PLE. This focus is partly because children who spend little (or no) time with a PLE are not very much or at all exposed to that parents' household, so the PLE household composition is less relevant as a descriptor of children's usual living arrangements. Also, a focus on children who have at least regular care by a PLE is necessary for pragmatic reasons, as (using LSAC) we know little about the characteristics of the household of PLEs when the child has little contact with them. It is important to acknowledge, though, that these analyses have a limitation in that children's involvement with their PLE (and exposure to that household) may not always be reflected in the number of overnight stays, which is the basis of the categories of care used here.
This information is sourced from the PLE respondent in LSAC, using information about the PLE's household that has been collected in LSAC from Wave 4.9 PLE households are classified here as single parent, two parent or relationship unknown. The latter category refers to households for whom the PLE was not a respondent to LSAC.
Table 3.6 puts together information about the child's primary household as well as the PLE household if children have at least regular care by the PLE, focusing on households in which children have a PLE. Population estimates are provided as well as percentages, which are calculated over the total of households in which children have a PLE.
Notes: Children with a PLE with missing information about contact are included with those in "below regular care". # Relative Standard Error > 25%. Percentages may not total 100.0% exactly due to rounding. a For the B cohort, the estimated number of children refers to those born between March 2003 and February 2004 and for the K cohort refers to those born between March 1999 and February 2000, excluding children in remote areas of Australia.
Looking at the percentages, after the categories of children who have below regular care by a PLE, the next most common one is of children living with a single parent in their primary household, and having a PLE who is also a single parent. Children at all ages were represented by a range of situations in these data. No particularly strong patterns by child age emerged.
Summary: Parental relationships
The majority of Australian children aged up to 12-13 years live with two biological parents, as was evident in the cross-sectional data, and also evident in the considerable stability of these relationships across waves of LSAC. As such, most LSAC children have only been classified as living with two biological parents across the five waves of LSAC.
However, the study captured children who were living in a single-parent household from Wave 1, as well as those children whose parents separated over the course of the study. Also, there were children living in households that comprised step-parents or other adults with a parental role to the children, such as grandparents. Overall, though, a very small minority of children at any of the waves of LSAC lived in a primary household that did not include at least one of their biological parents.
The analyses of parental relationship transitions showed stability in parental relationships, even within households that comprised a single parent or other two parents, although these living arrangements were more unstable than in households of two biological parents. Some changes that occurred for children with single parents involved the addition of a parent or parent figure to their primary household: either through their other biological parent coming to live (or return) to the household, or through a single parent beginning a new relationship.
For children with a parent living elsewhere, there is much diversity within LSAC in the nature of care arrangements with their parent living elsewhere. Further, care arrangements are often not stable, such that we observed changes across waves in children's patterns of care (as classified by the number of nights stayed with PLE). The population estimates for family relationships for children with a parent living elsewhere highlight that there are many thousands of children across Australia in varied and possibly quite complex across-household family relationships.
3.4 Other adults co-resident with the LSAC study child
In this section, information on the co-residence of adults other than parents or parent figures is presented, to provide some more insights on the potential complexity in children's lives. The section primarily examines these relationships in children's primary household, but we discuss the PLE households at the conclusion of the section. We identify these co-resident adults in terms of whether they were a grandparent, another related adult (not counting siblings) or an unrelated adult. Note that if an unrelated adult was a boyfriend or partner to the primary carer, in most cases this person was reported to be "Parent 2" by the primary carer, and we have not included them in estimates of unrelated adults here. That is, most of the unrelated adults are boarders or have some other unspecified relationship with others in the household.
Table 3.7 shows the percentage of children with co-resident adults who are not parent figures. Overall, across the cohorts and waves, around 8-10% of children had a non-parental adult in their household. The co-presence of other adults does not appear to be very strongly linked with ages of children, although there is some indication of grandparents and other relatives being more often co-resident for the youngest children.
The co-presence of other adults varied considerably according to whether children were living with a single parent or two parents in their primary household, as shown in Table 3.8, with co-resident adults much more likely for children residing with a single parent, especially at the youngest ages of LSAC children. For 0-1 year olds with a single parent, 37% had a co-resident other adult, which included 24% living with a grandparent and 20% another adult relative. (Some lived in households with grandparents as well as other adult relatives.) Another 7% of these single-parent households included an unrelated adult. Within single-parent households, children were less likely to have co-resident adults (especially grandparents or other relatives) beyond the youngest ages.
Note: See Table 3.10 for sibling relationships.
Notes: See Table 3.10 for sibling relationships.
Within two-parent households, the percentage that included non-parental co-resident adults is between 6 and 7%, with grandparents being the most common co-resident. There were no strong patterns by age of child.
Using the longitudinal data, Table 3.9 shows that about 22% of the B-cohort and the K-cohort children had a non-parental other adult living with them for at least one of the waves of LSAC. This was most often a grandparent, followed by another relative, and then an unrelated adult. It was most common, in each case, for children to have had this other adult co-resident for only one of the LSAC waves, and rare for them to have been present for all five waves.
Notes: These data are from households responding to all waves of LSAC. N = 3,753 for the B cohort and 3,678 for the K cohort. #Relative Standard Error > 25%.
This is also illustrated in Figure 3.4, which shows all sequences within the LSAC data of children's experiences of having non-parental adults present in the household. Grandparents are combined with other relatives in these analyses. In this figure, children who lived only with parents (or parent figures) across all five waves are not shown. More than half of the sequences shown involve children experiencing only one wave of a non-parental co-resident adult, who was more likely to be a relative than an unrelated adult. This seems to occur at any of the five waves, although in the B cohort a higher percentage had a co-resident adult (especially grandparent or other relative) present only in Wave 1 or in Wave 2, consistent with the percentages being higher for the co-residence of these other adults at these waves. There were also many children with more diverse situations, especially those represented toward the bottom of the figure, in which children spent more of the five waves with another co-resident adult.
Figure 3.4: Selected sequences of non-parental adult co-residence in the primary household across five waves of LSAC
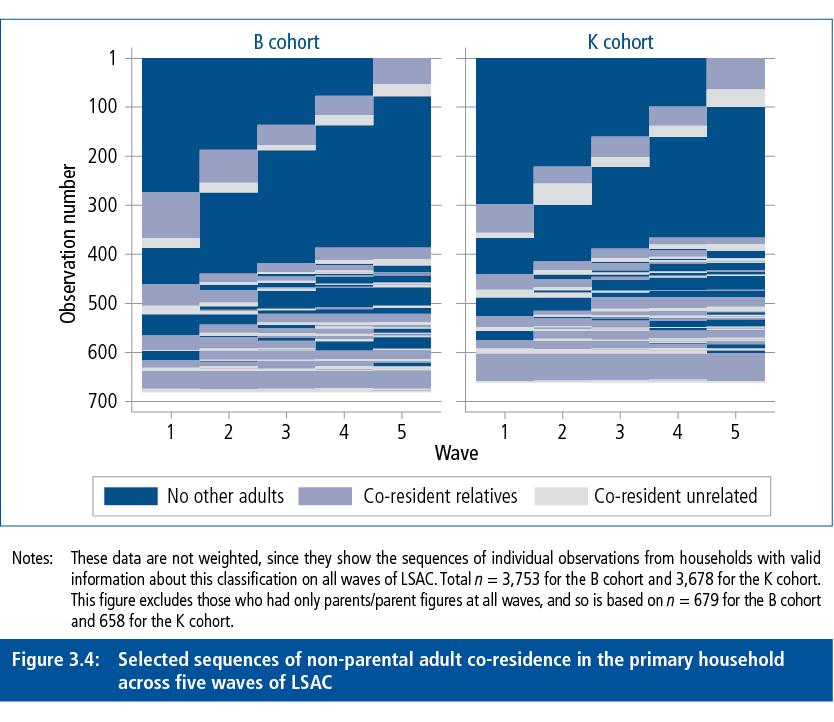
Notes: These data are not weighted, since they show the sequences of individual observations from households with valid information about this classification on all waves of LSAC. Total n = 3,753 for the B cohort and 3,678 for the K cohort. This figure excludes those who had only parents/parent figures at all waves, and so is based on n = 679 for the B cohort and 658 for the K cohort.
Children who live part of the time with a PLE may also be exposed to other co-resident adults in those households. Analyses of PLE households for children in at least regular care (in Waves 4 and 5, with PLE respondents) revealed percentages with co-resident adults in a similar range to those living with single parents within the primary household. For example, for the B cohort, 19% at Wave 4 and at Wave 5 had a non-parental co-resident adult (such as a grandparent) present in the PLE household. For the K cohort, 17% at Wave 4 and 11% at Wave 5 had a non-parental co-resident adult present in the PLE household. The comparable figures for this same population within the primary household were, for the B cohort, 15% at Wave 4 and 13% at Wave 5 and for the K cohort, 9% at Wave 4 and 5% at Wave 5. While sample sizes preclude detailed examination of these multiple relationships within and across households, they illustrate the high degree of multiple relationships that make up some children's lives.
To summarise, within the primary household, the majority of children did not experience the co-residence of adults other than their own parents. However, children (especially young children) living with single parents quite often were living in a household where another adult, particularly a grandparent or another adult relative, was also living.
These data on the co-presence of other adults highlight that families or households can encompass more than parents and siblings, although our focus on the co-residence of other adults only in numerical terms does not provide insights on what this actually means for the children. For some children and families, this co-presence may be particularly valuable, where it means improved financial circumstances or access to a broader social network. In particular, the co-residence of others for single parents with young children may be a strategy employed to get through a potentially challenging time for new mothers (see Chapter 2 of this volume). At other times, and perhaps indicated in these data by the more sporadic nature of co-residence, it may reflect a short-term situation, that nevertheless provides opportunities for the development of relationships between children and others. Of course, the transient nature of co-residence in some families may be challenging for children, if changes in co-residence are accompanied by changes in family routines, relationships and responsibilities, or if it creates risks in terms of parental capacity to supervise and monitor children.
Taking this further, it would be necessary to have more information about the reasons for co-presence, and also, to have information on whether the LSAC child and parent/s lived in their own home or in the home of the other adult. US research has shown that this is a key distinction in understanding the heterogeneity of families that include a co-resident adult (Dunifon et al., 2014). This information is not collected in LSAC, making it difficult to fully explore the nature of this form of household complexity.
3.5 Siblings and other co-resident children
The final aspect of household composition that is considered in this chapter is that of the co-presence of other children, exploring to what extent children live with others who are full siblings, step or half siblings, or other children. While normative, the presence of siblings in a household no doubt matters to the way in which families function (see Kowaleski-Jones & Dunifon, 2004). From the perspective of children, whether co-resident siblings are full siblings, or half- or step-siblings, adds another dimension to the complexity of their household (Gennetian, 2005).
This analysis is only presented for children's primary household. Information about siblings of all ages is included here, although initially shown separately for siblings who are younger than (or the same age as) the study child and those who are older. Siblings are considered in terms of whether they are "full" siblings to the LSAC child, that is, both share the same biological mother and father; a "half" sibling (they share one of either the mother or the father); or a "step" sibling (they are not biologically related, but the parent of one is (or has in the past been) in a relationship with the parent of the other). A very small number of "other" siblings, who are those related to the LSAC child through adoption or fostering, are grouped with half- and step-siblings. They were too few in number to examine separately. Likewise, a very small proportion of children had other children aged less than 15 years in their household who were not siblings. For example, this includes co-resident cousins. Only 1-2% of children, across ages, had non-sibling children present, and these figures are not discussed throughout this chapter.
Table 3.10 shows that from about 4-5 years through to 12-13 years, almost nine out of ten children had a sibling in their household. The percentages were lower at 0-1 year (61%) and 2-3 years (80%), reflecting that some of these children were first-born children and yet to have siblings born into the family. In fact, children were most likely to gain new siblings when they were between these ages and then, to a lesser extent, between 2-3 and 4-5 years, as indicated by changes in the percentage with young siblings. Beyond 4-5 years, children without younger siblings often remained with no younger siblings at older ages.
Notes: Children may have younger (or same aged) as well as older siblings; they may have full siblings as well as half- or step-siblings. The total "half- or step-siblings" includes a very small number with "other siblings", such as foster or adopted siblings. "Other children" includes relatives (e.g., cousins) and unrelated children. # Relative Standard Error > 25%.
Just less than 60% of children had at least one older sibling in the home, across almost all the ages of children shown here. This percentage declined at older ages of children, with 56% of children at 10-11 and 53% at 12-13 having older siblings in the home. No doubt this reflects some children's older siblings leaving home.
Most siblings of LSAC children were full siblings, rather than half- or step-siblings, and the variation by child age in the percentage with siblings largely represented variation in the percentage with full siblings, as the percentage with other siblings was generally between 10 and 12% across all ages. The vast majority of siblings who were not full siblings were half-siblings.
Children's likelihood of having different types of co-resident siblings varied considerably according to whether children lived with two biological parents, "other two parents" or a single parent (Table 3.11). Not surprisingly, children were least likely to have half- or step-siblings living with them in two biological parent households, and it was in these households that the vast majority of children lived with siblings, usually full siblings. Nevertheless, even with these households, there was a number with more complex sibling relationships. For example, at 0-1 year and 2-3 years, around 8% of children lived with half- or step-siblings.
| Percentage with siblings, by child's parental relationships | 0-1 year (%) | 2-3 years (%) | 4-5 years (%) | 6-7 years (%) | 8-9 years (%) | 10-11 years (%) | 12-13 years (%) |
|---|---|---|---|---|---|---|---|
| B cohort | |||||||
| Two biological parents | |||||||
| Has siblings of any age | 61.7 | 82.7 | 91.9 | 94.0 | 94.2 | ||
| Full siblings | 57.0 | 80.0 | 89.8 | 92.3 | 92.7 | ||
| Half- or step-siblings | 8.3 | 7.8 | 6.9 | 6.5 | 5.0 | ||
| Half-siblings | 8.1 | 7.7 | 6.7 | 6.1 | 4.5 | ||
| Step-siblings | 0.1# | 0.1# | 0.1# | 0.2# | 0.6# | ||
| No siblings of any age | 38.3 | 17.3 | 8.1 | 6.0 | 5.8 | ||
| Other two parents | |||||||
| Has siblings of any age | 20.4 | 56.2 | 79.8 | 83.9 | 84.5 | ||
| Full siblings | 10.2 | 34.9 | 49.5 | 60.2 | 61.0 | ||
| Half- or step-siblings | 16.9# | 33.0 | 50.9 | 50.8 | 49.7 | ||
| Half-siblings | 3.3# | 21.4# | 44.8 | 44.8 | 41.4 | ||
| Step-siblings | – | 5.5# | 8.3# | 8.8 | 10.2 | ||
| No siblings of any age | 79.6 | 43.8 | 20.2 | 16.1 | 15.5 | ||
| Single parent | |||||||
| Has siblings of any age | 56.6 | 65.5 | 71.6 | 75.5 | 78.8 | ||
| Full siblings | 37.1 | 53.4 | 59.6 | 64.7 | 69.3 | ||
| Half- or step-siblings | 24.8 | 20.1 | 22.4 | 18.1 | 18.6 | ||
| Half-siblings | 24.4 | 19.5 | 22.2 | 18.1 | 17.4 | ||
| Step-siblings | – | – | – | 0.1# | 2.2# | ||
| No siblings of any age | 43.4 | 34.5 | 28.4 | 24.5 | 21.2 | ||
| No. of observations | 5,107 | 4,606 | 4,252 | 4,241 | 4,075 | ||
| K cohort | |||||||
| Two biological parents | |||||||
| Has siblings of any age | 92.1 | 93.7 | 94.5 | 94.4 | 93.6 | ||
| Full siblings | 89.2 | 91.3 | 92.2 | 92.7 | 92.1 | ||
| Half- or step-siblings | 8.2 | 7.5 | 6.7 | 4.7 | 3.7 | ||
| Half-siblings | 8.0 | 7.3 | 6.4 | 4.5 | 3.0 | ||
| Step-siblings | 0.0# | 0.0# | 0.0# | 0.1# | 0.6# | ||
| No siblings of any age | 7.9 | 6.3 | 5.5 | 5.6 | 6.4 | ||
| Other two parents | |||||||
| Has siblings of any age | 66.6 | 76.9 | 81.6 | 85.3 | 86.5 | ||
| Full siblings | 37.7 | 46.5 | 59.7 | 63.4 | 65.3 | ||
| Half- or step-siblings | 50.4 | 53.9 | 50.9 | 53.0 | 52.0 | ||
| Half-siblings | 44.6 | 46.3 | 42.4 | 40.8 | 40.8 | ||
| Step-siblings | 4.2# | 8.8# | 10.3 | 13.8 | 14.4 | ||
| No siblings of any age | 33.4 | 23.1 | 18.4 | 14.7 | 13.5 | ||
| Single parent | |||||||
| Has siblings of any age | 73.7 | 78.3 | 81.8 | 82.8 | 79.0 | ||
| Full siblings | 63.7 | 69.6 | 72.8 | 73.0 | 72.3 | ||
| Half- or step-siblings | 21.7 | 19.3 | 19.6 | 21.2 | 16.1 | ||
| Half-siblings | 21.3 | 18.6 | 19.2 | 19.7 | 14.9 | ||
| Step-siblings | – | 0.6# | 0.1# | 1.1# | 1.0# | ||
| No siblings of any age | 26.3 | 21.7 | 18.2 | 17.2 | 21.0 | ||
| No. of observations | 4,983 | 4,464 | 4,196 | 4,159 | 3,946 | ||
If living with "other two parents", a high percentage of children lived with half-, step- or other siblings. Under 4-5 years of age this was lower (17% at age 0-1 year and 33% at 2-3 years), but beyond this, just over half of these children had at least one half-, step- or other sibling. The percentage with a half-sibling was quite high from age 4-5 years up, but also, as children grew they were increasingly likely to be living with step-siblings within these sorts of two-parent households.
Compared to children living with two biological parents, higher percentages living with single parents had half- or step-siblings. Still, many children in these households had full siblings, and this percentage increased with child age. This increase likely reflects the effects of parental separation, with many older children living in these households likely to have previously lived with two biological parents, with siblings from that relationship. In contrast, earlier analyses of LSAC data by Baxter et al. (2012) showed that among the youngest children living with a single parent, there is a relatively high proportion who have never lived with their father. As a consequence, these children are less likely to have ever had full siblings.
Viewing these data through a longitudinal lens generally captures the addition of new siblings to the household as children grow. The sequences of sibling presence are summarised for children in five waves of LSAC, by classifying children as having no siblings, having only full siblings, having only half- or step-siblings, or having a blend of full and half- or step-siblings. We exclude, however, children who had full siblings at all five waves, to focus on the more diverse or changing sibling relationships. The top of Figure 3.5 shows those children who had no siblings across the five waves (6% of the B cohort and 8% of the K cohort, see also the summary in Table 3.12) and those transitioning from no siblings to having at least one sibling at some wave. Most children who transitioned from having no siblings experienced the addition to their household of full siblings, reflecting the birth of new siblings. There is some evidence of additions to the more complex households, as children grew, with the percentage of children with blended sibling relationships increasing across the waves of LSAC. This reflected some children gaining full siblings, from starting out with just half- or step-siblings, as new siblings were born to the LSAC child's (two biological) parents. It also reflected children gaining half- or step-siblings, from starting out with just full siblings, so likely reflecting a new parental relationship that entails new children joining the LSAC child's household. There is evidence in these sequences also, of some children transitioning back to having only full siblings from having been in a household with a blend of full and half- or step-siblings. This may reflect some older children having left home or the breakdown of a parental relationship that involved a step-parent and his (or her) children leaving the LSAC household.
Figure 3.5: Selected sequences of sibling co-residence across five waves of LSAC
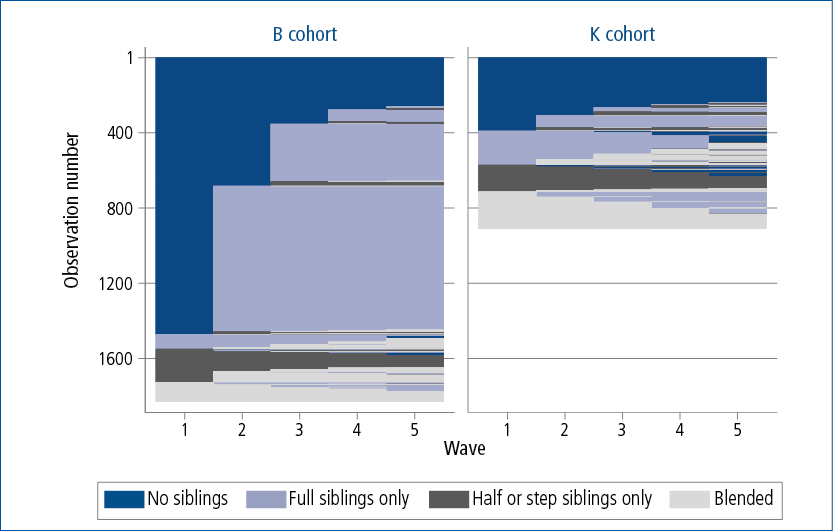
Notes: These data are not weighted, since they show the sequences of individual observations from households with valid information about this classification on all waves of LSAC. This figure excludes those with only full siblings at all five waves and so is based on n = 1,830 for the B cohort and n = 909 for the K cohort. "Blended" are children who have full siblings and half- or step-siblings in the household. Siblings of all ages are included.
Previously in this chapter the more complex family situations of children with regular care by a PLE has been explored. This has not been done here in relation to the co-residence of siblings, given the additional complexities of identifying whether siblings in the PLE household live there full-time, or like the LSAC study child, live there part-time through care arrangements. Some children may actually be double-counted if they are counted in the LSAC household as well as the PLE household, if siblings' care arrangements are the same as (or similar to) those of the LSAC study child. (See Baxter et al., 2012 for some analyses of earlier LSAC data for some description of the presence of siblings across households.)
In summary, most Australian children grow up with at least one sibling, with the majority having siblings that they are biologically related to through both their mother and father. This, of course, reflects that the majority of children grow up, at least until age 12-13 years, living with both biological parents. It was quite uncommon for children up to 12-13 years to be living with a step-sibling, which also reflects that only a small proportion of children lived with a step-parent across the five waves of LSAC. However, having a half-sibling was considerably more common than having a step-sibling, and even within two biological parent households, half-siblings were sometimes present, especially for younger children. Children often lived with half-siblings when they were living in "complex" household structures (those that did not involve two biological parents).
The presence of siblings, no doubt, matters to family routines, and these siblings form part of the network of family relationships. Taking account of their presence and relationships to the study child provides more context to family life than is gained by looking only at a child's relationships to his or her parents or parent figures (see Gennetian, 2005; Kowaleski-Jones & Dunifon, 2004).
Notes: These data are from households responding to all waves of LSAC. N = 3,753 for the B cohort and 3,678 for the K cohort. The total "half- or step-siblings" includes a very small number with "other siblings", such as foster or adopted siblings.
# Relative Standard Error > 25%.
3.6 Overview of complexity and where it is found
This section ties the above analyses together to first describe children's overall likelihood of experiencing household complexity across the five waves of LSAC. To do this, some broad indicators of complexity have been used, with the focus entirely on complexity within the primary household, without taking account of PLE households. This simplification of course means that the analyses cannot fully capture the diversity of household structures that have been described in the analyses above. However, they provide some overall summary measures that can then be used to compare across demographic groups to see whether experiences of household complexity are more likely for some children than others. A similar approach was taken by Manning et al. (2014) to identify children as having parent and/or sibling complexity.
First, a summary of household complexity is shown in Table 3.13, which gives the percentage of children at each wave who experienced each of the following.
- "Parental complexity" captures children living with a single parent or in an "other" (not two-biological parent) two-parent household.
- "Other adult complexity" captures children whose household included non-parental co-resident adults.
- "Sibling complexity" captures children who lived with half- or step-siblings in their primary household.
- "Household complexity" is having a primary household that is characterised by any of these different forms of complexity.
The percentage who experienced any of these, by cohort and wave, is shown in Table 3.13. The percentage experiencing household complexity was lowest, at 24%, for the 0-1 year olds at Wave 1 in the B cohort, and increased across ages of children, up to 36% of the 12-13 year olds at Wave 5 in the K cohort. These increasing percentages reflected the increased likelihood of children living in a household that includes parents other than two biological parents. Other forms of household complexity do not have such a strong trend by child age.
From those children in five waves of LSAC, Table 3.13 also presents the percentage of children who experienced each or any of these forms of complexity at any time over the five waves. These data that take a longitudinal perspective highlight the prevalence of household complexity across childhood. Overall, 43% of the B-cohort and 46% of the K-cohort children experienced at least one of these forms of complexity at one or more time across the five waves. Most commonly, this was having lived with a single parent or with "other two parents" (one or both being not a biological parent) at some time (27% of the B cohort and 31% of the K cohort), although more than one in five in each cohort (23% in the B cohort and 22% in the K cohort) lived with non-parental adults at some time. Also, 14% of the B-cohort and 18% of the K-cohort children had lived with step- or half-siblings at some time.
Note: The cross-sectional data include all responding households at each wave while the final column is based on those with data at each of the five waves.
In the following figures the longitudinal experiences of household complexity are explored for a selection of family characteristics. A set of characteristics was chosen to provide some indication of possible differences across socio-economic groups (using parental education), of intergenerational experiences of household complexity (using parents' reports of having experienced parental separation in childhood), and of possible cultural differences (using country of birth and ethnicity). This follows from the literature on household complexity in which these differences have been explored. For each of these, for simplicity, these characteristics refer to those of the child's primary carer. These analyses provide some initial insights, that can be explored further using LSAC. In particular, it should be noted that the associations observed may be inter-related (inasmuch as education, childhood experiences of parental separation and ethnicity might be correlated) and they may be related to characteristics not taken into account, such as parents' age.10
Figure 3.6 shows children's experiences of household complexity by parents' educational attainment. For both cohorts, children of higher educated parents (tertiary degree or higher) were less likely to experience any of the forms of complexity shown than those with lower education (incomplete secondary schooling). For example, in the B cohort, comparing the two extremes:
- 56% of children with lower educated parents experienced parental complexity at some time over the five waves, compared to 7% of those with higher educated parents.
- 35% of children with lower educated parents experienced other-adult complexity at some time over the five waves, compared to 16% of those with higher educated parents.
- 26% of children with lower educated parents experienced sibling complexity at some time over the five waves, compared to 8% of those with higher educated parents.
- In summary, 74% of children with lower educated parents experienced some household complexity at some time over the five waves, compared to 25% of those with higher educated parents.
The findings for the K cohort were virtually the same as those reported for the B cohort.
Figure 3.6: Household complexity summary across five waves, by parents' educational attainment
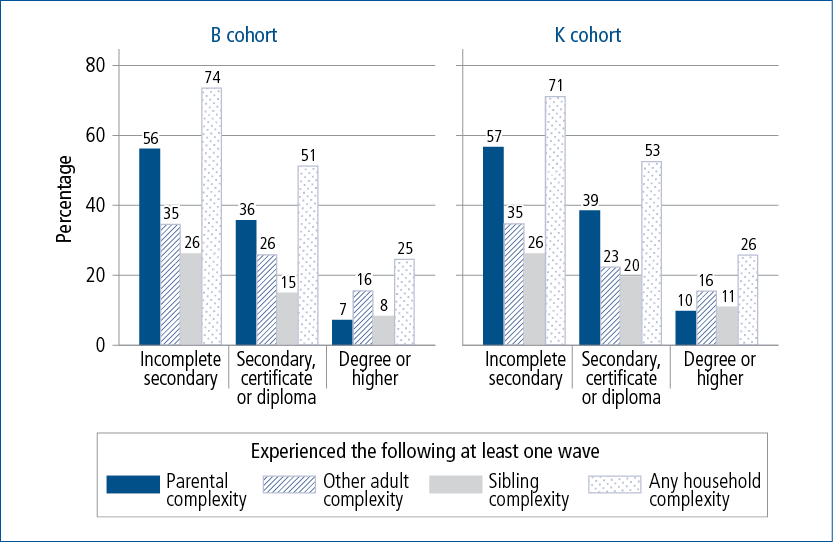
Notes: Analyses are based on households in all fives waves of LSAC, by the primary carer's highest level of educational attainment, as captured at Wave 1. Sample sizes: Incomplete secondary only (n = 196 for the B cohort and 270 for the K cohort); Complete secondary, certificate or diploma (n = 1,903 for the B cohort and 1,939 for the K cohort); Degree or higher (n = 1,654 for the B cohort and 1,466 for the K cohort).
Figure 3.7 compares children's experiences of household complexity by the primary carers' reports of whether they had experienced their own parents' separation in childhood (before age 18 years). Marked differences across the two groups (those who did, compared to those who did not experience their parents' separation) were apparent.
- Most striking differences were found in relation to the proportion of children having experienced parental complexity. Among children of parents who themselves had not experienced parental separation, 23% in the B cohort and 27% in the K cohort had experienced parental complexity over the five waves of LSAC. This compared to 37% in the B cohort and 45% in the K cohort for children of parents who had experienced parental separation during their own childhood.
- Differences were also apparent for sibling complexity. The percentage experiencing sibling complexity was 11 percentage points higher for those children whose parents had experienced parental separation in childhood.
- Differences were less marked for other adult complexity.
- Overall differences in the percentage experiencing household complexity were apparent, largely as a result of differences in parental complexity.
Figure 3.7: Household complexity summary across five waves, by parents' childhood experiences of parental separation
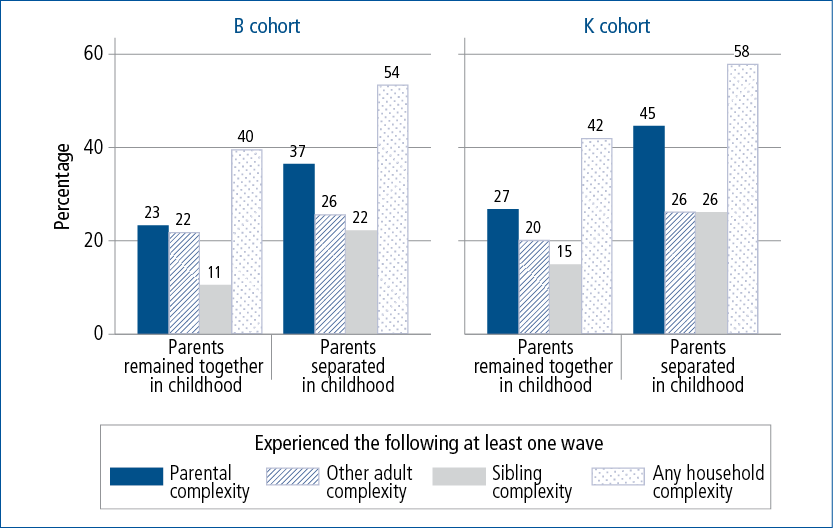
Notes: Analyses are based on households in all fives waves of LSAC, by the primary carer's reports of having experienced her/his parent's separation during childhood (before 18 years). Those with parents who never lived together are included in "parents separated in childhood". Sample sizes: Parents remained together in childhood (n = 2,728 for the B cohort, 2,745 for the K cohort); Parents separated in childhood (n = 1,021 for the B cohort, 927 for the K cohort).
Figure 3.8 summarises household complexity according to the primary carers' country of birth and ethnicity. Children with Indigenous parents were the most likely to have experienced household complexity, and this was apparent in relation to parental complexity, other adult complexity and sibling complexity in both cohorts. More than seven out of ten children of Indigenous parents experienced at least one form of household complexity at some time over the five waves. Experiences of household complexity were fairly similar for children of Australian-born, non-Indigenous parents and those of parents born in Oceania, Europe or the Americas. Compared to these groups, there were differences apparent for children of parents born in Asian countries or elsewhere (they were predominantly Asian-born parents), who were the least likely to experience parental complexity and sibling complexity, but were more likely to experience "other adult" complexity. This higher rate of "other adult" complexity is consistent with other research by Pilkauskas and Martinson (2014), which shows across Australia, the UK and the US, Asian families are particularly likely to include three generations of family members.
Figure 3.8 Household complexity summary across five waves, by parents' country of birth and ethnicity
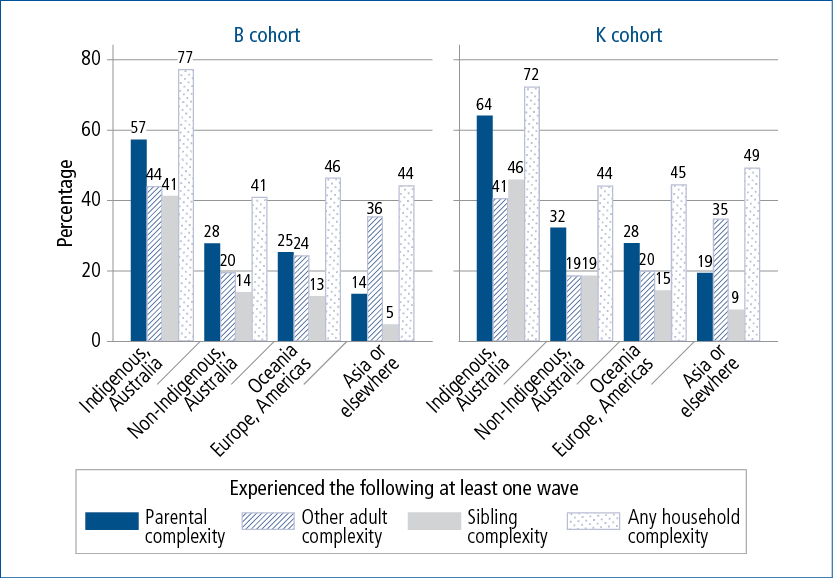
Notes: Analyses are based on households in all fives waves of LSAC, by the primary carer's country of birth, with those identifying as Indigenous shown separately. Sample sizes: Indigenous Australia (n = 67 for the B cohort, 68 for the K cohort); Non-Indigenous Australia (n = 2,951 for the B cohort, 2,802 for the K cohort); Oceania, Europe or Americas (n = 390 for the B cohort, 423 for the K cohort); Asia or elsewhere (n = 345 for the B cohort, 386 for the K cohort).
3.7 Summary and discussion
This chapter aimed to describe household complexity in order to understand the extent to which Australian children might experience different forms of complexity through their childhood. As such, the analysis explored household structure by describing co-residence with parents (including those living elsewhere) and parent figures, other adults such as grandparents, other relatives or unrelated adults, and different types of siblings. To summarise the findings and discuss the results more broadly, this section is structured around the research questions that were set out in the introduction. After answering these research questions, a discussion of the strengths and limitations of this analysis and some other contributions of this chapter are discussed.
Research questions and answers
The first question was "to what extent do Australian children experience different forms of household complexity?" The answer depends upon how complexity is measured, whether this is considered in terms of all forms of complexity explored here (parental, other adult and sibling) and whether it is measured at a point in time, or over a broader time frame. At the broadest level, the longitudinal analysis showed that more than four in ten children experienced some form of household complexity at some time over the first five waves of LSAC. This clearly represents a substantial number of children that have some experience of household complexity. Different sorts of complexity no doubt have different effects on children, and these may be positive or negative. For example, the co-residence of other adults has the potential to improve the wellbeing of children and families but may introduce unintended risks. Furstenberg (2014), writing about this form of family complexity, notes that there is a case for expecting that children would not be adversely affected by living in such families, given the potential for a greater number of parent figures ("so long as the attention and care is stable and coordinated", p. 22) and additional resources available to the family. Other forms of complexity may be more challenging for children and, as stated by Meyer and Carlson (2014, p. 263), "… by the time they reach adulthood, individuals may have accumulated a complicated mix of family relationships and experiences, which may in turn shape their own approach to family formation and hence the life chances of the next generation" (p. 263).
Much of this complexity reflects the proportion of children who at some stage live in a household with a single parent or with two parents in which at least one was not a biological parent (27% in the B cohort and 31% in the K cohort at some stage experienced this parental complexity). Related to this is the sibling complexity associated with living with half- or step-siblings (14% of the B cohort and 18% in the K cohort experienced this at some time over the five waves). Co-resident "other adult" complexity was fairly common (23% of the B cohort and 22% of the K cohort when considered over the five waves). These percentages reflect a longitudinal view over five waves and therefore are greater than those observed if looking only at a point in time as they capture dynamic changes in household form as children grow.
As was observed by Manning et al. (2014) in analysing parental and sibling complexity in the US, incorporation of information about siblings into an analysis of household complexity does highlight that focusing only on information about children's relationships to parents conceals complexity in some children's lives (Cancian et al., 2011; Gennetian, 2005; Halpern-Meekin & Tach, 2008). This chapter has expanded on that, to include parental, sibling as well as other adult complexity, recognising that the presence of these other adults may be a significant factor in describing children's family circumstances (Dunifon et al., 2014; Pilkauskas & Martinson, 2014).
The summary indicators of parental complexity or household complexity did not capture all aspects explored in this chapter. In particular, these indicators did not encapsulate the additional complexity that is experienced by some children who have parents living in two households. These children have additional complexities to contend with, especially those who spend time living in each parents' household. The living arrangements of these children was diverse even as viewed from the data available in LSAC, which does not include the circumstances of all children with a parent living elsewhere.
The second question was "how does the experience of household complexity change as children grow?". The main change was that children were increasingly likely to be exposed to household complexity as they grew because of the cumulative effects of parental relationship breakdown that meant children became more likely to experience parental complexity by living apart from one of their parents. Further, as children grew, they were more likely to experience parental complexity through the re-partnering of parents, but this applied to a relatively small proportion of the sample. Sibling complexity changes were less marked than those related to parental complexity as children grew to ages 12-13 years. For the complexity associated with co-resident adults, there was more potential complexity at the younger ages of children, which was more prominent for those living primarily with a parent who was currently single. After this, trends in co-resident adult complexity were not apparent.
It will be interesting to explore changes in household complexity beyond these ages, to examine whether some types of complexity become more apparent, particularly those related to re-partnering by parents and perhaps related to changes in the presence of siblings. Sibling presence is likely to change as children grow, as older siblings leave home. Of course, children themselves will be increasingly likely to leave their parental home as they grow older.
The third research question was "how stable are more complex household structures?". To answer this, we examined transitions across consecutive waves of LSAC, which may to some extent overstate stability, since they cover a two-year period and multiple transitions may actually occur between waves. Overall, the analyses showed considerable stability in children's experiences of different types of parental relationships over the two-year period between waves. In relation to parental complexity, this was especially so for children living with two biological parents, but children with other parental relationships were also more likely to remain with those parental relationships across a two-year period than they were to change to a different one. Nevertheless, complex households as indicated by parental relationships were more unstable than others. As such, children living in complex households may face challenges through living with a single parent or with one or two non-biological parents, and their increased likelihood of experiencing further parental relationship transitions may have additional implications for their own wellbeing (Magnuson & Berger, 2009).
Finally, the fourth question asked "how does the incidence of household complexity vary with selected parental characteristics?". This question was posed because international research shows that there are strong selection biases in regard to household complexity; in particular, with a higher incidence of financial disadvantage among more complex families (see Furstenberg, 2014). Other differences related to race and parental education have also been observed (Brown et al., 2015; Manning et al., 2014; McLanahan & Percheski, 2008), and these variables, along with financial disadvantage, explain some of the associations between family complexity and children's wellbeing (Mollborn, Fomby, & Dennis, 2011). Household complexity as defined here, especially with regard to parental complexity, will be strongly related to financial wellbeing since single-parent households were counted as complex ones, and families of single parents have on average poorer financial wellbeing compared to those of two parents (Baxter, Gray, Hand, & Hayes, 2013). This was, therefore, not explored here. Instead, some variables that related to pre-existing characteristics of parents were used - those that were not directly related to their structure. These initial analyses showed some marked differences in household complexity across different demographic groups. Children in households of lower educated parents, parents who had themselves experienced parental separation in childhood and Indigenous parents were at greatest risk of experiencing household complexity themselves. The greatest differences related to higher proportions experiencing parental complexity. These findings suggest strong correlations and potential for intergenerational transfers in disadvantage, inasmuch as we expect complexity to be associated with poorer socio-economic circumstances (e.g., Hancock, Edwards, & Zubrick, 2013). It may be that some forms of complexity - in particular, other adult complexity - actually help with the financial and other circumstances of families (Mutchler & Baker, 2009), and this will be something to explore further in the future (see also Chapter 2, this volume, regarding co-resident grandparents).
Strengths and limitations
This chapter provided a detailed exploration of household complexity, making use of the five waves of LSAC, from two cohorts, to explore variation in complexity from cross-sectional and longitudinal perspectives. These data were particularly valuable for drawing out different aspects of household complexity, given that LSAC has the child as the focal unit, allowing relationships to be identified between children and all others in the household.
Despite the usefulness of LSAC for these analyses, there were some limitations that should be acknowledged. There are three main limitations. The first is that while LSAC is broadly representative of families across Australia, the more complex households may be under-represented in these data. This may be especially so in later waves of LSAC, insofar as non-response might be expected to be greater in more complex households. While survey weights correct for some of the bias associated with selective attrition, they do not take account of all of the sorts of complexity explored in this chapter. Further, given that LSAC is not representative of families in remote parts of Australia, we know that we are not fully representing the complexity experienced by families living in these areas, and this might be especially relevant in thinking about children in Indigenous families. To the extent that LSAC under-represents other demographic groups (such as newly arrived migrants) we might not have a full picture of complexity across all families. The second limitation relates to children with parents living in two households. While LSAC allows us to go beyond usual sets of data to explore some children's living arrangements across households, these data are not complete, and so we cannot fully gauge the complexity of all LSAC children's family relationships. Thirdly, this chapter made use of information about children's households at the time of the LSAC collection at each wave. No attempt was made to fill in information about relationship changes that occurred between waves, nor to incorporate information on relationship changes that occurred prior to the first wave of LSAC. Together, these limitations might lead to an understatement of the complexity of family life faced by some children. The analyses, nevertheless, provide some estimates of this complexity that go beyond typical classifications of Australian family forms.
Discussion
The main contribution of this chapter was the detailed attention to household complexity. Throughout this analysis, indicators of dimensions of household complexity beyond those related to parental complexity were explored. While it is quite common in Australian research to give some attention to parental complexity, at least as captured based on relationships within one household, it is quite uncommon to include information about other forms of complexity. Should we consider using a different set of indicators of complexity in undertaking research on Australian families?
Of course the answer will depend upon the research question and the target population. It may be of merit, for example, to take account of potential sources of household complexity if analysing single-parent families with young children who may have co-resident adults. For all families with children, even two biological parent families, it may be worth including indicators of relationships between children, especially if the focus is on children's wellbeing. Also, incorporating information about children's living arrangements within another parents' household may be helpful, although this is possibly the most difficult to capture well and the diversity of such arrangements makes it difficult to represent this complexity fully.
Regardless of decisions made about which indicators to use, capturing complexity fully is difficult, especially to take account of past experiences of complexity that may have lasting influences on children. Researchers, policy-makers and service delivery agencies therefore need to be cognisant of this potential for children to have lives that are more complex than indicated by usual classifications of family form.
Understanding the extent and nature of children's experiences of different household relationships is important contextual information for thinking about the value and appropriateness of policies and services to children and their families. For children who experience family relationships that are more complex or more transient, the usual approaches that address the wellbeing of children and families may need some modification to take account of children's particular circumstances.
3.8 References
Baxter, J. A., Edwards, B., & Maguire, B. (2012). New father figures and fathers living elsewhere (FaHCSIA Occasional Paper No. 42). Canberra: FaHCSIA.
Baxter, J. A., Gray, M., Hand, K., & Hayes, A. (2013). Parental joblessness, financial disadvantage and the wellbeing of parents and children (FaHCSIA Occasional Paper No. 48). Canberra: FaHCSIA.
Brandon, P. D. (2012). The rise of three-generation households among households headed by two parents and mothers only in Australia. Journal of family and economic issues, 33(3), 376-388.
Brown, S. L., Manning, W. D., & Stykes, J. B. (2015). Family structure and child well-being: Integrating family complexity. Journal of Marriage and Family, 77(1), 177-190.
Brzinsky-Fay, C., Kohler, U., & Luniak, M. (2006). Sequence analysis with stata. Stata Journal, 6(4), 435-460.
Cancian, M., Meyer, D. R., & Cook, S. T. (2011). The evolution of family complexity from the perspective of nonmarital children. Demography, 48(3), 957-982.
de Vaus, D., & Gray, M. (2004). The changing living arrangements of children, 1946-2001. Journal of Family Studies, 10(1), 9-19.
de Vaus, D., & Gray, M. (2007). In what types of families do children now live? Changes from 1946 to 2001. Families, Incomes and Jobs, Volume 2, 2.
Dunifon, R. E., Ziol-Guest, K. M., & Kopko, K. (2014). Grandparent coresidence and family well-being implications for research and policy. The ANNALS of the American Academy of Political and Social Science, 654(1), 110-126.
Furstenberg, F. F. (2014). Fifty years of family change from consensus to complexity. The ANNALS of the American Academy of Political and Social Science, 654(1), 12-30.
Gennetian, L. A. (2005). One or two parents? Half or step siblings? The effect of family structure on young children's achievement. Journal of Population Economics, 18(3), 415-436.
Halpern-Meekin, S., & Tach, L. (2008). Heterogeneity in two-parent families and adolescent well-being. Journal of Marriage and Family, 70(2), 435-451.
Hancock, K., Edwards, B., & Zubrick, S. (2013). Echoes of disadvantage across the generations? The influence of long-term joblessness and separation of grandparents on grandchildren. In Australian Institute of Family Studies (Eds.), The Longitudinal Study of Australian Children Annual Statistical Report 2012 (pp. 43-58). Melbourne: AIFS.
Kowaleski-Jones, L., & Dunifon, R. (2004). Children's home environments understanding the role of family structure changes. Journal of Family Issues, 25(1), 3-28.
Magnuson, K., & Berger, L. M. (2009). Family structure states and transitions: Associations with children's well-being during middle childhood. Journal of Marriage and Family, 71(3), 575-591.
Maguire, B. (2011). How family composition changes across waves. In Australian Institute of Family Studies (Eds.), The Longitudinal Study of Australian Children Annual statistical report 2010, (p. 19). Melbourne: AIFS.
Manning, W. D., Brown, S. L., & Stykes, J. B. (2014). Family complexity among children in the United States. The ANNALS of the American Academy of Political and Social Science, 654(1), 48-65.
Mason, J., & Tipper, B. (2008). Being related how children define and create kinship. Childhood, 15(4), 441-460.
McLanahan, S., & Percheski, C. (2008). Family structure and the reproduction of inequalities. Annual Review of Sociology, 34, 257-276.
Meyer, D. R., & Carlson, M. J. (2014). Family complexity implications for policy and research. The ANNALS of the American Academy of Political and Social Science, 654(1), 259-276.
Mollborn, S., Fomby, P., & Dennis, J. A. (2011). Who matters for children's early development? Race/ethnicity and extended household structures in the United States. Child Indicators Research, 4(3), 389-411.
Mutchler, J. E., & Baker, L. A. (2009). The implications of grandparent coresidence for economic hardship among children in mother-only families. Journal of Family Issues, 30(11), 1576-1597.
Pilkauskas, N., & Martinson, M. (2014). Three-generation family households in early childhood: Comparisons between the United States, the United Kingdom, and Australia. Demographic Research, 30(60), 1639-1652.
Reimondos, A., Evans, A., & Gray, E. (2011). Living-apart-together (lat) relationships in Australia. Family Matters, 87, 43-55.
Villeneuve-Gokalp, C. (2000). The double families of children of separated parents. Population: An English Selection, 12(1), 111-137.
Weston, R., & Qu, L. (2014). Trends in family transitions, forms and functioning: Essential issues for policy development and legislation. In A. Hayes & D. Higgins (Eds.), Families, policy and the law: Selected essays on contemporary issues for Australia, (chapter 2). Melbourne: Australian Institute of Family Studies.
Notes: Children may have siblings aged under 15 years as well as siblings aged 15 years or more; they may have full siblings as well as half- or step-siblings. The total "half- or step-siblings" includes a
1 There are other potential sources of family complexity not explored here, as some variations in family form are unable to be studied using LSAC. In particular, this chapter does not specifically look at same-sex parented households. It also does not explore the degree to which parents, siblings or others may live part-time in another household, or whether there are others (such as the boy-/girl-friend or partner of a single parent) who make some contribution to family life yet live elsewhere, as might be the case in "living apart together" relationships (Reimondos, Evans, & Gray, 2011).
2 It is possible for children to shift their primary household across waves of LSAC if, for example, their arrangements change such that they live more (or only) with their father, rather than with their mother. There were around 50 children in the K cohort and 20 in the B cohort whose primary household changed between waves of LSAC. Such changes are not identified in the analyses presented in this chapter and clearly add to the complexity of some children's lives. However, in the case of shared care families, children did not always change their LSAC primary household if they started spending significantly more time with their other parent, which is why a small number of children are reported to spend more nights in the household of their other parent than they do in the LSAC primary household (see Table 3.4).
3 The data were "cleaned" to correct for inconsistencies in the data, since it was in the more complex households that some inconsistencies were observed. The main correction was to Wave 5 sibling relationship information, which in many cases was not consistent with earlier waves, even when households remained unchanged. Where these data were inconsistent, the relationship between siblings and the LSAC child was edited in Wave 5 to be equal to that of Wave 4 or, if missing, Wave 3. Relationships were amended within 245 households in the B cohort and 219 households in the K cohort. Small numbers of observations were excluded from analyses if there were missing data on key relationships.
4 To demonstrate how differences in classifications of household relationships arise from this, a particular case deserves mention: that of a child living with a biological parent and another adult who is not his or her biological parent but who is married to or cohabiting with the biological parent. In some households, the other adult had been classified as a "step-parent" to the child while in others he (it was usually a he) was classified as an "unrelated adult". LSAC interviewer instructions guide interviewers on how to identify whether adults in the household should be counted as "Parent 2". If classified as a step-parent, an additional adult was coded to be "Parent 2" and the child was subsequently classified as living with two parents. If classified as "unrelated adult", whether or not this person was coded to be "Parent 2" depended on whether the LSAC respondent reported to the interviewer that this person had a parental role. If he was said to have a parental role, then he was classified as Parent 2 and the child was subsequently classified as living with two parents. If he was instead reported to be without parental responsibilities to the child, then he was not counted as "Parent 2", and the child was subsequently classified as living with a single parent and a co-resident adult. In the vast majority of cases, this other adult was classified as Parent 2. (Remembering also that temporary household members, including de facto partners, are not included in any of the estimates shown here.)
5 At the time of writing, these categories aligned with those used in the calculation of child support payments, as reported by the Department of Human Services (<www.humanservices.gov.au/customer/enablers/child-support/child-support-a...). The number of nights/year was derived from information provided on how often the child stays with their PLE, and how many nights the child stays overnight at these times. See also, footnote 2 concerning children who are classified as "primary care" by their PLE. In Wave 3, a large number of parents of children with a PLE opted out of providing information about the PLE, including frequency of contact with child. Where possible, to avoid the loss of sample, this missing Wave 3 data was estimated, by making an assumption that it was equal to the highest of the care groups identified at Wave 2 or Wave 4. Information was estimated in this way for 102 households in the B cohort and 130 households in the K cohort.
6 Excluding children in remote parts of Australia that were not included in the LSAC sample design.
7 Derived from Table 7. Retrieved from <www.abs.gov.au/AUSSTATS/abs@.nsf/DetailsPage/4442.02012-13? OpenDocument>.
8 See footnote 5 for information about this classification and footnote 2 for information concerning children potentially changing primary household across waves, and about those classified as "shared or majority care" by the PLE.
9 This information is not available for all children with a PLE, as it was only collected when the PLE contact details were provided and the PLE participated in the study. For some earlier LSAC analyses of children's living arrangements in their PLE household, see Baxter et al. (2012).
10 Educational attainment, country of birth and ethnicity were taken from the Wave 1 data. Parental separation during childhood was taken from the Wave 2 data (it was not collected in Wave 1).
Share


