6. Pubertal status and emotional, school and social functioning
6. Pubertal status and emotional, school and social functioning
6.1 Introduction
Puberty is a major developmental milestone involving the physical changes whereby a child's body matures into an adult body physiologically capable of sexual reproduction. The onset of puberty marks the transition from childhood to adolescence. The beginning of adolescence involves rapid physical growth, changes in body composition and changes in most body systems - including the neuroendocrine axis, bone size and mineralisation, and the cardiovascular system - along with emotional and cognitive changes (Dubas, Graber, & Petersen, 1991). A better understanding of the factors associated with the timing of the onset of puberty is not only important for understanding variable patterns of physical development but also has important clinical, health and educational implications.
Factors influencing pubertal timing
Pubertal timing, defined by Marshall and Tanner (1969, p. 291) as "the variation in the chronological age at which adolescence begins and different stages of physical maturity are reached", has been shown to vary according to many factors, including gender, genetics, nutrition, ethnicity, health status and activity level, household structure and family functioning, and environmental exposures (Ellis & Essex, 2007; Maisonet et al., 2010; Mensah, Bayer, Wake, Carlin, Allen, & Patton, 2013; Towne, Czerwinski, Demerath, Blangero, Roche, & Siervogel, 2005).
Over the past 150 years, the age at onset of puberty has fallen substantially across many developed countries. Bellis, Downing, and Ashton (2006) found that in northern Europe, the average age at menarche has fallen by up to 3 years over the last century. The major factors that have been shown to accelerate the onset of puberty are a combination of improvements in public health, such as improved childhood nutrition and reduction in the incidence of childhood infections; and higher stress levels among adolescents resulting from changes in social structures such as increasing levels of divorce, single-parent families and father absenteeism (Bellis et al., 2006). On average, girls begin puberty around age 10-11 and boys start at age 11-12 (Kail & Cavanaugh, 2010; Mensah et al., 2013). However, the timing of puberty varies by 4 to 5 years among healthy children, with the normal ages ranging from 8-13 years for girls and 9-14 for boys (Mensah et al., 2013).
Parental separation has been shown to be associated with earlier reproductive development, while the presence of the child's biological father in the home has been found to predict later pubertal timing, especially among daughters (Quinlan, 2003). Using a British national sample of 5,913 women, Bogaert (2008) reported that an absent father during childhood predicted early menarche in adolescent girls. Similarly, James, Ellis, Schlomer, and Garber (2012) found that father absence had a significant influence on the early maturation of daughters but not sons. Other studies suggest that it is not only the absence of the biological father, but the household structure that influences pubertal timing. For example, Kim and Smith (1998) found that living in a single-parent family was associated with earlier pubertal onset in both girls and boys; Ellis and Garber (2000) found that a step-father presence was a stronger predictor of early pubertal timing in girls than a biological father's absence; and Arim, Shapka, Dahinten, and Willms (2007) reported that the presence of a step-father predicts more advanced pubertal development status for both genders.
A mother's pubertal timing has been shown to have a strong influence on her daughters' pubertal timing. Ellis and Essex (2007) found that an older age at menarche in mothers significantly predicts the pubertal timing of their daughters. Similarly, a study of 4,000 British girls aged 8-14 years found that a maternal age at menarche of under 12 years old was associated with earlier onset of puberty among daughters (Maisonet et al., 2010). Using data collected from the Fels Longitudinal Study in the United States, Towne et al. (2005) estimated the correlations of ages at menarche between daughters and mothers, sisters and other relatives (e.g., an aunt and niece). Results from this study showed that approximately half of the variation in menarche timing was attributable to genetic factors. To the best of our knowledge, there is no existing evidence about the association between parents' pubertal timing and their sons' pubertal development. This lack of evidence is presumably due to a lack of available data about the pubertal timing of mothers and their sons, and fathers and their children.
Many other factors have been shown to influence pubertal timing. For example, studies have shown that children who were overweight or obese in the early years of childhood tended to experience the onset of puberty at an earlier age (Davison, Susman, & Birch, 2003; Lee, Kaciroti, Appugliese, Corwyn, Bradley, & Lumeng, 2010; Staiano, Broyles, Gupta, Malina, & Katzmarzyk, 2013). On the other hand, body fat in the later years of childhood has been found to delay puberty in boys. For example, boys with a higher body mass index (BMI) tended to have later onset of puberty compared to boys with a lower BMI (Lee et al., 2010). Exclusive breastfeeding has been found to be negatively associated with early menarche after adjusting for a range of confounders such as socio-economic position, urban residence, mothers' educational level and postpartum BMI (Al-Sahab, Adair, Hamadeh, Ardern, & Tamim, 2011). Similarly, Kale et al. (2014) found that mixed-fed or predominantly breastfed girls showed later onset of breast development than formula-fed girls. First-born birth order has been shown to be associated with faster infancy weight gain (Ong et al., 2009), which is associated with early puberty of both genders (Kuzawa, McDade, Adair, & Lee, 2010; Terry, Ferris, Tehranifar, Wei, & Flom, 2009).
According to life history theory, pubertal timing is partly a result of environmental factors early in life, which lead to different developmental trajectories (Ellis, 2004). That is, early puberty may be a result of a child's adaptation to life adversities (e.g., a stressful family environment) and, in turn, may be related to anxiety and aggression (Del Giudice, 2009; Mustanski, Viken, Kaprio, Pulkkinen, & Rose, 2004). Higher levels of parental investment from both parents, maternal support and lower levels of father-reported marital conflict have also been found to be associated with later physical maturation (Ellis & Essex, 2007; Marshall, Gorely, & Biddle, 2006).
Pubertal timing and social outcomes
Changes in physical development during puberty are often accompanied by major changes in interpersonal relationships; and both early and late pubertal onset have been found to be associated with a variety of negative social-behavioural outcomes such as depression, aggression, delinquency, substance abuse, relationship problems and adolescent pregnancy (Mendle, Turkheimer, & Emery, 2007).
The amount of time that children spend with their friends increases during adolescence; and it is also a time when adolescents become more independent from their parents (Savin-Williams & Berndt, 1990). The rapid physical changes in puberty are accompanied by substantial changes in social roles and relationships (Paikoff & Brooks-Gunn, 1991), which influence adolescents' interactions with their peers.
Previous studies have suggested that variation in physical maturation can create difficulties in children's friendships (Conley & Rudolph, 2009). Developmental readiness theory suggests that early-maturing adolescents are more likely to have psychological and behavioural problems because these individuals are not emotionally or cognitively ready for the physical and social changes accompanying puberty (Ge, Conger, & Elder, 2001a). Mensah et al. (2013) used LSAC data to explore how the early onset of puberty related to children's social and behavioural adjustment. Results from this study revealed that both boys and girls who entered puberty early (at age 8-9 years) had poorer psychosocial adjustment from early childhood through to early adolescence.
"Off-time" puberty (i.e., early or late) is also associated with both internalised and externalised distress (Mendle et al., 2007), which have been shown to lead to behavioural disaffection in the classroom (i.e., withdrawal behaviours such as attempting to "lay low" and not participate in class; refusal behaviours including refusing to do classwork, study for tests or come to class; and disruptive aggressive behaviours such as yelling at the teacher in the classroom) (Roeser, van der Wolf, & Strobel, 2001). In a UK study, girls with the early onset of puberty were also found to be more likely to be bullied and take time off from school during early adolescence (Downing & Bellis, 2009). Therefore, pubertal timing may have an indirect influence on adolescents' school performance via changes in their mental health and relationships with their peers.
For boys, pubertal development and the associated changes in hormone levels have been shown to be related to increased levels of physical aggression and antisocial behaviour (Rowe, Maughan, Worthman, Costello, & Angold, 2004). A study of 128 boys in the United States showed that early-maturing boys experienced decrements in the quality of their peer relationships as they moved out of childhood and into early adolescence, whereas boys with more typical pubertal development experienced improvements in peer relationships (Mendle et al., 2012).
Among girls, early pubertal development has been found to be associated with disapproval and negative social reputations among their peers, as well as peer victimisation and exclusion (Conley & Rudolph, 2009). Compared to those who experienced late puberty, girls who experienced early puberty had higher levels of both internalising (e.g., depression, anxiety, bulimia nervosa) and externalising (e.g., drinking, substance abuse) problems (Kaltiala-Heino, Marttunen, Rantanen, & Rimpelä, 2003). Early-maturing girls were found to be more susceptible to peer influence with respect to risk-taking (Kretsch, Mendle, & Harden, 2014) and were more likely to develop depression if they experienced stressful peer relationships (Conley & Rudolph, 2009).
Although variations in pubertal timing have been linked to mental health and behavioural problems - both concurrent (Huerta & Brizuela-Gamiño, 2002) and subsequently (Copeland, Shanahan, Miller, Costello, Angold, & Maughan, 2010) - researchers also argue that the relationship between puberty and developmental outcomes may be bi-directional. That is, early childhood environmental stressors and anxiety early in life increase the likelihood of early puberty (Belsky, Steinberg, & Draper, 1991; Scarpa, 2004) and this, in turn, may contribute to adjustment problems in adolescence (Caspi & Moffitt, 1991; Ge, Conger, & Elder, 2001b; Reardon, Leen-Feldner, & Hayward, 2009).
In this chapter, we describe children's patterns of pubertal timing and examine the association between household structure and pubertal maturation; and the associations between pubertal development and psychosocial outcomes. This chapter aims to build on previous research and, using longitudinal data from a large nationally representative sample of Australian children aged between 8 and 13, address the following questions:
- What are the patterns of pubertal timing among Australian adolescents?
- Does pubertal timing relate to family factors such as household structure, absence of the biological parents and pubertal timing of parents?
- To what extent is pubertal development related to children's mental health, school functioning and relationships with their peers?
The chapter is structured as follows. The frequency of specific indicators of the onset of puberty at ages 8-9, 10-11 and 12-13 are presented. We then examine factors such as household structure and the pubertal timing of parents that may be associated with children's pubertal timing. Finally, we examine the association between pubertal status and children's emotional functioning, school functioning and relationships with peers.
6.2 Data and measurement
Sample
This chapter uses data from K-cohort children when they were aged 8-9 (Wave 3), 10-11 (Wave 4) and 12-13 years (Wave 5). There were 4,331 children aged 8-9 years; 4,169 children aged 10-11 years and 3,956 children aged 12-13 years who participated in the data collection at Waves 3, 4 and 5 respectively. All analyses presented in this chapter were conducted separately for boys and girls.
Measurements of pubertal status
Pubertal status refers to the physical and physiological maturational levels of children at a given point in time (Huddleston & Ge, 2003). A variety of methods have been used to evaluate pubertal development in adolescents. For girls, the most commonly used markers of pubertal timing are breast development, pubic hair development and age at menarche (Kaltiala-Heino et al., 2003; Natsuaki, Klimes-Dougan, Ge, Shirtcliff, Hastings, & Zahn-Waxler, 2009). For boys, measures of pubertal timing are commonly based on physical signs including voice deepening, facial hair and pubic hair development (Parent, Teilmann, Juul, Skakkebaek, Toppari, & Bourguignon, 2003). Other commonly used measures of pubertal development are Tanner Staging (Marshall & Tanner, 1969, 1970) and the Pubertal Development Scale (PDS; Crockett & Petersen, 1987). Tanner Staging is a widely used rating scale for sexual development with a range from Stage 1 (pre-pubertal) to Stage 5 (adult). For females, the Tanner scale is based on the assessment of breast and pubic hair development; and males are rated based on genital development and pubic hair growth. The PDS assesses the pubertal stage based on a number of typical physical indicators of puberty for boys and girls. Adolescents (or their parents) are asked to rate the amount of change or development the young person has experienced with respect to several physical characteristics associated with pubertal maturation. All adolescents are asked whether they have experienced a growth in height; growth in body hair; and skin changes such as pimples. Boys are asked about voice deepening and facial hair; and girls are asked about breast growth and whether they have started to menstruate. The PDS has been used in a variety of ways in studies of pubertal development. For example, Mensah et al. (2013) define early puberty as showing at least one indicator of puberty at an early age. Yousefi et al. (2013) used the PDS to determine pubertal timing according to the age when the first pubertal indicator was experienced, and Mustanski et al. (2004) used PDS scores at two time points (ages 11 and 14) to assesss pubertal development. Based on reported levels of development on the components of the PDS scale, Crockett and Petersen (1987) developed a classification for pubertal development in terms of five pubertal status categories: pre-pubertal, early pubertal, mid-pubertal, late pubertal and post-pubertal.
Several other methods have been used to define "early", "on time" or "late" pubertal timing. Some studies use perceived timing of puberty reported by the parent (e.g., Is your child early, on-time or late with respect to their peers?). Others have used self-reported stages of puberty, which are then categorised into a timing variable based on sample characteristics or population norms (Natsuaki et al., 2009). Given the variety of methods used to measure pubertal development, it is important to keep these differences in mind when comparing the findings of different studies.
From Wave 3 of LSAC, parents of children in the K cohort were asked to rate the amount of change or development the study child experienced with respect to several physical signs associated with pubertal maturation. Parents were asked to rate each of these signs of puberty on a scale of 1 to 4, with 1 meaning "has not yet started", 2 "has barely started", 3 "has definitely started" and 4 meaning "seems complete". Not all signs of puberty were asked about in every wave, as shown in Table 6.1. At Waves 4 and 5, parents of girls were also asked if their daughter had ever menstruated.
In order to examine the association between pubertal timing and emotional functioning, school functioning and peer relationships, Puberty Category Scores were computed by totaling the PDS scores using the criteria developed by Crockett and Petersen (1987). For boys, parents' ratings of the signs of body hair growth, deepening voice and facial hair growth were summed to create a total score ranging from 3 to 12. For girls, parents' ratings of the signs of body hair growth and breast development were summed to create a scale ranging from 2 to 8. For girls, this scale was combined with parents' responses about whether their daughters experienced menarche or not, as shown in Table 6.2.
Notes: For boys, the total score is the sum of parents' responses (on a 1 to 4 scale with 1 meaning "not started" and 4 meaning "seems complete") to questions about body hair growth, deepening voice and facial hair growth. For girls, the total score is the sum of parents' responses to questions about body hair growth and breast development.
Measures of household structure and the timing of parents' puberty
The LSAC data can be used to explore whether there is a relationship between the timing of children's puberty, household structure and parents' retrospective self-reports of pubertal timing. We first examine the proportion of children showing signs of puberty according to whether they are living with their biological mother and their biological father. Then, the proportion of children showing signs of puberty is compared according to a more detailed measure of household structure - that is, whether the child is living with both their biological parents, only one parent (lone mother or lone father), their mother and step-father, father and step-mother or with neither biological parent.1
Because children's pubertal development has been shown to be associated with their parents' pubertal timing, we also examine the proportion of children showing signs of puberty at specific ages according to their parents' responses to questions about their own pubertal timing. At Wave 5, parents were asked to think of the age at which their own puberty began and to rate on a scale of 1 to 5 whether they felt that, in comparison to their peers, they were 1 "Way ahead of most other kids", 2 "Ahead", 3 "About the same age as other kids", 4 "Behind" or 5 "Way behind most other kids". Female parents were also asked the age at which their own periods started.
Measures of emotional functioning, school functioning and peer relationships
Children's emotional functioning, school functioning and peer relationships were measured using the Parent 1-reported Pediatric Quality of Life (PedsQL) inventory (Varni, Burwinkle, & Seid, 2006) from Waves 3 to 5. The three subscales of PedsQL used in this chapter were as follows:
1. Emotional functioning (5 items) assesses the frequency that the child displays negative emotional states such as sadness and anxiety. Parents were asked how often the study child had the following problems in the past month:
- feeling afraid or scared;
- feeling sad or blue;
- feeling angry;
- trouble sleeping; or
- worry about what will happen to him/her.
2. School functioning (5 items) measures children's school adjustment and performances. Parents were asked how often the study child had the following problems in the past month:
- trouble paying attention in class;
- forgetting things;
- trouble keeping up with school activities;
- missing school because of not feeling well; or
- missing school to go to the doctor or hospital.
3. Social functioning (5 items) assesses children's relationship with their peers. Parents were asked to rate how frequently the study child had the following problems in the past month:
- not getting along with other children;
- other kids not wanting to be his/her friend;
- getting teased by other children;
- not being able to do things that other children his/her age can do; or
- not keeping up when playing with other children
The study child's main carer was asked to rate each item on a 5-point scale, ranging from 1 (Never) to 5 (Almost always). Items were reverse-scored and transformed to a 0 to 100 scale (1 = 100, 2 = 75, 3 = 50, 4 = 25, 5 = 0), so that higher scores indicate a higher level of functioning. Average scores were then calculated for the emotional, school and social functioning subscales.
Methodology
This chapter will provide descriptive evidence of the proportion of children showing physical signs of the onset of puberty. We begin by providing an overview of the percentage of boys and girls showing specific signs of puberty at ages 8-9, 10-11, and 12-13 years. Based on these individual, specific signs of puberty, we then compare the percentage of children whose parents reported that they were showing at least one sign of puberty (including those who were reported as "barely started"), with the percentage who were showing at least one definite sign of puberty. By age 12-13, almost all children were showing some signs of the onset of puberty. For this reason, for our analysis of the association between pubertal timing, household structure and parents' pubertal timing, the indicator of whether a child was showing definite signs of puberty was used. Logistic regression models were used to estimate the association between household structure and parents' pubertal timing on the likelihood of showing definite signs of puberty. The explanatory variables used in the multivariate analyses capture a range of factors that are known to impact upon child development and developmental outcomes. In the estimates of the relationship between household structure, inherited factors and the likelihood of showing signs of puberty, we control for age (in weeks), birth order, birth weight, whether the child was underweight or overweight in the previous wave, whether the child has a long-term health condition and whether the child was breastfed until at least 6 months of age.
For our analysis of the association between socio-emotional outcomes and pubertal status, more detailed measures of pubertal status (based on the puberty category scores developed by Crockett and Petersen (1987)) were used to differentiate between those in the early and later stages of puberty. We also examine the association between age at onset of puberty and social-emotional outcomes. In the multivariate analysis of the association between pubertal status and social-emotional outcomes, we use linear regressions and control for child age (in weeks), household structure, birth order, household size, number of siblings, birth weight, whether the child was breastfed until 6 months old, whether the child has a long-term health condition or disability, whether the child was under or overweight, parental education, and equivalised parental income.
6.3 Patterns of children's pubertal timing
The percentages of boys and girls showing specific signs of puberty are shown in Tables 6.3 and 6.4 respectively. Although the age at onset of puberty varied among children, most girls had not yet started showing any signs of puberty at the age of 8-9 years. For most girls, one of the first signs of puberty is the beginning of breast growth. Only 7% of girls had definitely started breast development by the age of 8-9; and a further 16% had barely started. Less than 20% of 8-9 year old girls were showing any signs of skin changes or adult-type body odour; and less than 10% had started growing body hair.
By the age of 10-11 years, the proportion of girls showing signs of puberty had increased substantially. More than half (54%) were showing some signs of skin changes; almost 60% had body hair; more than three-quarters (76%) had started breast development; and the majority (87%) had experienced a growth spurt. However, only 6% of 10-11 year old girls had experienced menarche. At the age of 12-13 years, 86% of girls had experienced skin changes, with 54% of parents saying that this had definitely started; 93% had body hair (61% definitely started and 15% complete); almost all girls (96%) had experienced a growth spurt (73% definitely started); 97% had begun breast development (76% definitely started) and 57% had experienced menarche.
Notes: Percentages based on weighted data. a This question was only asked at age 8-9. b This question was not asked at age 8-9. c At ages 10-11 and 12-13, mothers were asked about whether their daughter had experienced menarche.
Source: LSAC K cohort, Waves 3, 4 & 5
On average, the onset of puberty occurs later for boys than for girls. Table 6.4 shows that the vast majority of boys were not showing any signs of pubertal development at the age of 8-9 years. Around 12% of 8-9 year old boys were reported as having adult-type body odour; and a similar proportion (11%) had started showing signs of skin changes, while very few (4%) had any signs of body hair.
For boys, a rapid increase in height is one of the first signs of the onset of puberty. At the age of 10-11 years, just over 80% of boys were reported as having experienced a growth spurt, with 47% of parents saying that a rapid increase in height had definitely started. Other signs of puberty were much less common for boys at this age, with 35% of parents reporting that their sons had body hair (only 11% definitely started); 31% reporting their sons had started having skin changes (7% definitely started); 10% reporting a deepening voice (less than 2% definitely started) and 6% reporting that their son had begun to grow facial hair (less than 1% definitely started).
By the age of 12-13, almost 90% of boys had experienced a growth spurt; over 70% had body hair and almost 70% had experienced skin changes. Almost half of 12-13 year old boys were reported as showing signs of a deepening voice, with 23% of parents saying this had definitely started. Most boys still had not begun to grow facial hair when they were 12-13 years old. Only 12% of parents reported that this had definitely started. Furthermore, at the age of 12-13, very few parents reported that any of the signs of puberty seemed complete.
Notes: Percentages based on weighted data. aThis question was only asked at age 8-9. b This question was not asked at age 8-9.
Source: LSAC K cohort, Waves 3, 4 & 5
These physical signs can then be used to determine the proportion of children who are showing any signs of puberty. Table 6.5 shows the percentage of boys and girls at ages 8-9, 10-11 and 12-13 years that had started showing any signs of the onset of puberty (i.e., parents rated at least one of the physical signs of puberty as "barely started", "definitely started" or "seems complete"); and the proportion of children who were showing definite signs of the onset of puberty (i.e., parents rated at least one of the physical signs of puberty as either "definitely started" or "seems complete").
Notes: Percentages based on weighted data. Children are considered to be showing "definite signs" if parents rated any of the specific signs of puberty as "definitely started" or "seems complete". Children are considered to be showing any signs if parents rated any of the specific signs of puberty as "barely started", "definitely started" or "seems complete".
Source: LSAC K cohort, Waves 3, 4 & 5
For some children, pubertal onset was quite early. At the age of 8-9, 21% of boys and 40% of girls were showing some signs of the onset of puberty and 16% of girls and 7% of boys were showing definite signs that puberty had begun. By 10-11 years, these proportions had increased substantially, with around 90% of children showing some signs of the onset of puberty and 74% of girls and 53% of boys showing definite signs. At age 12-13, almost all girls (93%) and two-thirds of boys (66%) were showing definite signs of the onset of puberty.
Looking at the percentage of boys and girls at each stage of development, according to puberty category scores shows a similar picture (Table 6.6). At age 8-9, the majority of boys (96%) were in the pre-pubertal stage, 3% were early pubertal and only 1% were mid-pubertal. By age 10-11, 61% of boys were pre-pubertal, 27% were early pubertal, 12% were mid pubertal and 1% were in the late pubertal stage. By the age of 12-13, only 24% of boys were pre-pubertal, 29% were early pubertal, 37% were mid-pubertal and 10% were late pubertal. The proportion of girls showing signs of puberty at age 8-9 was considerably higher than that of boys. At age 8-9, 63% of girls were pre-pubertal, 13% were in the early pubertal stage and 24% were in the mid-pubertal stage. At age 10-11, 17% of girls were pre-pubertal, 19% were in the early pubertal category, 58% were mid-pubertal and 5% were in the late pubertal stage. However, at the age of 12-13, only 1% of girls were pre-pubertal; 4% were in the early puberty stage; 38% were mid-pubertal; 53% were in the late puberty stage and 4% of girls were in the post-pubertal stage.
Notes: Percentages based on weighted data. # Estimate not reliable (cell count less than 20).
Source: LSAC K cohort, Waves 3, 4 & 5
In the previous tables, broad age categories, based on the wave of LSAC are used. This means that the age of children (e.g., within the "8-9 years" age group) may differ by up to two years. There is likely to be a considerable amount of variation in the pubertal status of children within these broad age groups. Looking at pubertal status according to the age of the child at the time of interview (in weeks) gives a more precise picture of the proportion of children showing signs of puberty at specific ages. In Figure 6.1, observations over Waves 3, 4 and 5 of LSAC are pooled and used to estimate the probability of showing signs of puberty at specific ages between 8 and 14.2
Figure 6.1: Predicted probability of showing signs of puberty, by age and gender
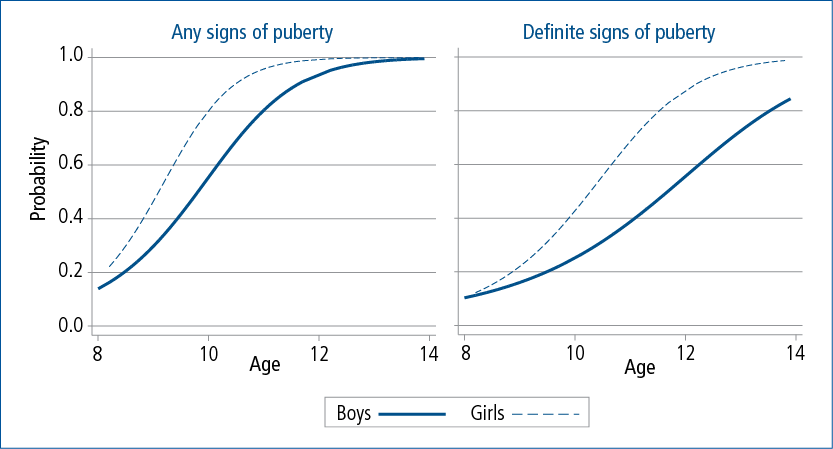
Notes: Logistic regression with observations pooled over three waves by age. Probabilities for boys and girls are estimated separately. For boys, n = 5,983. For girls, n = 5,748. For probability of any signs of puberty: Pseudo R-squared is 0.36 for boys and 0.43 for girls. For probability of definite signs of puberty: Pseudo R-squared is 0.18 for boys and 0.35 for girls.
Source: LSAC K cohort, Waves 3, 4, & 5
As expected, the predicted probability of showing any signs of puberty was higher for girls than for boys, particularly before the age of 12. After the age of 13, the proportion of boys and girls showing any signs of puberty started to converge, with almost all children showing at least some sign of the onset of puberty by the age of 14. However, gender differences in the proportion of children showing definite signs of puberty remained until the early teenage years. While almost all girls were showing definite signs of the onset of puberty at this age, for boys, the predicted probability of showing definite physical signs of puberty at the age of 14 was just over 80%.
6.4 Pubertal timing and family factors
Studies have shown that the timing of puberty is associated with family characteristics, such as household structure (i.e., whether the child is living with both biological parents, in a single-parent household, in a blended family with a step-parent or with neither of their biological parents), and inherited factors, particularly maternal pubertal timing. In this section, we examine the association between environmental factors (household structure, absence of the biological father) and the pubertal timing of parents and children's pubertal timing.
Pubertal timing and household structure
Table 6.7 shows the proportion of children showing any definite signs of puberty by whether their biological mother or biological father was living in their household at the time of interview.3 For boys and girls, the proportion showing definite signs of puberty was higher among those who were not primarily living with their biological father at ages 8-9, 10-11 and 12-13 years. However, the difference was only statistically significant for boys aged 12-13.
Notes: Percentages based on weighted data. Statistical significance is tested against the base category ("Yes") *** p < .001; ** p < .01 and * p < .05. #Estimate not reliable (cell count less than 20).
Source: LSAC K cohort, Waves 3, 4 & 5
Although not statistically significant, there appears to be a trend towards the proportion of boys and girls showing definite signs of puberty being lower among those who were not living primarily with their biological mother at age 8-9 and at age 12-13, and higher among children who were not living with their biological mother at age 10-11. The absence of any statistically significant differences is likely to be because the vast majority of children (at least 96% in each wave) were living with their biological mother at the time of interview.
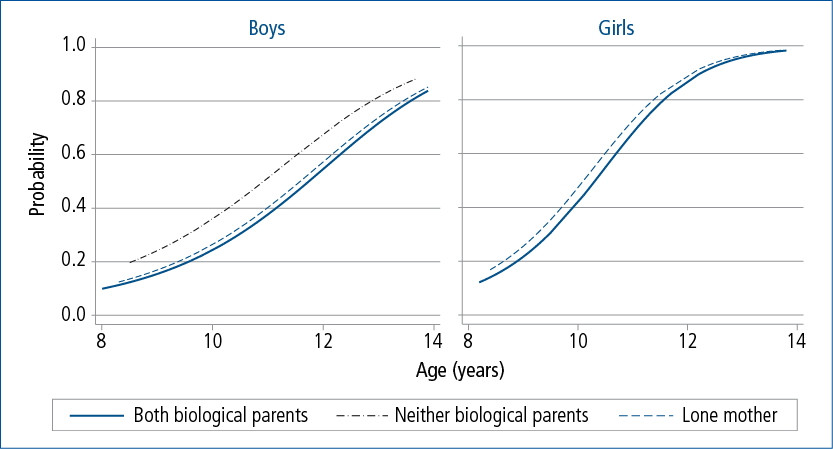
Using broad age categories, the differences in the proportion of children showing definite signs of puberty depending on whether they were primarily living with their biological parents were generally not statistically significant. However, logistic regressions using a more precise measure of age and pooling data over three waves of LSAC indicate that there is a significant association between the presence in the child's primary residence of the biological father and pubertal status for boys and girls.4 The differences in the predicted probability of showing signs of puberty, according to the presence of the biological father, are shown in Figure 6.2.
For girls, the predicted probability of showing signs of puberty was higher if there was no resident father at ages 8-11. However, by the age of 12, the difference was very small; and by the age of 13, when most girls were showing some signs of puberty, there was no observable difference in the predicted probability of puberty according to the presence of the biological father. For boys, the difference in predicted probability of showing signs of puberty was quite uniform across ages 8-14. This is likely to be because the onset and completion of puberty is later for boys than for girls, and therefore the factors influencing pubertal timing are likely to continue until a later age for boys compared to girls.
Figure 6.2 shows that there is a significant association between pubertal timing and the presence in the P1 household of the biological father for boys and girls. However, the size of this difference is quite small, with differences in the predicted probabilities of puberty for children with a father residing in the P1 household, compared to those who were not primarily living with their biological father, ranging from 1 to 5 percentage points, depending on the age and gender of the child. When additional factors that are known to influence pubertal timing are included in the models, the influence of the presence of the biological father was no longer statistically significant for boys or girls.5 This implies that while there is an association between the presence of the biological father and pubertal timing, there are other factors, such as the child's weight and whether they were breastfed until 6 months of age, that have a stronger influence on pubertal development.
Figure 6.2: Predicted probability of showing definite signs of puberty, by age, gender and presence of biological father
Notes: Logistic regression with observations pooled over three waves by age and presence of biological father. Probabilities for boys and girls estimated separately. For boys, n = 5,982, Pseudo R-squared = 0.18. For girls, n = 5,747, Pseudo R-squared = 0.35. Presence of biological father is significant at the 1% level for boys and the 5% level for girls.
Source: LSAC K cohort, Waves 3, 4 & 5
Studies have shown that the presence of a step-parent has a significant influence on pubertal timing, particularly for girls (Arim et al., 2007; Ellis & Garber, 2000). In Table 6.8, we examine the differences in proportions of children showing definite signs of puberty according to household structure - that is, whether a child lives with both their biological parents, in a single-parent household, with a biological parent and a step-parent or in a more complex household structure.6 Compared to children who were living with both their biological parents, a larger proportion of boys who were living in single-mother households at age 10-11 and girls in single-mother households at age 12-13 were showing definite signs of puberty. For all other household structures, there was no significant difference in the proportion showing definite signs of puberty. This lack of statistical significance is largely due to the small number of observations of children in these household types.
Notes: Percentages based on weighted data. Statistical significance is tested against the base category ("Yes") *** p < .001; ** p < .01 and * p < .05. # Estimate not reliable (cell count less than 20). a Includes step, foster or adoptive parents. Single-parent families include those with a "Parent 2" who is not a biological, step, foster or adoptive parent (i.e., a grandparent, other relative or unrelated adult).
Source: LSAC K cohort, Waves 3, 4 & 5
Estimates of the probability of showing definite signs of puberty, controlling only for age and household structure, indicate that for boys and girls, the predicted probability of showing definite signs of puberty was significantly higher for those in single-parent households, compared to those living with both their biological parents (Figure 6.3).7
Figure 6.3: Predicted probability of showing definite signs of puberty, by age, gender and household type
Notes: Logistic regression with observations pooled over three waves by age and presence of biological father. Probabilities for boys and girls estimated separately. For boys, n = 5,982, Pseudo R-squared = 0.18. For girls, n = 5,747, Pseudo R-squared = 0.35. Presence of biological father is significant at the 1% level for boys and the 5% level for girls.
Source: LSAC K cohort, Waves 3, 4 & 5
For boys and girls, the increase in the proportion of variation explained by the model that accounted for household structure, compared to the model that controlled only for age, was very small. This result suggests that there are other factors that have a stronger influence on pubertal timing than household structure. Furthermore, for boys and girls, the difference in the probability of showing signs of puberty for those in single-parent households was no longer statistically significant after controlling for other characteristics of the child.8 However, it is important to note that even using data pooled over three waves of LSAC, the number of children who were not living with their biological mother (either in a single-father household or with a step-mother) was quite small, and it is possible that the associations between pubertal timing and household structure would be statistically significant with a larger number of observations for children in these family types.9
The association between children's and parents' pubertal timing
Many studies have shown a significant association between mothers' pubertal timing, and their daughters' age at the onset of puberty (Ellis & Essex, 2007; Maisonet et al., 2010). A recent study analysing the DNA of more than 180,000 women found that the experience of menarche is influenced by "imprinted" genes, a small subset of genes whose activity differs depending on which parent passes on that gene (Perry et al., 2014). Their findings imply that one parent may more profoundly affect puberty timing in their daughters than the other parent, depending on which parent passes on that gene. However, there are no studies that we are aware of that examine the relationship between the pubertal timing of mothers and their sons, or fathers and their sons or daughters. In Table 6.9, we compare the proportions of boys and girls showing definite signs of puberty at each age based on their (biological) mother's retrospective self-report of her own pubertal timing.
Notes: Percentages based on weighted data. Sample is restricted to children whose biological mother responded to the question about pubertal timing. Statistical significance is tested against the base category ("About the same age as other kids"). *** p < .001; ** p < .01 and * p < .05.
Source: LSAC K cohort, Waves 3, 4 & 5
At the age of 8-9 years, while the proportion of boys showing signs of puberty ranged from 3% for those whose mothers reported starting puberty way behind other children to 8% for those who reported starting way ahead, these differences were not statistically significant. However, there was a significant difference in the proportion of boys showing definite signs of puberty at ages 10-11 and 12-13 according to their mother's pubertal timing. At age 10-11 years, the proportion of boys whose mother reported starting puberty later than others was lower than that of boys whose mother had their puberty about the same age as others (41% vs 55%). At age 12-13 years, 69% of boys whose mother started puberty about the same age as others showed definite signs of puberty. This proportion was significantly lower among boys whose mother started puberty behind (53%) or way behind (41%) other children.
Maternal pubertal timing was also associated with girls' own pubertal timing. At 8-9 years, a larger proportion of girls whose mother reported starting puberty ahead of most other children showed definite signs of puberty (25%), compared to girls whose mother started puberty about the same age as others (15%). At 10-11 years, the proportion of girls who were showing definite physical signs of puberty was higher among those whose mother reported starting puberty ahead or way ahead of others (84% and 87% respectively), compared to girls whose mothers said that they began puberty about the same age as their peers (73%) and girls whose mothers said they started puberty way after most other children (48%). While most girls were showing definite signs of puberty at the age of 12-13, there were still significant differences according to mothers' pubertal timing, with a larger proportion of girls whose mother started puberty ahead of her peers showing definite signs of puberty, and a smaller proportion of girls whose mothers started puberty behind or way behind their peers showing definite signs of puberty at this age.
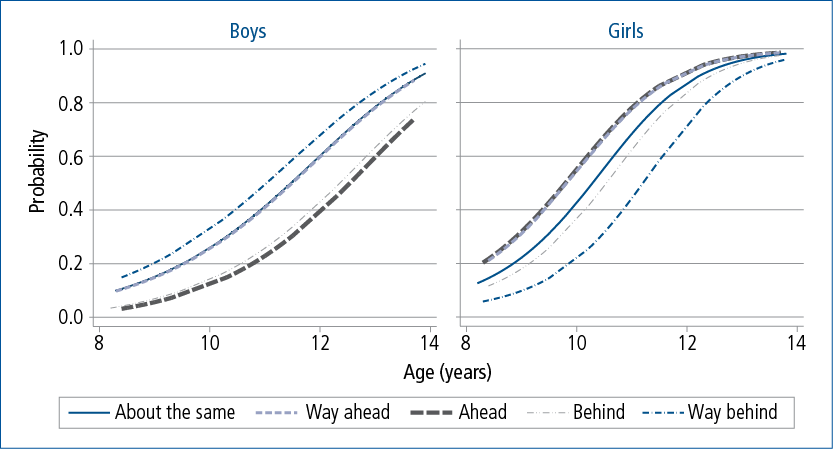
In Figure 6.4, the predicted probabilities of showing definite signs of puberty are compared, according to the mother's reports of her own pubertal timing. For boys, estimates controlling only for age and mother's pubertal timing indicated that compared to those whose mothers reported starting puberty at around the same time as their peers, the odds of showing signs of puberty were 1.3 times higher for boys whose mothers reported starting puberty way ahead of their peers; and for boys whose mother reported starting puberty either behind, or way behind her peers, the odds of showing definite signs of puberty were around half that of boys whose mother reported starting puberty at around the same time as her peers. After adjusting for characteristics known to be associated with pubertal timing, these differences remained statistically significant.10
Figure 6.4: Predicted probability of showing definite signs of puberty, by age, gender and mother’s pubertal timing
Notes: Logistic regression with observations pooled over three waves, by age and mother’s pubertal timing. Sample is restricted to children whose biological mother answered the question about pubertal timing. Probabilities for boys and girls estimated separately. For boys, N = 5,421, Pseudo R-squared = 0.18. For girls, N = 5,243, Pseudo R-squared = 0.36.
Source: LSAC K cohort, Waves 3, 4 & 5
The odds of showing definite signs of puberty were 1.6 times greater for girls whose mother reported starting puberty either ahead or way ahead of her peers, relative to girls whose mother reported starting puberty at around the same time as her peers. The odds of showing definite signs of puberty were 1.2 times greater for girls whose mother reported starting puberty at around the same time as her peers, relative to those whose mother reported starting puberty behind her peers; and 2.8 times greater for girls whose mother reported starting puberty at around the same time as her peers, relative to those whose mother reported starting puberty way behind her peers. These differences remained statistically significant even after accounting for characteristics of the child, such as health, birth weight and body mass index in the previous wave.11
In addition to parents' self-reported pubertal timing, the LSAC survey also asked the mothers of the study children at what age their own periods started. Table 6.10 compares the proportion of children showing definite signs of puberty according to their mothers' age at menarche.
About 2% of boys whose mother experienced menarche at age 15 or older showed signs of puberty at age 8-9 years. This proportion was significantly lower than that for boys whose mother experienced menarche between the age of 12 and 14 (7%). At 10-11 years, the proportion of boys showing definite signs of puberty was highest among those whose mother experienced menarche before the age of 12 (63%), followed by those whose mother experienced menarche at age 12-14 (51%) and those whose mother experienced menarche at age 15 or older (47%). There was a similar pattern at age 12-13, with 77% of boys whose mother experienced menarche before the age of 12 showing definite signs of puberty, compared to 65% of those whose mother experienced menarche at age 12-14 and 58% of boys whose mother experienced menarche at age 15 or older.
Notes: Percentages based on weighted data. Sample is restricted to children whose biological mother responded to the questions about pubertal timing. Statistical significance is tested against the base category ("Average") *** p < .001; ** p < .01 and * p < .05.
Source: LSAC K cohort, Waves 3, 4 & 5
For girls, there were significant differences in the proportion showing signs of puberty according to their mothers' age at menarche. Compared to girls whose mothers experienced menarche between the age of 12 and 14, the proportion of girls showing definite signs of puberty at age 8-9 was significantly higher among those whose mothers experienced menarche before the age of 12 (26% compared to 14%). At the age of 10-11, there were also significant differences in the proportion of girls showing definite signs of puberty, with 83% of girls whose mother experienced menarche before the age of 12 showing definite signs of puberty, compared to 73% of those whose mother experienced menarche at age 12-14 and 64% of girls whose mother experienced menarche at age 15 or older. By age 12-13, most girls were showing definite signs of puberty - and the differences according to mothers' age at menarche were smaller. Still, the proportion of girls showing definite signs of puberty was highest among those whose mother experienced menarche before the age of 12.
Estimates of the probability of showing definite signs of puberty according to mother's age at menarche are presented in Figure 6.5. For boys, the predicted probability of showing definite signs of puberty was 1.6 times greater among those whose mother experienced menarche before the age of 12, relative to those whose mother experienced menarche between the ages of 12 and 14; and the odds of showing definite signs of puberty were 1.5 times greater for those whose mother experienced menarche between the ages of 12 and 14, relative to boys whose mother experienced menarche at the age of 15 or older.
For girls, the predicted probability of showing definite signs of puberty was 1.7 times greater for those whose mother experienced menarche before the age of 12, relative to those whose mother experienced menarche between the ages of 12 and 14; and 4 times greater for girls whose mother experienced menarche between the ages of 12 and 14 relative to girls whose mother experienced menarche at the age of 15 or older. These differences remained statistically significant and similar in size even after accounting for other characteristics of the child.12
While many studies that have shown that a mother's pubertal timing is associated with the pubertal timing of their daughters, there are no studies that we are aware of that have examined the association between a father's pubertal timing on the pubertal timing of his sons and daughters. Table 6.11 shows that there is a significant association between a father's pubertal timing and the age at which their child begins to show definite signs of the onset of puberty.
Notes: Percentages based on weighted data. Sample is restricted to children whose biological father answered the question about pubertal timing. Statistical significance is tested against the base category ("About the same age as other kids") *** p < .001; ** p < .01 and * p < .05.
Source: LSAC K cohort, Waves 3, 4 & 5
For boys, differences in the proportion showing definite signs of puberty according to their father's reports of their own pubertal timing were only significant at age 12-13, with fewer boys whose father started puberty later than his peers showing definite signs of puberty (55%) compared to boys whose father started puberty around the same age as his peers (67%). For girls, there were no significant differences in the proportion showing signs of puberty at the age of 8-9 according to their father's reports of his pubertal timing. However, at age 10-11 years, the proportion of girls showing definite signs of puberty was higher among those whose father reported starting puberty way ahead of most other kids, compared to girls whose father started puberty at around the same age as other kids.
At 10-11 years, girls whose father began puberty way ahead of other children were more likely to be showing definite signs of puberty (95%) than girls whose father began puberty around the same age as their peers (73%) and girls whose father reported starting puberty behind or way behind other children (61% and 42% respectively). At age 12-13, the proportion of girls showing definite signs of puberty was also significantly lower among those whose father reported starting puberty behind or way behind most other kids, compared to those whose father reported starting puberty at around the same time as his peers.
Estimates of the predicted probability of showing definite signs of puberty, according to fathers' reports of their own pubertal timing are presented in Figure 6.6. For boys, those whose father reported starting puberty at around the same time as his peers, the odds of showing definite signs of puberty were 1.4 times greater, relative to those whose father reported starting puberty behind his peers; and 2.1 times greater, relative to boys whose father reported starting puberty way behind his peers. However, the difference between the predicted probability of showing definite signs of puberty for boys whose father reported starting ahead or way ahead of his peers, compared to those whose father reported starting puberty at around the same time as most other kids was not statistically significant.
Figure 6.6: Predicted probability of showing any signs of puberty, by age, gender and father’s pubertal timing
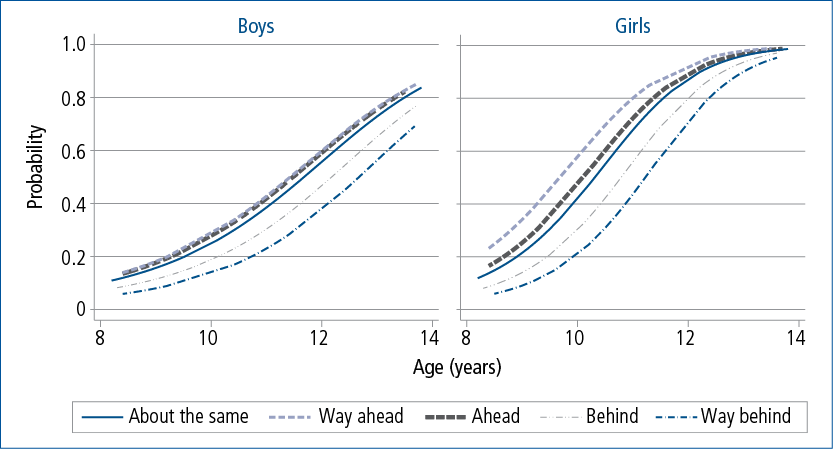
Notes: Logistic regression with observations pooled over three waves, by age and father’s pubertal timing. Sample is restricted to children whose biological father answered the question about pubertal timing. Probabilities for boys and girls estimated separately. For boys, N
= 3,714, Pseudo R-squared = 0.18. For girls, N = 3,760, Pseudo R-squared = 0.36.
Source: LSAC K cohort, Waves 3, 4 & 5
For girls, the odds of showing definite signs of puberty were 1.7 times greater among those whose father reported starting puberty way ahead of his peers, compared to those whose father reported starting at around the same time as most other kids (although this difference was only marginally significant, p < .1). For girls whose father reported starting puberty at around the same time as most other kids, the odds of showing definite signs of puberty were 1.7 times greater, relative to those whose father reported starting behind his peers, and 2.7 times greater relative to girls whose father reported starting way behind his peers. For boys and girls, these differences in the estimated probability of showing definite signs of puberty remained statistically significant even after accounting for other characteristics of the child that are known to be associated with pubertal timing.13
Previous studies of the association between maternal age at menarche and children's pubertal development have focused on the pubertal timing of daughters. The results in this chapter show that mother's pubertal timing is significantly associated with not only the pubertal timing of their daughters, but also with the pubertal timing of sons. Furthermore, there is a significant association between fathers' reports of their own pubertal timing and the pubertal timing of their sons and daughters. These associations remain statistically significant even after controlling for other characteristics that are known to influence pubertal timing.
6.5 Pubertal status and socio-emotional outcomes
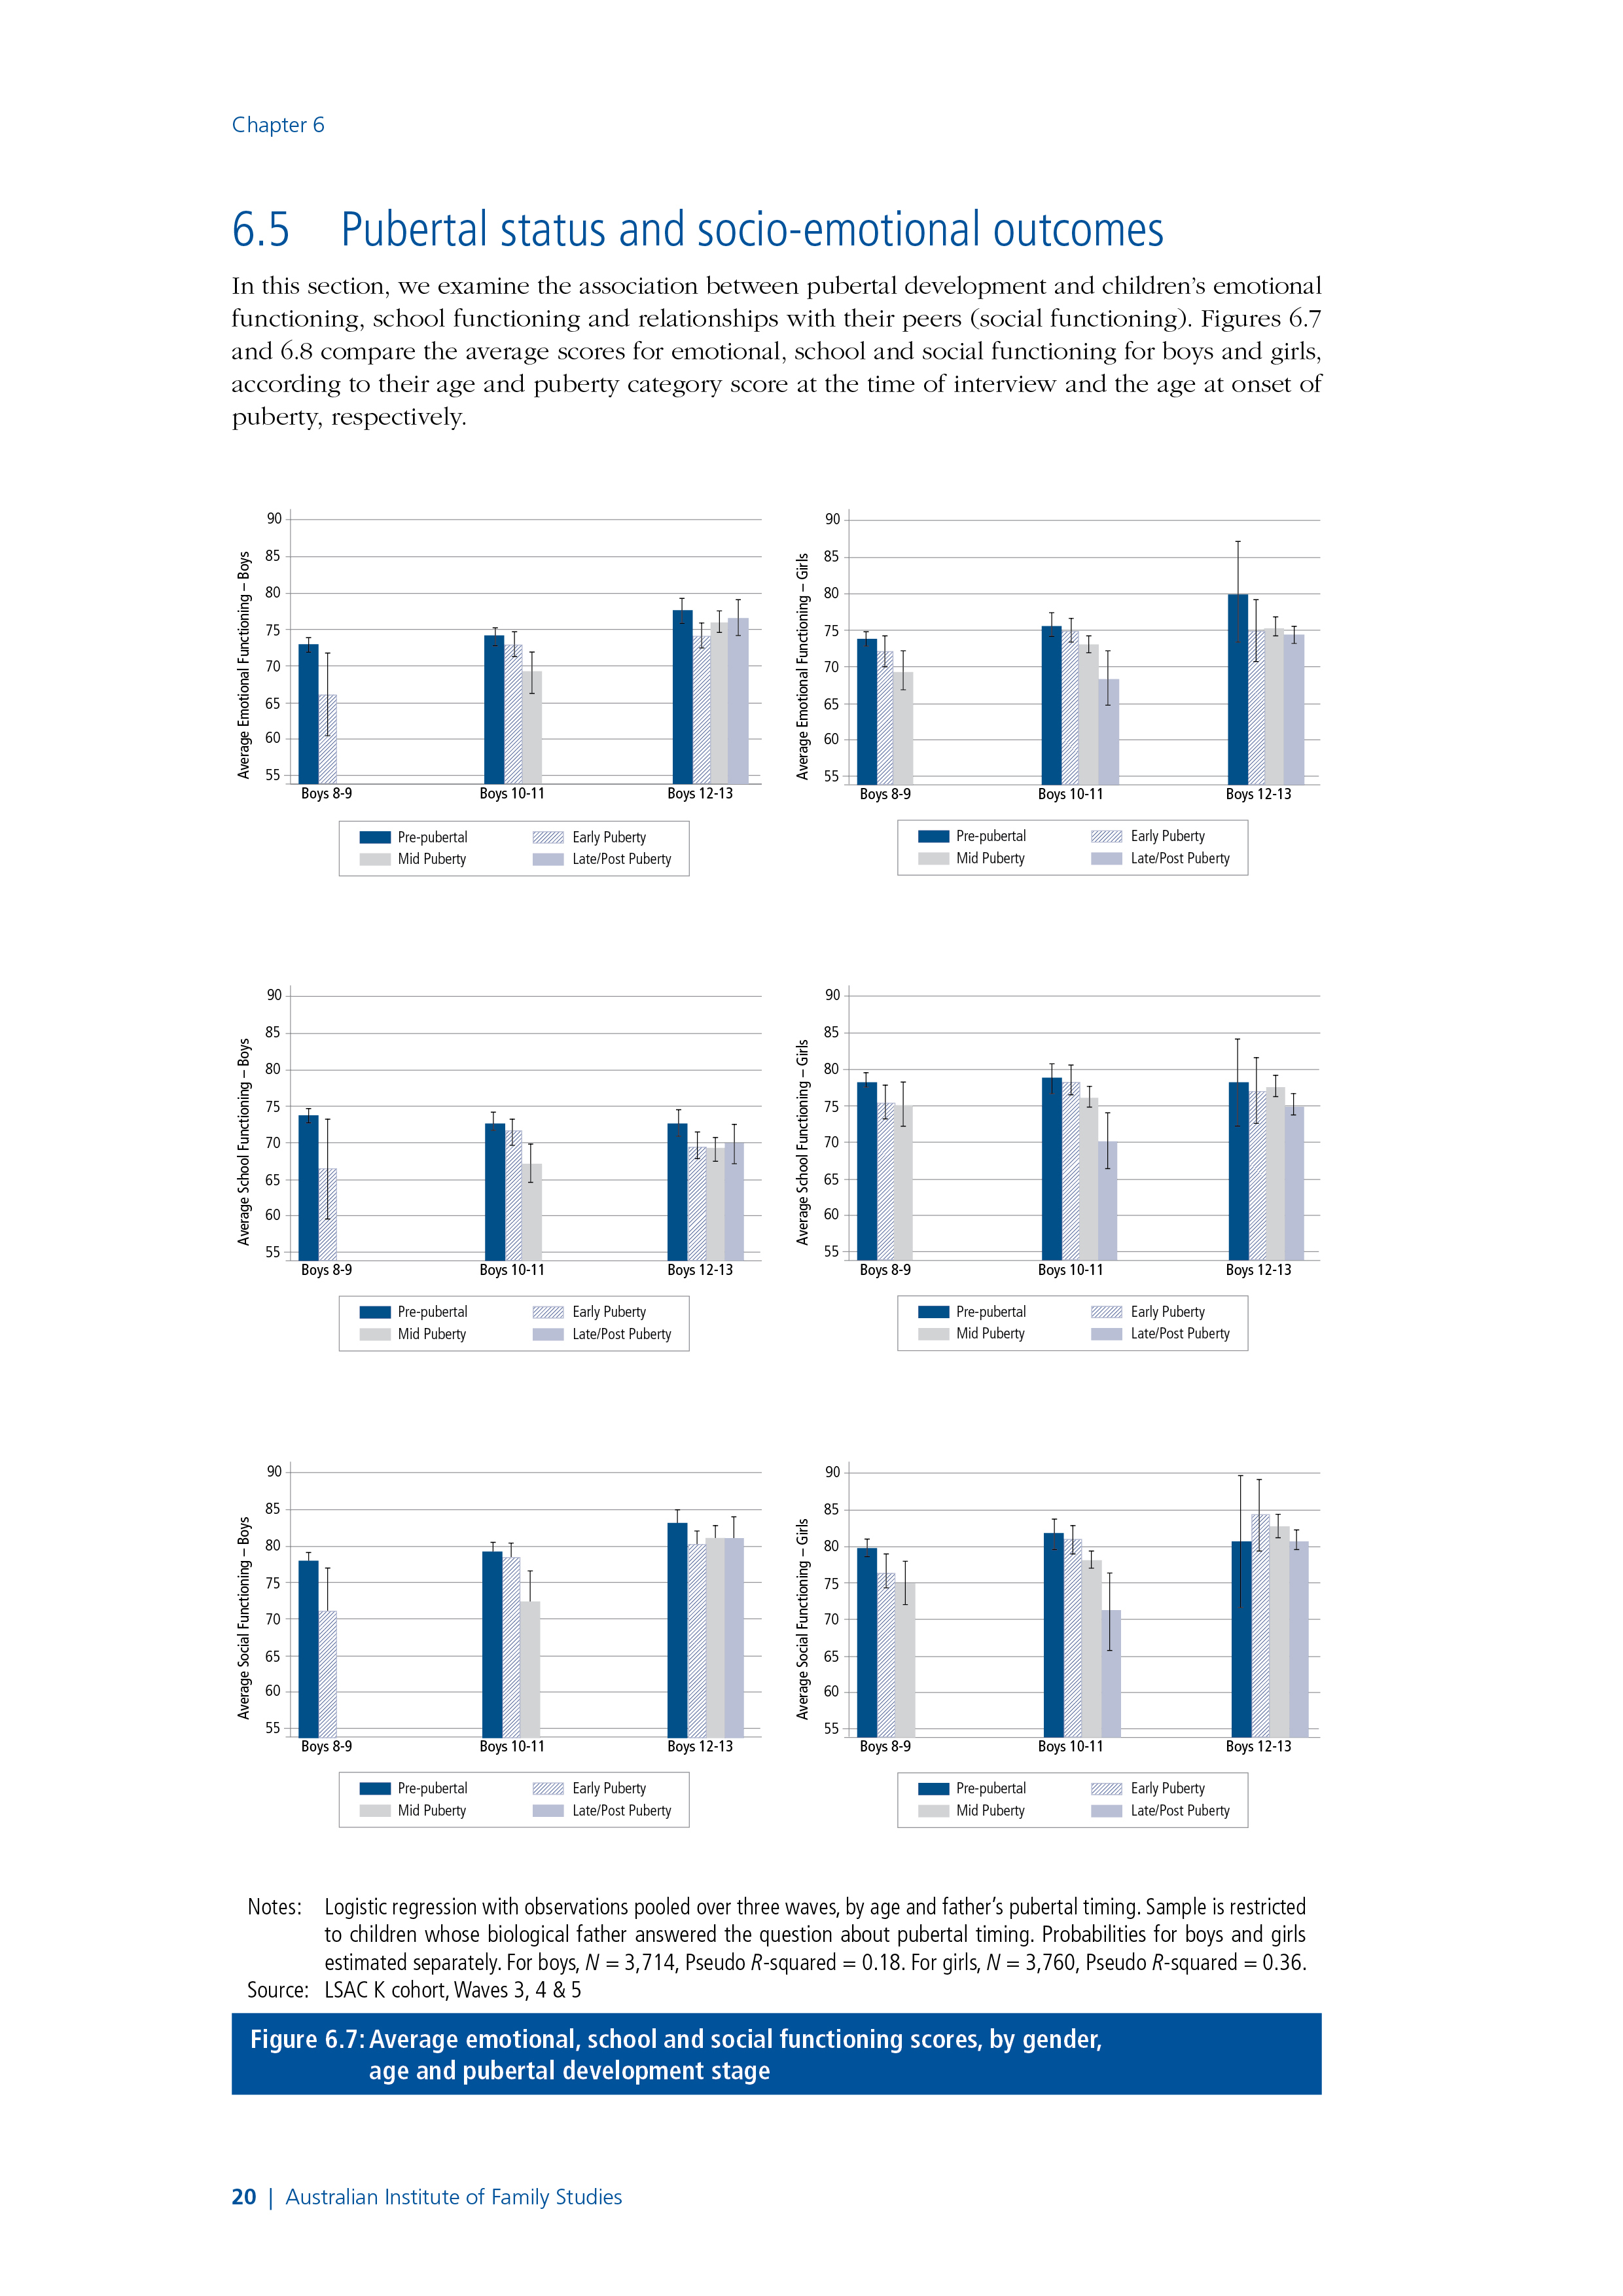
In this section, we examine the association between pubertal development and children's emotional functioning, school functioning and relationships with their peers (social functioning). Figure 6.7 and figure 6.8 compare the average scores for emotional, school and social functioning for boys and girls, according to their age and puberty category score at the time of interview and the age at onset of puberty, respectively.
Figure 6.7: Average emotional, school and social functioning scores, by gender, age and pubertal development stage
Notes: Logistic regression with observations pooled over three waves, by age and father’s pubertal timing. Sample is restricted to children whose biological father answered the question about pubertal timing. Probabilities for boys and girls estimated separately. For boys, N
= 3,714, Pseudo R-squared = 0.18. For girls, N = 3,760, Pseudo R-squared = 0.36.
Source: LSAC K cohort, Waves 3, 4 & 5
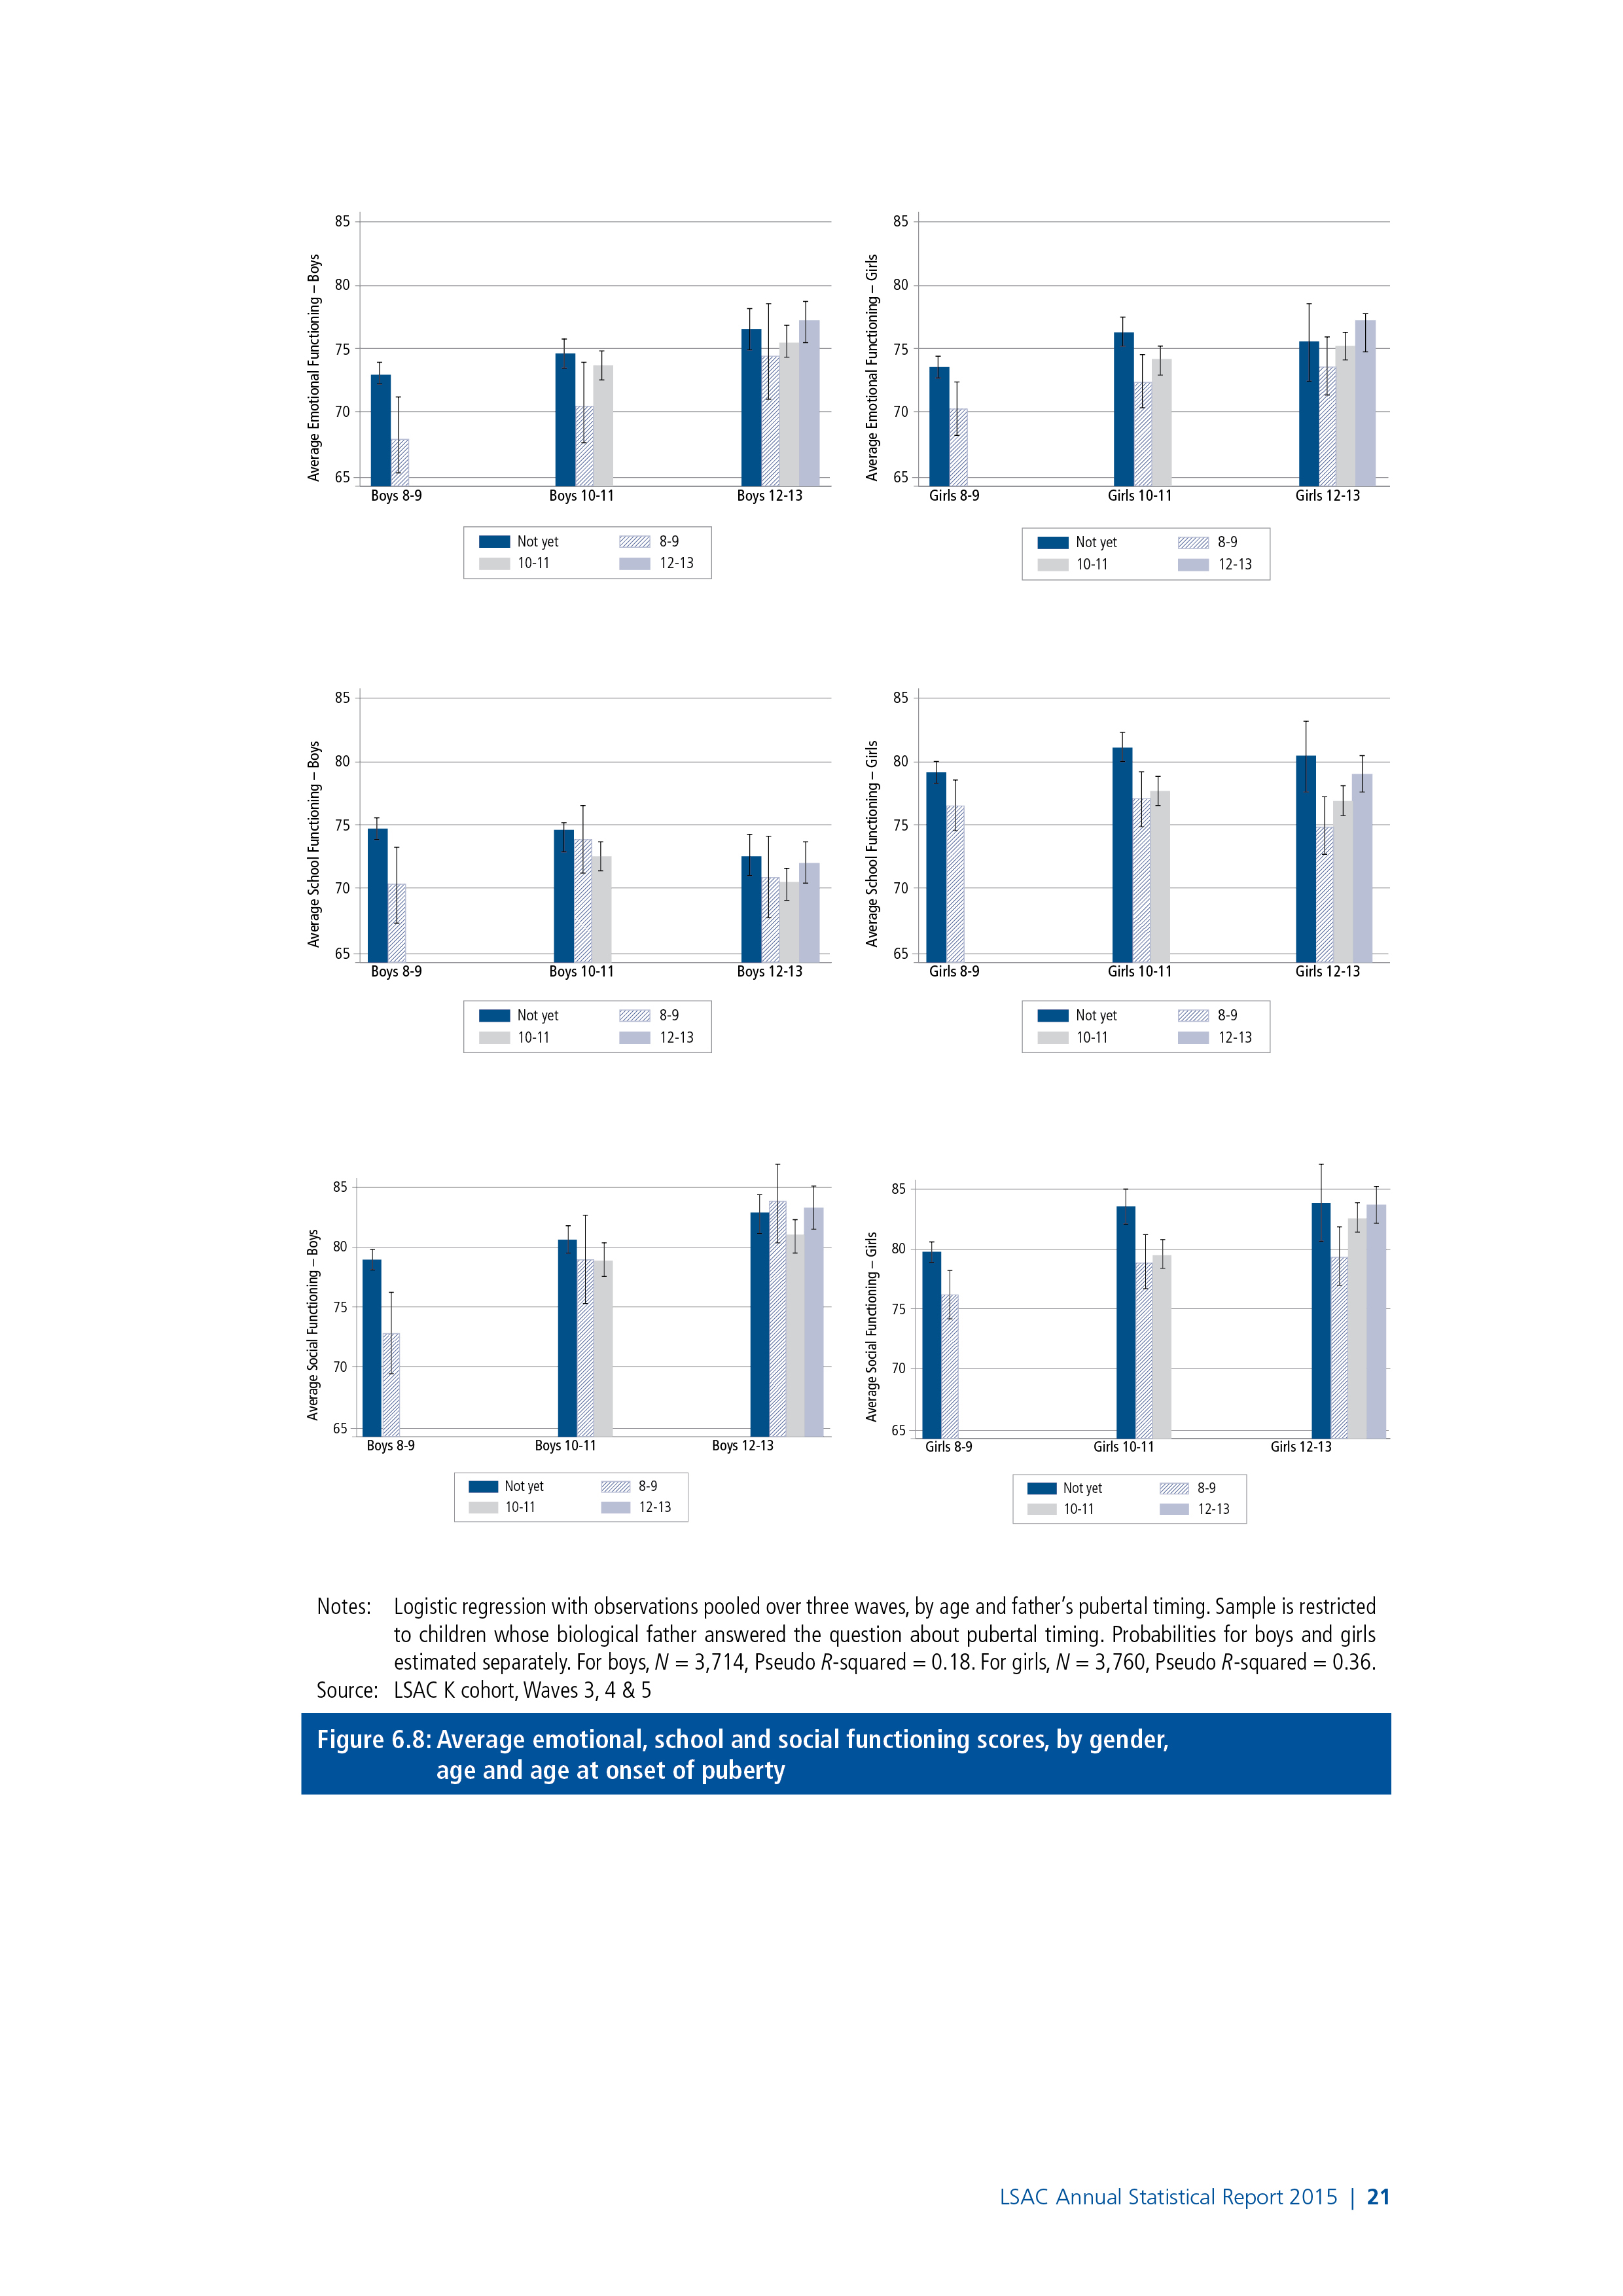
Figure 6.8: Average emotional, school and social functioning scores, by gender, age and age at onset of puberty
Notes: Logistic regression with observations pooled over three waves, by age and father’s pubertal timing. Sample is restricted to children whose biological father answered the question about pubertal timing. Probabilities for boys and girls estimated separately. For boys, N = 3,714, Pseudo R-squared = 0.18. For girls, N = 3,760, Pseudo R-squared = 0.36.
Source: LSAC K cohort, Waves 3, 4 & 5
At age 8-9:
- The majority of boys (96%) and girls (74%) were in the pre-pubertal stage.
- Compared to boys in the pre-pubertal stage, average scores for emotional, school and social functioning were approximately 7 points (0.4 standard deviations) lower for those in the early puberty stage. However, it is important to note that at this age, most boys (96%) were still in the pre-pubertal stage.14
- For girls, average scores for emotional, school and social functioning were 3-5 points (0.2 to 0.3 standard deviations) lower for girls in the mid-pubertal stage compared to girls in the pre-pubertal stage.
At age 10-11:
- Compared to boys in the pre-pubertal stage, average scores for emotional, school and social functioning were 5-7 (0.3 standard deviations) points lower for boys in the mid-pubertal stage.
- For boys, differences in average scores for emotional, school and social functioning were not statistically significant according to age at onset of puberty.
- For girls, average functioning scores were lower for those in the later stages of pubertal development. Compared to girls in the pre-pubertal stage, average functioning scores were 7-9 points (0.4 to 0.5 standard deviations) lower for girls in the late or post-pubertal stage.
- Average scores for emotional, school and social functioning were lowest among those who started puberty at age 8-9 and highest among those who had not yet experienced the onset of puberty.
At age 12-13:
- Average emotional, school and social functioning scores for boys in the early pubertal stage were approximately 3 points (0.2 standard deviations) lower than those of boys in the pre-pubertal stage. However, there were no significant differences between average functioning scores for boys in the early, mid or late/post stages of puberty.
- Differences in the average emotional, school and social functioning scores for boys, according to the age at onset of puberty were not statistically significant.
- More than half (54%) of girls were in the late/post pubertal stage and there were no significant differences in average emotional, school and social functioning scores according to pubertal status.
- For girls, average scores for emotional, school and social functioning increased with age at the onset of puberty. However, for emotional functioning, these differences were not statistically significant.
For boys, differences in emotional, school and social functioning scores were smaller but still statistically significant even after accounting for characteristics that are known to be associated with social outcomes.15 scores were generally around 2-4 points (0.2 to 0.3 standard deviations) lower for boys in early or mid puberty compared to those in the pre-pubertal stage.
For girls, there was no significant difference in emotional functioning scores at age 8-9 after adjusting for socio-demographic characteristics. However, adjusted school and social functioning scores were 2-3 points (0.1 to 0.2 standard deviations) lower for girls in the early and mid-pubertal stages compared to those in the pre-pubertal stage. At age 10-11, compared to girls in the pre-pubertal stage, adjusted scores for school functioning were 5 points (0.3 standard deviations) lower for those in the late or post-pubertal stages. For social functioning, the differences were smaller, with adjusted scores around 2 points (0.1 standard deviation) lower for girls in the mid-pubertal stage compared to those in the late-pubertal stage.16
As expected, given the unadjusted functioning scores for girls at age 12-13 were not significantly different according to pubertal status, there were no significant differences in adjusted functioning scores for girls at age 12-13.
These results are consistent with previous studies that have shown that early maturing adolescents are more likely to have psychological and behavioural problems (Ge, Brody, Conger, Simons, & Murry, 2002; Ge et al., 2003). For boys, differences in average functioning scores were largest among those who had started showing signs of puberty at an early age, compared to those who had not. While these differences became smaller as boys got older, there were still significant differences in functioning scores at the age of 12-13, even after accounting for socio-demographic characteristics. For girls, there were also significant differences in average functioning scores, with girls who were showing definite signs of puberty at age 8-9 having significantly lower functioning scores, on average, compared to girls who were not yet showing signs of puberty. These differences were largest at age 10-11, with average functioning scores decreasing substantially with the level of pubertal development at this age. However, at age 12-13, the majority of girls were in the mid or late stages of puberty, and differences in functioning scores according to pubertal status were not statistically significant. While there were clear differences in average functioning scores at the age of 8-9 for those girls and boys who had experienced the onset of puberty, compared to those who had not, differences in functioning scores at age 12-13 according to the age at onset of puberty were not statistically significant. These results suggest that while some children who experience the onset of puberty at a younger age may experience difficulties; as they progress through adolescence and the variation in the physical signs of pubertal development among their peers becomes less evident, differences in emotional, school and social functioning become less significant.17
6.6 Summary and discussion
The onset of pubertal development has been widely viewed as an important marker of the transition into adolescence. This chapter has provided a nationally representative picture of the variations in the physical signs of the onset of puberty of Australian children aged 8-9 to 12-13 years. On average, girls started puberty earlier than boys, but at age 8-9 most children had not started showing any signs of puberty. The proportion of children showing definite signs of puberty increased substantially between the ages of 8-9 and 10-11 years, and by age 12-13, almost all girls and two-thirds of boys were showing definite signs of the onset of puberty.
This chapter examined two specific factors that have been shown to be important influences on pubertal timing - household structure and parents' pubertal timing. Our analysis indicates that there is a significant association between the pubertal timing of boys and girls and the presence of their biological father, but the presence or absence of their biological mother was not statistically significant. However, when covariates were included in the models, the influence of the presence of the biological father was no longer statistically significant for boys or girls. Similarly, estimates of the association between pubertal status and household structure showed that compared to children living with both parents, boys and girls living in single-mother households, boys living with neither parent and girls living in father-stepmother households were more likely to show physical signs of puberty at a younger age. However, after controlling for other characteristics that are known to influence pubertal timing, these differences were no longer statistically significant. The lack of statistical significance for these variables is inconsistent with some previous studies that have found significant associations between family structure and the early pubertal timing of daughters (Boagaert, 2008; James et al., 2012; Quinlan, 2003) and/or sons (Arim et al., 2007; Kim & Smith, 1998). In our analyses we were able to control for a wider range of factors (e.g., birth order, low birth weight, child health and weight) compared to other studies, which is likely to account for the different findings reported here.
Previous research has suggested that early maternal pubertal timing predicts the early onset of puberty among daughters. For example, Ellis and Essex (2007) found that a mother's age at menarche was significantly associated with her daughter's pubertal timing. Consistent with previous studies, we found that girls whose mother reported starting puberty earlier than others were more likely to show definite signs of puberty at an early age. We also found a significant association between the pubertal timing of mothers and sons, with boys whose mother reported starting puberty behind her peers less likely to be showing definite signs of the onset of puberty at a younger age; and boys whose mother experienced menarche before the age of 12 more likely to be showing definite physical signs of the onset of puberty. While several studies have documented the association between the pubertal timing of mothers and daughters, to the best of our knowledge, there are no previous studies of the association between the pubertal timing of fathers and their children. This lack of evidence is presumably due to a lack of available data related to the pubertal timing of fathers and their children. In this chapter, we find a significant association between fathers' reports of their own pubertal timing and the pubertal timing of their sons and daughters, with the likelihood of a child showing definite signs of puberty significantly lower among those whose father reported starting puberty later than his peers. These associations remained statistically significant even after controlling for other characteristics that are known to influence pubertal timing.
We also investigated the association between pubertal status and children's emotional, social and school functioning levels. Poorer emotional, school and social functioning was observed among children showing advanced stages of puberty earlier than their peers; and differences in functioning scores become smaller and less significant with age, as the levels of pubertal maturation became more similar within peer groups.
These results suggest that it is the early onset of puberty compared to peers, rather than the stage of pubertal development, that is most problematic for children's emotional, social and school functioning; and these differences become less problematic as adolescents begin to reach a similar level of physical development.18 These findings are consistent with previous research that have shown that the rapid physical changes during puberty are accompanied by substantial changes in social roles and relationships, which in turn may influence adolescents' interactions with their peers (Paikoff & Brooks-Gunn, 1991). Early maturing adolescents have been shown to be more likely to have psychological and behavioural problems and are susceptible to the adverse effects of interpersonal stressors (Natsuaki et al., 2009), partly because they may not be emotionally or cognitively ready for the physical and social changes accompanying puberty (Ge et al., 2002).
Our findings suggest that the early onset of puberty may put young adolescents at risk of emotional distress, peer relationship problems and poorer school functioning in the short term. However, these issues are generally short-lived; and are not generally sustained into later adolescence. These results have implications for how schools and parents might best help children prepare for this important life transition. Considering the possible socio-emotional distress that is triggered by physical changes during puberty, programs focused on fostering social acceptance of varying physical appearance and on promoting positive self-esteem may prove effective. Adolescence is an important time in the development of emotional awareness, when relationships with peers become increasingly important and valued. Therefore, educational programs that focus on peer support and anti-bullying are likely to be of particular value during early adolescence.
6.7 References
Al-Sahab, B., Adair, L., Hamadeh, M. J., Ardern, C. I., & Tamim, H. (2011). Impact of breastfeeding duration on age at menarche. American Journal of Epidemiology, 173(9), 971-977.
Arim, R. G., Shapka, J. D., Dahinten, V. S., & Willms, J. D. (2007). Patterns and correlates of pubertal development in Canadian youth: Effects of family context. Canadian Journal of Public Health/Revue Canadienne de Sante'e Publique, 91-96.
Bellis, M., Downing, J. and Ashton, J. (2006). Adults at 12? Trends in puberty and their public health consequences. Journal of Epidemiology and Community Health, 60(11), 910-911.
Belsky, J., Steinberg, L., & Draper, P. (1991). Childhood experience, interpersonal development, and reproductive strategy: An evolutionary theory of socialization. Child Development, 62(4), 647-670.
Bogaert, A. F. (2008). Menarche and father absence in a national probability sample. Journal of Biosocial Science, 40(04), 623-636.
Caspi, A., & Moffitt, T. E. (1991). Individual differences are accentuated during periods of social change: the sample case of girls at puberty. Journal of Personality and Social Psychology, 61(1), 157.
Conley, C. S., & Rudolph, K. D. (2009). The emerging sex difference in adolescent depression: Interacting contributions of puberty and peer stress. Development and Psychopathology, 21(2), 593-620.
Copeland, W., Shanahan, L., Miller, S., Costello, E. J., Angold, A., & Maughan, B. (2010). Outcomes of early pubertal timing in young women: A prospective population-based study.
Crockett, L. J., & Petersen, A. C. (1987). Pubertal status and psychosocial development: Findings from the early adolescence study. Faculty Publications, Department of Psychology, Paper 227. Lincoln: Univeristy of Nebraska-Lincoln.
Davison, K. K., Susman, E. J., & Birch, L. L. (2003). Percent body fat at age 5 predicts earlier pubertal development among girls at age 9. Pediatrics, 111(4), 815-821.
Del Giudice, M. (2009). Sex, attachment, and the development of reproductive strategies. Behavioral and Brain Sciences, 32(01), 1-21.
Downing, J., & Bellis, M. A. (2009). Early pubertal onset and its relationship with sexual risk taking, substance use and anti-social behaviour: A preliminary cross-sectional study. BMC Public Health, 9(1), 446.
Dubas, J. S., Graber, J. A., & Petersen, A. C. (1991). The effects of pubertal development on achievement during adolescence. American Journal of Education, 444-460.
Ellis, B. J. (2004). Timing of pubertal maturation in girls: An integrated life history approach. Psychological Bulletin, 130(6), 920.
Ellis, B. J., & Essex, M. J. (2007). Family environments, adrenarche, and sexual maturation: A longitudinal test of a life history model. Child Development, 78(6), 1799-1817.
Ellis, B. J., & Garber, J. (2000). Psychosocial antecedents of variation in girls' pubertal timing: Maternal depression, stepfather presence, and marital and family stress. Child Development, 71(2), 485-501.
Ge, X., Brody, G. H., Conger, R. D., Simons, R. L., & Murry, V. M. (2002). Contextual amplification of pubertal transition effects on deviant peer affiliation and externalizing behavior among African American children. Developmental Psychology, 38(1), 42-54.
Ge, X., Conger, R. D., & Elder, G. H. (2001a). Pubertal transition, stressful life events, and the emergence of gender differences in adolescent depressive symptoms. Developmental Psychology, 37(3), 404-417.
Ge, X., Conger, R. D., & Elder, G. H. (2001b). The relation between puberty and psychological distress in adolescent boys. Journal of Research on Adolescence, 11(1), 49-70.
Ge, X., Kim, I. J., Brody, G. H., Conger, R. D., Simons, R. L., Gibbons, F. X., & Cutrona, C. E. (2003). It's about timing and change: Pubertal transition effects on symptoms of major depression among African American youths. Developmental Psychology, 39(3), 430-439.
Huddleston, J., & Ge, X. (2003). Boys at puberty: Psychosocial implications. Gender differences at puberty, 113-134.
Huerta, R., & Brizuela-Gamiño, O. L. (2002). Interaction of pubertal status, mood and self-esteem in adolescent girls. The Journal of Reproductive Medicine, 47(3), 217-225.
James, J., Ellis, B. J., Schlomer, G. L., & Garber, J. (2012). Sex-specific pathways to early puberty, sexual debut, and sexual risk taking: Tests of an integrated evolutionary-developmental model. Developmental Psychology, 48(3), 687.
Kail, R., & Cavanaugh, J. (2010). Human development: A life span view, Wadsworth: Cengage Learning.
Kale, A., Deardorff, J., Lahiff, M., Laurent, C., Greenspan, L. C., Hiatt, R. A. et al. (2014). Breastfeeding versus formula-feeding and girls' pubertal development. Maternal and Child Health Journal, 1-9.
Kaltiala-Heino, R., Marttunen, M., Rantanen, P., & Rimpelä, M. (2003). Early puberty is associated with mental health problems in middle adolescence. Social Science & Medicine, 57(6), 1055-1064.
Kim, K., & Smith, P. K. (1998). Retrospective survey of parental marital relations and child reproductive development. International Journal of Behavioral Development, 22(4), 729-751.
Kretsch, N., Mendle, J., & Harden, K. P. (2014). A Twin Study of Objective and Subjective Pubertal Timing and Peer Influence on Risk‐Taking. Journal of Research on Adolescence. doi 10.1111/jora.12160.
Kuzawa, C. W., McDade, T. W., Adair, L. S., & Lee, N. (2010). Rapid weight gain after birth predicts life history and reproductive strategy in Filipino males. Proceedings of the National Academy of Sciences, 107(39), 16800-16805.
Lee, J. M., Kaciroti, N., Appugliese, D., Corwyn, R. F., Bradley, R. H., & Lumeng, J. C. (2010). Body mass index and timing of pubertal initiation in boys. Archives of Pediatrics & Adolescent Medicine, 164(2), 139-144.
Maisonet, M., Christensen, K. Y., Rubin, C., Holmes, A., Flanders, W. D., Heron, J. et al. (2010). Role of prenatal characteristics and early growth on pubertal attainment of British girls. Pediatrics, 126(3), e591-e600.
Marshall, W. A., & Tanner, J. M. (1969). Variations in the pattern of pubertal changes in girls. Archives of the Diseases in Childhood, 44, 291-303.
Marshall, W. A., & Tanner, J. M. (1970). Variations in the pattern of pubertal changes in boys. Archives of the Diseases in Childhood, 45, 13-23.
Marshall, S. J., Gorely, T., & Biddle, S. J. (2006). A descriptive epidemiology of screen-based media use in youth: A review and critique. Journal of adolescence, 29(3), 333-349.
Mendle, J., Turkheimer, E., & Emery, R. E. (2007). Detrimental psychological outcomes associated with early pubertal timing in adolescent girls. Developmental Review, 27(2), 151-171.
Mendle, J., Harden, K. P., Brooks-Gunn, J., & Graber, J. A. (2012). Peer relationships and depressive symptomatology in boys at puberty. Developmental psychology, 48(2), 429-435.
Mensah, F. K., Bayer, J. K., Wake, M., Carlin, J. B., Allen, N. B., & Patton, G. C. (2013). Early puberty and childhood social and behavioral adjustment. Journal of Adolescent Health, 53(1), 118-124.
Mustanski, B. S., Viken, R. J., Kaprio, J., Pulkkinen, L., & Rose, R. J. (2004). Genetic and environmental influences on pubertal development: Longitudinal data from Finnish twins at ages 11 and 14. Developmental Psychology, 40(6), 1188.
Natsuaki, M. N., Klimes-Dougan, B., Ge, X., Shirtcliff, E. A., Hastings, P. D., & Zahn-Waxler, C. (2009). Early pubertal maturation and internalizing problems in adolescence: Sex differences in the role of cortisol reactivity to interpersonal stress. Journal of Clinical Child & Adolescent Psychology, 38(4), 513-524.
Ong, K. K., Emmett, P., Northstone, K., Golding, J., Rogers, I., Ness, A. R. et al. (2009). Infancy weight gain predicts childhood body fat and age at menarche in girls. The Journal of Clinical Endocrinology & Metabolism, 94(5), 1527-1532.
Paikoff, R. L., & Brooks-Gunn, J. (1991). Do parent-child relationships change during puberty? Psychological Bulletin, 110(1), 47.
Parent, A.-S., Teilmann, G., Juul, A., Skakkebaek, N. E., Toppari, J., & Bourguignon, J.-P. (2003). The timing of normal puberty and the age limits of sexual precocity: Variations around the world, secular trends, and changes after migration. Endocrine Reviews, 24(5), 668-693.
Perry, J., Day, F., Elks, C., Sulem, P., Thompson, D., Ferreira, T. et al. (2014). Parent-of-origin-specific allelic associations among 106 genomic loci for age at menarche. Nature. 514, 92-97.
Quinlan, R. J. (2003). Father absence, parental care, and female reproductive development. Evolution and Human Behavior, 24(6), 376-390.
Reardon, L. E., Leen-Feldner, E. W., & Hayward, C. (2009). A critical review of the empirical literature on the relation between anxiety and puberty. Clinical Psychology Review, 29(1), 1-23.
Roeser, R. W., van der Wolf, K., & Strobel, K. R. (2001). On the relation between social-emotional and school functioning during early adolescence: Preliminary findings from Dutch and American samples. Journal of School Psychology, 39(2), 111-139.
Rowe, R., Maughan, B., Worthman, C. M., Costello, E. J., & Angold, A. (2004). Testosterone, antisocial behavior, and social dominance in boys: pubertal development and biosocial interaction. Biological Psychiatry, 55(5), 546-552.
Savin-Williams, R. C., & Berndt, T. J. (1990). Friendship and peer relations. In S. S. Feldman & G. R. Elliott (Eds.), At the threshold: The developing adolescent (pp. 277-307). Cambridge, MA: Harvard University Press.
Scarpa, A. (2004). The effects of child maltreatment on the hypothalamic-pituitary-adrenal axis. Trauma, Violence, & Abuse, 5(4), 333-352.
Staiano, A. E., Broyles, S. T., Gupta, A. K., Malina, R. M., & Katzmarzyk, P. T. (2013). Maturity‐associated variation in total and depot‐specific body fat in children and adolescents. American Journal of Human Biology, 25(4), 473-479.
Terry, M. B., Ferris, J. S., Tehranifar, P., Wei, Y., & Flom, J. D. (2009). Birth weight, postnatal growth, and age at menarche. American Journal of Epidemiology, 170(1), 72-79..
Towne, B., Czerwinski, S. A., Demerath, E. W., Blangero, J., Roche, A. F., & Siervogel, R. M. (2005). Heritability of age at menarche in girls from the Fels Longitudinal Study. American Journal of Physical Anthropology, 128(1), 210-219.
Varni, J. W., Burwinkle, T. M., & Seid, M. (2006). The PedsQLTM 4.0 as a school population health measure: Feasibility, reliability, and validity. Quality of Life Research, 15(2), 203-215.
Yousefi, M., Karmaus, W., Zhang, H., Roberts, G., Matthews, S., Clayton, B., & Arshad, S. H. (2013). Relationships between age of puberty onset and height at age 18 years in girls and boys. World Journal of Pediatrics, 9(3), 230-238.
1 For children whose parents have separated, who spend time in two households, this measure is based on the household in which the child lives most of the time (i.e., the household of P1).
2 In the logistic regressions presented in this chapter, age (in weeks) squared, rather than linear age, is included in the models to account for the fact that the probability of showing signs of puberty increases at a decreasing rate. That is, as more children show signs of puberty, the growth in the probability of showing signs of puberty slows down, and the curves eventually level off.
3 The increase in the number of observations between Wave 3 and Wave 4 is due to changes in the data collection. In Wave 3, these questions were asked in the self-completion questionnaire, while in Wave 4 they were asked in the main interview. These changes in data collection methods are described in more detail in the introduction of this Report.
4 Estimates of the association between pubertal status and the presence of the biological mother were not statistically significant, even before accounting for other factors associated with pubertal timing. This lack of statistical significance is likely to be because 98% of children in the pooled sample were living with their biological mother.
5 Controlling for: birth order, low birth weight, whether the child was underweight or overweight in the previous wave, whether the child has a long-term health condition, whether the child was breastfed until at least 6 months of age. For boys and girls, the adjusted estimates indicate that the odds of showing signs of puberty increase substantially with the child's weight in the previous wave; odds are lower for children who were breastfed until at least 6 months of age and also lower for middle and youngest children compared to first-born children.
6 For more details about diversity and change in children's household structures, refer to chapter 3 of this Report.
7 Controlling only for age squared, the odds of showing definite signs of puberty are 1.1 times greater for boys in single-mother households, relative to boys living with both biological parents (marginally significant) For girls, the odds of showing definite signs of puberty are 1.2 times greater for those in single-mother households, relative to girls living with both biological parents (significant at the p < .05 level).
8 Controlling for: birth order, low birth weight, whether the child was underweight or overweight in the previous wave, whether the child has a long-term health condition, whether the child was breastfed until at least 6 months of age.
9 Many of the children in single-parent families do spend a significant amount of time with their non-resident parent; and for children in single-mother households who have regular contact with both their biological parents, the effect of the "absence" of the biological father is likely to be negligible. Chapter 3 of this Report provides further details about the amount of contact that children have with parents living elsewhere.
10 After controlling for birth order, low birth weight, whether the child was underweight or overweight in the previous wave, whether the child has a long-term health condition, whether the child was breastfed until at least 6 months of age, the odds of showing definite signs of puberty were still around 50% lower for boys whose mother reported starting puberty either behind or way behind her peers (p < .01) relative to boys whose mother reported starting at around the same time as her peers.
11 After controlling for household structure, birth order, low birth weight, whether the child was underweight or overweight in the previous wave, whether the child has a long-term health condition, whether the child was breastfed until at least 6 months of age, the odds of showing definite signs of puberty were still around 1.5 times greater for girls whose mother reported starting puberty either ahead or way ahead of her peers, relative to those whose mother reported starting at around the same time as her peers; and the odds of showing definite signs of puberty were 1.3 times greater for girls whose mother reported starting puberty at around the same time as her peers, relative to those whose mother reported starting behind; and 2.6 times greater relative to girls whose mother reported starting puberty way behind her peers (p < .05).
12 After controlling for household structure, birth order, low birth weight, whether the child was underweight or overweight in the previous wave, whether the child has a long-term health condition, whether the child was breastfed until at least 6 months of age, the odds of showing definite signs of puberty were 1.5 times greater for boys whose mother experienced menarche before the age of 12, relative to those whose mother whose mother experienced menarche between the age of 12 and 14 (p < .01); and the odds of showing definite signs of puberty were 1.4 times greater for boys whose mother experienced menarche between the age of 12 and 14, relative to boys whose mother experienced menarche at age 15 or older (p < .01). For girls, the odds of showing definite signs of puberty were 1.5 times greater for those whose mother experienced menarche before the age of 12 (p < .01), relative to those whose mother experienced menarche between the age of 12 and 14; and the odds of showing definite signs of puberty were 1.5 times greater for girls whose mother experienced menarche between the age of 12 and 14, relative to those whose mother experienced menarche at age 15 or older (marginal significance).
13 After controlling for household structure, birth order, low birth weight, whether the child was underweight or overweight in the previous wave, whether the child has a long-term health condition, whether the child was breastfed until at least 6 months of age, the estimated odds of showing definite signs of puberty were 1.4 times greater for boys whose father reported starting puberty at around the same time as his peers, relative to those whose father reported starting puberty behind his peers (p < .05); and 2.2 times higher relative to boys whose father reported starting puberty way behind other kids (p < .05). For girls, the estimated odds of showing definite signs of puberty were 1.8 times greater for girls whose father reported starting puberty at around the same time as his peers, relative to those whose father reported starting puberty behind other children (p < .01).
14 While the difference in emotional functioning scores is statistically significant, the percentage of boys in the pre-pubertal stage at age 8-9 is quite small; and the confidence interval for this estimate is quite large. Therefore, this result should be interpreted with caution.
15 Linear (OLS) regressions were run separately by gender and age group, controlling for puberty category and age (in weeks), family type, birth order, household size, number of siblings, low birth weight, whether the child was breastfed until 6 months old, whether the child has a long-term health condition or disability, whether the child was under or overweight, parental education and equivalised parental income. Differences in school functioning scores at age 8-9 were no longer statistically significant after adjusting for these covariates.
16 At age 10-11, compared to girls in the pre-pubertal stage, adjusted scores for emotional functioning were 8 points (0.5 standard deviations) lower. However, this result should be interpreted with caution due to the limited number of observations for girls in the post-pubertal stage.
17 Estimates of emotional, school and social functioning at the age of 12-13 not presented here show that there were no significant differences in the average scores for emotional, school or social functioning according to the age at onset of puberty (i.e., whether they began showing physical signs of puberty at age 8-9, 10-11 or 12-13) for boys or girls.
18 It should be noted that while multiple waves of data are used, we do not examine how the functioning levels of individuals change over time, and with pubertal development.
Share


