2. The career aspirations of young adolescent boys and girls
2. The career aspirations of young adolescent boys and girls

2.1 Background
While vocational or career development is thought to begin in childhood and to develop further through adolescence and young adulthood (Gottfredson, 1981; Super, 1980), at 14-15 years, young people are likely to be starting to think about themselves as future workers, with vocational aspirations and goals becoming part of their growing self-identity (Erikson, 1968). The primary focus of this chapter is on describing the types of jobs adolescents at 14-15 years tell us they would like to have in the future. Our specific focus is therefore on adolescents' desired jobs, which we refer to as career or occupational aspirations.
While many adolescents at this age may still be working out their preferred future occupation, it is likely that their aspirations are starting to be shaped, not only by their interests, but also by an awareness of their own abilities and the perceived prestige and difficulty of certain careers (Creed, Conlon, & Zimmer-Gembeck, 2007; Gottfredson, 1981). Nevertheless, they may not have a full appreciation of the types of jobs available to them, with children's and adolescents' job aspirations tending to fall within a fairly narrow set of occupations, not all of them realistic (City & Guilds, 2015; Mann, Massey, Glover, Kashefpadkel, & Dawkins, 2013).
We do not know from LSAC to what extent adolescents themselves expect to be able to enter their desired occupations. Existing research in this area tells us that adolescents often expect to enter jobs that are of a lower status than the ones they aspire to (Furlong & Biggart, 1999). A significant proportion of adolescents aspire to higher status or "professional" jobs - more so than is likely to eventuate, as has been shown to be the case for Australian youth (Beavis, Curtis, & Curtis, 2005; Gemici, Bednarz, Karmel, & Lim, 2014; Sikora & Saha, 2011). Also, among younger adolescents and children, a disproportionate number desire to enter more glamorous or "fantasy" occupations, such as film star and professional sports player. To what extent adolescents' career aspirations are grounded in reality is expected to vary, depending on adolescents' level of career maturity (Auger, Blackhurst, & Wahl, 2005; Super, 1980), with aspirations and expectations likely to become more reality-based as they grow (Furlong & Biggart, 1999; Gottfredson, 1981).
In this chapter, adolescents' desired jobs are classified within a framework that allows analyses of the broad categories of jobs to which adolescents aspire, such as professional jobs or technical and trade jobs. Research on career aspirations of children and adolescents often focuses on aggregated data such as this, but here we enrich this focus by using league tables of the most commonly reported jobs identified by adolescents within the groups of interest. This approach was used by Furlong and Biggart (1999) and Kelly (1989), and is especially useful for exploring gender differences. Australian research on career aspirations is largely drawn from the Longitudinal Study of Australian Youth (LSAY) (e.g., Gemici et al., 2014; Sikora & Saha, 2011), from data collected when adolescents were aged 15 years about their expected career at age 30 years. This analysis of LSAC builds on this work by presenting a more descriptive account of career aspirations of girls and boys at 14-15 years.
We expect that some adolescents at 14-15 years will not yet know what they want their career path to be. Uncertainty in career aspirations is not necessarily viewed as a concern, as it may lead adolescents to experiment with different fields, build up a range of skills and learn about being flexible in the labour market (Schoon & Polek, 2011; Staff, Harris, Sabates, & Briddell, 2010). In the review on career uncertainty by Schoon and Polek (2011), the authors concluded that the effects of uncertainty on outcomes are likely to vary depending on several things, including the imminence of key transition points in education, and "the individual characteristics of the adolescents themselves, and the support available from parents and the wider social context". This paper explores some of these factors, by providing an analysis of characteristics related to 14-15 year olds being uncertain of future careers.
Exploring factors that explain variation in occupational aspirations is one contribution of this chapter. A characteristic of special interest is gender (Furlong & Biggart, 1999; Super, 1980), given the gender differences in subject choice at school and in occupations within the labour market (Justman & Méndez, 2016). There is considerable evidence that from a young age the occupational aspirations of boys and girls are quite different, such that, at adolescence, each tends to aspire to "gender traditional" occupations (City & Guilds, 2015; Patton & Creed, 2007). The career aspirations of boys and girls are compared, and analysed separately throughout this chapter.
We expect that adolescents' career aspirations will be related to their educational expectations and academic abilities (Creed et al., 2007; Furlong & Biggart, 1999; Gemici et al., 2014), although some adolescents may have aspirations that do not line up well with these characteristics (Beavis et al., 2005). Some may also have an awareness that these aspirations are different from the occupations they more realistically expect to take up.
Previous research indicates adolescents quite often do not understand what education or training would be needed to enter their desired occupation, with mismatches in adolescents' expected educational pathways and expected occupations (Beavis et al., 2005). We explore the mismatch between children's educational expectations and career aspirations with these LSAC data, and also gain some insights on adolescents who foresee themselves leaving school early but who have not formed any ideas about what work they might do as adults.
In linking academic skills and career choice, we expect that better results will be linked to higher aspirations (Beavis et al., 2005; Creed et al., 2007; Gemici et al., 2014), as adolescents who are more able in academic skills are expected to aspire to those occupations that require greater cognitive capabilities rather than being more manual or routine in nature (Gottfredson, 1981). Those who are proficient in particular aspects of academic skills (e.g., maths) are likely to desire jobs in occupations that draw upon those skills, although these associations may be different for girls and boys (Bandura, Barbaranelli, Caprara, & Pastorelli, 2001). Some early analysis of the link between academic skills and career aspirations is presented here, measuring academic skills using children's Year 9 NAPLAN results.
While the academic characteristics described above may represent intrinsic characteristics of adolescents, some characteristics may be encouraged and supported by parents, such that parental characteristics and/or the broader family environment may be important in setting the scene for adolescents' career aspirations (Flanagan & Eccles, 1993; Gemici et al., 2014; Jodl, Michael, Malanchuk, Eccles, & Sameroff, 2001; for a review, see Frigo, Bryce, Anderson, & McKenzie, 2007). Links between family and child aspirations have most often been explored in relation to family socio-economic status. Typically, higher aspirations are apparent in higher socio-economic status families, with this generally considered to be a consequence of adolescents having aspirations for the completion of higher levels of education in conjunction with aspirations for careers that require such levels of education (e.g., Schoon & Polek, 2011). To understand the meaning of socio-economic differences in adolescents' career aspirations, more comprehensive analytical methods are needed than can be presented in this chapter. Here, the differences according to socio-economic status are presented to provide some insights on the degree of variation at this age.
As adolescents at 14-15 years are starting to make educational decisions that could affect their future pathways through study and work, having access to people to talk to about career aspirations may be of value. Parents can play an important role in this (Young, 1994), as young people gain much of their help with career planning from family and friends (Rainey, Simons, Pudney, & Hughes, 2008). There is only sparse research that specifically explores outcomes associated with parental engagement in adolescents' career planning (Morgan, 2012). However, some evaluations of parent-focused programs have highlighted their value in providing support to parents, to enable them to help guide their children's education and employment transitions (e.g., Bedson & Perkins, 2006). This chapter includes analyses of child reports of who they talk to about plans for the future, and parent reports of talking to adolescents about the future and about future jobs or courses adolescents should take, to provide an overview of some ways adolescents may be exploring their options.
2.2 Research questions
With a large nationally representative sample of young adolescents, LSAC provides an opportunity to answer the following questions related to adolescents' career aspirations.
- What sorts of jobs do 14-15 year old adolescents see themselves doing as adults?
- How do career aspirations vary by the gender, educational experiences and aspirations of the young person, and by their family's socio-economic characteristics?
- Are 14-15 year olds talking to others about their future careers?
2.3 Data and methods
Occupational aspirations
The focus of this chapter is the K cohort, Wave 6 data, when the LSAC study children were aged 14-15 years. Most adolescents at this age were asked about their career aspirations (n = 3,378). They were first asked the question: "As things stand now, do you know what career or occupation you would like to have in the future?" with response options of "yes", "no", and "don't know".1 Overall, 59% of adolescents said they knew what job they would like to have, 14% answered "no" and 27% "don't know". The "no" and "don't know" categories are combined for this chapter, being those adolescents who do not yet know their desired occupation.
For adolescents who said they knew what job (i.e., career or occupation) they would like to have, they were asked what their desired occupation was. Answers were captured as text and were coded into categories for this paper. The classification used here was based on the Australian and New Zealand Standard Classification of Occupations (ANZSCO) (Australian Bureau of Statistics, 2013), with modifications to suit these data.2 The coding framework is shown in Table 2.1, including examples of actual responses. The classification loosely reflects skill levels of particular jobs, with higher skilled jobs at the top of the classification and lower skilled jobs at the bottom. Compared with the original ANZSCO coding, however, many of the occupations within the broad categories (e.g., within professional and manager) are at the same skill level, and the created group of "performing arts and production" includes a diverse range of skill levels. Many ANZSCO categories for lower skilled jobs were collapsed into a miscellaneous category given small numbers selecting them (see Appendix Table 2.A).
A number of adolescents stated that their desired occupation was one that might typically be considered to be a "glamorous" or "fantasy" occupation, for example soccer player, actor, TV music host, circus acrobat and interspace emperor. These occupations were coded to the category that best matched their nominated job, but this means desired occupation does include a mix of realistic and aspirational jobs.3 No attempt was made to specifically identify "fantasy" jobs, as some adolescents may indeed be able to enter the prestigious or glamorous job they mentioned. Even among adolescents aspiring to jobs such as doctors, pilots and veterinarians, for some these jobs may be a fantasy and for others they may become a reality.
The distribution of coded responses is shown in Table 2.2. Adolescents sometimes indicated that they had more than one desired occupation (e.g., "school teacher or physiotherapist, vet"), and the first column of numbers allows for multiple occupation responses. However, for the purposes of this analysis, adolescents were coded to only one occupation, that being the one higher up on the list, as presented in this table.4 The result of this classification of desired jobs is also shown in Table 2.2, with sample sizes for each occupation in the second column and weighted percentages in the final column.
Notes: a Not including nursing professional (and midwife); b Not including performing arts and production.
Some comparison is also made to the occupations of employed persons in the current labour market, using information collected by the Australian Bureau of Statistics (ABS) in February 2016. The ANZSCO coded data were reclassified to match, as best as possible, the classification used to analyse the LSAC data. These aggregate data are shown alongside the LSAC data in Appendix Table 2.A.
Other characteristics of adolescents and families
Differences between boys and girls are explored throughout, first overall and then for the range of variables described below, with all analyses presented by child sex. Statistical tests are used to compare responses across categories, but multivariate methods have not been used to test for associations.5 Therefore, in exploring the associations between career aspirations and each of the variables described below, we cannot identify which are the factors that are most important in explaining differences across groups of adolescents. This is especially the case since each of the education variables and the measure of socio-economic status are correlated to some extent (as shown in Appendix Table 2.B. The variables examined are:
- Adolescents' expected educational qualifications, as captured from the children themselves at 14-15 years. This measures how far they expect to go in their education. This information is also collected from parents, but it was especially relevant for these analyses to consider children's expectations in light of their career aspirations, to see where there were mismatches between the two.
- Adolescents' academic achievement, using Year 9 NAPLAN results in numeracy, reading and writing, which were matched to the LSAC data for approximately 3,540 of the adolescents (numbers varying slightly across different NAPLAN measures).
- Family socio-economic status, based on the socio-economic position (SEP) variable (see Chapter 1), dividing families into four SEP quartiles.
Talking about the future
Information on the support that adolescents receive regarding subject choice and career information is also explored in relation to the above information on career aspirations. This includes:
- adolescents' responses to the question, "When you talk about your plans for the future, would you say you talk to your ..." (parents, friends, teachers, school guidance counsellor, other). Possible responses are "yes" or "no" to each of these.
- primary carer responses to the following: "How often do you talk to study child about …" (his/her plans for the future, future jobs, courses he/she should take at school). Possible responses to each are "Never/Almost never", "Rarely", "Sometimes", "Often" and "Always/Almost always".
These data are analysed by child gender, with some analyses by educational expectations and occupational aspirations.
2.4 Results
Adolescents' career aspirations compared to the current labour market
Among the 14-15 year olds in LSAC, 59% said they knew what career or occupation they would like to have, 14% said they did not know, and another 27% did not know how to answer the question.
The desired occupations were quite varied (Table 2.3, although a majority (35% overall; 60% of those stating an occupation) stated an occupation classified as professional or manager. A smaller proportion overall said they desired to work in trades or technical jobs (16% of those with a stated occupation), and fewer again said they desired to work in jobs classified here as "service or miscellaneous" (14% of those with a stated occupation). In particular, within this category "miscellaneous" captures those that said they desired to work in jobs such as sales, administration or hospitality, and the number in this category was very small. Another 11% of those with a desired occupation named a job in sports or performance arts/production.
The distribution of these occupations is quite different to that of currently employed men and women (Appendix Table 2.A. The LSAC responses are much more skewed toward the professional jobs than is reflected in the labour market, with 60% of those in the LSAC sample who knew what occupation they desired selecting a professional occupation, compared to 35% employed in these jobs in the current labour market. Differences were marked for specific professional jobs, with the aspirations exceeding current patterns in all but "business professionals and managers", which represents 19% of occupations in the labour market but captured the responses of just 2% of the LSAC desired occupations.
Very few in LSAC (14% of those stating an occupation) said they wanted one of the jobs coded here into "service and miscellaneous". This category includes sales, hospitality, clerical, labourers and so on, which in sum make up 49% of the current labour force (see Appendix Table 2A. Interestingly, the percentage for "technician and trade" jobs in LSAC is not very different to that of the current distribution (16% of desired occupations in LSAC and 15% of jobs in the current labour market). There is also mismatch between desired and actual occupations for "sports and performance arts" jobs, which make up 11% of the desired occupations and just 1.3% of the labour market.
Notes: # Relative standard error is > = 25%. Percentages may not total exactly 100.0% due to rounding.
Source: LSAC K cohort, Wave 6
Adolescents' career aspirations by gender
Boys were somewhat more likely than girls to know their desired occupation (61% compared to 57%), but gender differences were considerably more apparent when looking at the types of jobs desired.6 Within the broad classifications, girls were more likely than boys to aspire to a professional/manager job or one in the service and miscellaneous category, with boys more likely than girls to aspire to a technician or trade job. Differences were apparent also when looking in more detail at the types of jobs nominated by girls and boys, as shown in Table 2.3 and in the "top ten" occupations of girls and boys presented in Table 2.4. For example, looking at boys' preferred jobs:
- The most nominated set of jobs desired by boys was the engineering and transport professional (14% of boys who had nominated a desired occupation) but this was rarely mentioned by girls. "Engineering" may include those thinking about a trade job (e.g., electrical engineer) but did not provide sufficient detail for this to be coded as a trade job.
- One in ten boys who stated a desired occupation referred to a job in ICT, and this also was rarely mentioned by girls. This category captures general responses that indicated wanting to work in information technology or as a computer programmer, as well as responses such as "games developer", "Youtuber" and "Apple genius".
- Technician and trade jobs were commonly named by boys, specifically in construction and in the automotive trades (9% and 8% respectively of those naming a desired occupation).
- Sports jobs were also in the "top ten" for boys but not girls. These included jobs such as personal trainer, as well as ones such as professional footballer that are possibly more aspirational, given their rarity as jobs in the labour market.
Notes: Rankings and percentages are based on weighted data. Occupations in bold are those that only appear on this gender's list.
For girls, the top-named occupation (doctor, dentist or other health professional) was also in the boys' top ten. Also on both lists were performance arts and production (5% of boys and 7% of girls who named a desired occupation) and professional design, planning or architect (5% of boys and 6% of girls).
Occupations that were only in girls' top ten were:
- Education professionals (that is, teachers and early childhood education workers) and legal or social professionals (e.g., lawyer, psychologist). Each was selected by 11% of the girls who had named a desired occupation.
- Another 7% of girls identified jobs classified as "personal service", which included hairdresser and beautician.
- Nursing (including midwifery) was selected by 7% of girls and another 6% selected jobs under health and welfare support and care, which included child care and aged care work.
- Another 6% of girls specifically referred to vet as their preferred occupation.
- Media, literature or arts jobs were identified as the preferred occupations of 5% of the girls who had named a desired occupation.
Many of these gender differences reflect the gendered nature of occupations in the current labour market (see Appendix Table 2.A. For example:
- Of all employed men, 2.1% are in engineering and transport professional jobs, compared to 0.2% of employed women.
- Of all employed men, 3.0% are ICT professionals, compared to 0.8% of employed women.
- Of all employed men, 23% are in technician and trades jobs, compared to 5% of employed women.
- Of all employed women, 5% are nursing professionals, compared to 0.6% of employed men.
- Of all employed women, 6.4% are education professionals, compared to 2.3% of employed men.
- Of all employed women, 9.1% do health and welfare support and care jobs, compared to 1.6% of employed men.
In further analyses, below, findings for boys and girls are presented separately to explore how career aspirations vary across other characteristics. In the following subsections, links between education and career aspirations are explored. The education variables included are expected level of education and educational achievement, using selected Year 9 NAPLAN results. After these subsections, differences by family socio-economic position are explored. See section 2.3 for a description of these variables.
Career aspirations by educational expectations
The existing research leads us to expect that youth with higher educational expectations would have aspirations for higher status jobs, and so we explore here how educational expectations and career aspirations are related.
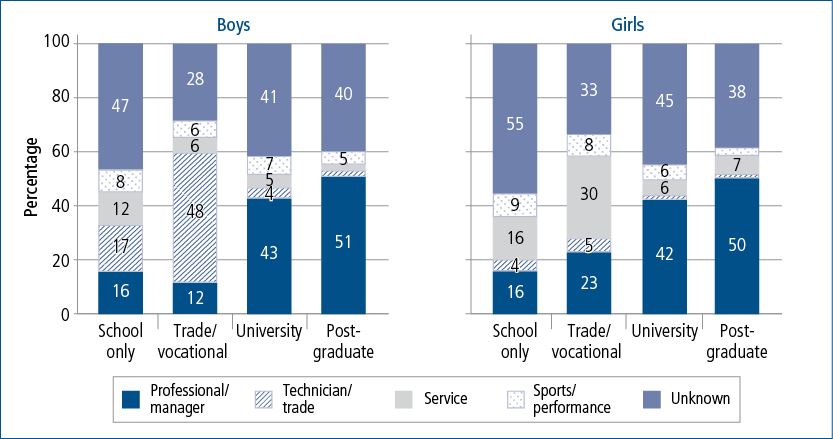
Overall, of the 14-15 year old boys, 21% expected to complete school only, 22% expected to complete a trade or technical qualification, 27% expected to complete a bachelor degree and 39% expected to complete post-graduate qualifications. Of the 14-15 year old girls, 18% expected to complete school only, 12% expected to complete a trade or technical qualification, 37% expected to complete a bachelor degree and 33% expected to complete post-graduate qualifications.7 Differences in boys' and girls' occupational aspirations, broadly classified, are shown according to their educational expectations in Figure 2.1 and the "top ten" occupations within each category, shown in Table 2.5. The bold text in the table indicates differences by educational expectations, within gender.
- Relatively high percentages of boys and girls who expected to achieve no post-secondary qualifications were undecided about their desired career (47% of boys and 55% of girls). Among those who expected to only complete secondary education and had ideas about what they wanted to do, there were mixed desired careers.
- For boys, the top occupation within this education group was ICT professional. The actual responses of these boys indicated that many of these boys desired to work in the design or development of computer games.
- For girls, the top three occupations were performance arts and production, protective services and health and welfare support and care.
- Adolescents were most likely to know what occupation they wanted if they expected to achieve a trade or vocational qualification. This is likely to be a reflection of adolescents understanding that they would enter a specific job through an apprenticeship or vocational training. Some may already have commenced or be about to commence this training through school-based vocational subjects. In particular, for boys, 48% of those expecting to achieve a trade or vocational qualification reported that their desired job was a technician or trade job (such as electrician, diesel mechanic or carpenter). Various trade jobs were represented in the "top ten" or boys with this educational expectation. For girls with this educational expectation, a relatively high percentage were thinking about a job falling in the category of services or miscellaneous. "Personal service" was ranked first for girls who expected to achieve a trade or vocational qualification, which includes hairdressing and beautician.
Figure 2.1: Career aspirations of boys and girls by child's educational expectations
Source: LSAC K cohort, Wave 6
Notes: Rankings and percentages are based on weighted data but occupations are only presented in the "top ten" if the sample size for that occupation was at least 10. As a result, fewer than 10 occupations are sometimes listed. Occupations in bold are those that only appear on the list for this education group, within gender.
Source: LSAC K cohort, Wave 6
- Many of the adolescents saw themselves as completing post-graduate qualifications, and for some adolescents this may be linked to particular career aspirations. Adolescents with post-graduate aspirations were the most likely to desire professional and managerial jobs. Adolescents expecting to achieve a university degree were similar to those expecting to achieve higher qualifications, with a large proportion desiring a professional or manager job. There was also a large proportion uncertain about their future career within those with expectations for university qualifications (including those expecting to reach post-graduate level).
- For boys, the top main categories of professional jobs desired by those expecting university qualifications were engineering and transport professional, doctor, dentist or other health professional, and ICT professional but with a number of other occupation groups also desired (see the boys' top ten).
- For girls, there were similarities with boys in the top ten listed occupations, with doctor, dentist or other health professional at the top of the list. Girls expecting this level of education, however, rarely nominated engineering and transport professional jobs or ICT professional jobs. The main significant difference for girls was in reference to education professional, which was also on the top ten list for boys but was nominated by a smaller percentage compared to girls.
- Jobs in sports were in the top ten for boys in all the categories, and jobs in performance arts in the top ten for boys and girls across all groups of educational expectations, except those expecting to achieve trade or vocational qualifications. Within sports, "glamorous" jobs such as "professional football player" were common across all categories, and likewise within performance arts and production, jobs such as musician and actor were common (for boys) and actor or dancer (for girls), regardless of their educational expectations.
Career aspirations by academic achievement
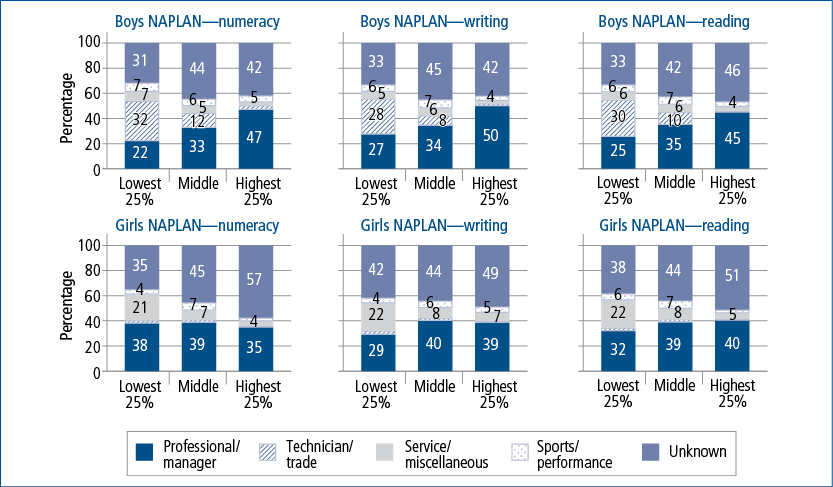
We also expect that adolescents' career aspirations will vary with their current academic achievement. Here we look at this using Year 9 NAPLAN results, including results for numeracy, reading and writing. The distribution of each of the NAPLAN scores of all adolescents in LSAC was divided into quartiles, so we could compare those with the lowest achievement (in the bottom 25% of the distribution of the NAPLAN score), those in the middle (in the middle 50% of the distribution of the NAPLAN score) and those with the highest achievement (in the top 25% of the distribution of the NAPLAN score).8 Some adolescents were excluded, as Year 9 NAPLAN scores had not been matched to them, such that these analyses are based on approximately 1,739 girls and 1,798 boys (numbers vary slightly according to which NAPLAN score is used).
Career aspirations, broadly classified, are shown by each achievement measure in Figure 2.2, and information about the top ten occupations for those in the highest and lowest quartiles is shown in Table 2.6. As adolescents' educational expectations (described in the previous section) are correlated with this measure of academic achievement, we will not describe the findings in the same level of detail as was described above.9
Looking at the broad occupational aspirations, there were different associations for boys and for girls. For boys, higher achievement on any of the NAPLAN scores was associated with being more likely to aspire to a professional or manager job, and less likely to aspire to a technician or trades job. Compared to boys with higher or average achievement, boys with the lowest scores were the least likely to have an unknown career aspiration, instead having a much higher likelihood of saying they would like a technician or trades job compared to other achievement levels. Boys with higher scores on reading, but not numeracy or writing, were more likely than other boys to have an unknown career aspiration.
For girls, Figure 2.2 shows that, unlike for boys, the likelihood of desiring a professional or manager job did not increase with higher achievement scores for numeracy. Those with lower reading or writing scores were less likely than other girls to aspire to a professional or manager job but, even for these measures, a significant proportion of girls with low scores aspired to a professional job. Girls with lower NAPLAN scores more often said they would like a job in services or miscellaneous compared to other girls (and compared to boys). Girls with the highest achievement were the most likely to say they did not know what career they would like to have, compared to those with average or lower scores. This was especially marked for the numeracy findings.
Figure 2.2: Career aspirations by Year 9 NAPLAN results
Source: LSAC K cohort, Wave 6
Table 2.6 shows the "top ten" occupations for boys and girls within each NAPLAN grouping. The detail is shown for each of the NAPLAN tests, and the bold text compares the occupations of those with the lowest scores within each of the tests to those with the highest scores for boys and then for girls. That is, the bold text does not indicate whether or not there are differences between boys and girls, and does not compare across the NAPLAN tests.
Looking separately at boys and girls, many of the occupations on the list of those with lower achievement scores are the same, regardless of which test is considered, and this is the case also for those with higher achievement scores. Some of the differences according to test type are due to small sample sizes precluding filling out more detail (e.g., for boys with higher writing scores and girls with higher numeracy scores). Interestingly, for girls' NAPLAN reading scores, many of the occupations were on both lists for low and high achievers, suggesting that numeracy and writing results for girls are more useful indicators of girls' general career aspirations.
Across the different tests, the top ten occupations for boys in the lowest 25% of any of the NAPLAN scores were virtually the same as those that appeared on the top ten for boys who expected to achieve a secondary school or trade or vocational qualification. Similarly, the top ten for boys in the upper 25% of the NAPLAN distribution was virtually the same as that for boys expecting to achieve a university qualification (see Table 2.5). As noted above, there were some differences across test types, but in all three tests the top two occupations for those with lower scores were automotive and engineering, and construction, and the top two for those with higher scores were engineering and transport professional, and doctor, dentist or other health professional.
For girls with the highest achievement scores, the top ten occupations mirror those of girls expecting to gain university qualifications (see Table 2.5). Across all the tests this includes doctor, dentist or other health professional, and legal or social professional. The finding that girls with lower NAPLAN scores often aspire to professional and manager jobs is seen in the top ten of their occupations including many of the professional occupations, with education professional, and legal or social professional appearing on the lists of those with lower scores on any of the tests.
Notes: Rankings and percentages are based on weighted data, but occupations are only presented in the "top ten" if the sample size for that occupation was at least 10. As a result, fewer than 10 occupations are sometimes listed. Occupations in bold are those that only appear on the list for this NAPLAN group, within NAPLAN test and within gender.
Source: LSAC K cohort, Wave 6
If the original responses are examined in more detail, however, there are some differences in the types of professional jobs that are desired according to NAPLAN results. For example:
- Around half of the girls aspiring to "educational professional" with lower NAPLAN scores specifically referred to teaching art, drama, physical education or early childhood education. The higher achieving girls mention these jobs also but were somewhat more likely to refer to more general teaching jobs.
- Within the category "legal or social professional" jobs in psychology, criminology and counselling were commonly mentioned by all, including those with lower NAPLAN scores. Among those with higher NAPLAN scores, more referred to working in legal jobs.
Career aspirations and family socio-economic status
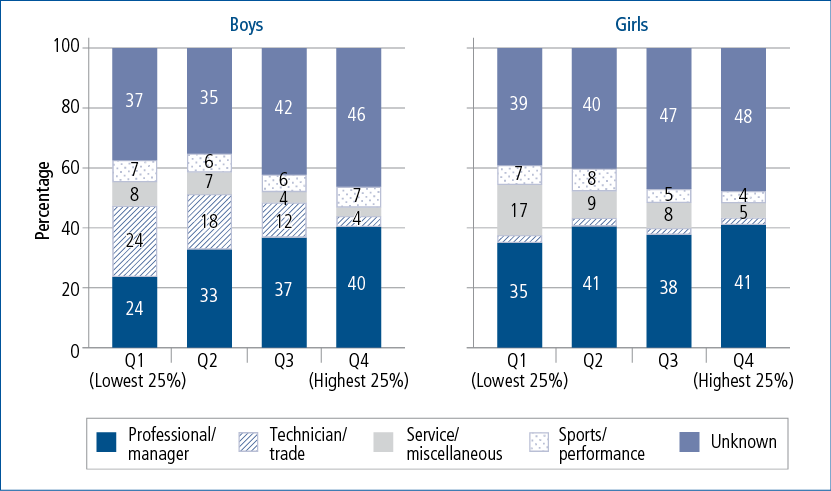
Moving beyond measures of the adolescents themselves, here we show how adolescents' career aspirations vary according to family socio-economic status. While this is useful for assessing how aspirations vary across socio-economic status groups, it will not be possible from these descriptive analyses to determine whether findings reflect socio-economic status itself, or differences in educational expectations and outcomes across these groups.10 Appendix Table 2.A shows that these educational variables differ across the socio-economic status groups we use here. In particular, within higher socio-economic status families the majority of adolescents expected to achieve university qualifications. Therefore, when looking at the occupational aspirations of adolescents in high socio-economic status families, the findings are almost exactly the same as those found in analysing the occupational aspirations of adolescents expecting to reach university education.
The broad categories of adolescents' career aspirations are shown in Figure 2.3, by gender and quartiles of family socio-economic position. The top ten occupations for boys and girls in low and high socio-economic status families are shown in Table 2.7. For boys and girls, Figure 2.3 shows that adolescents in families of lower socio-economic position (quartile one or two) were generally more likely than those in higher socio-economic status families to know the career or occupation they wanted to do. This largely relates to the higher likelihood of the selection of technician or trade jobs by boys and service or miscellaneous jobs by girls in lower socio-economic status families. The same findings have been seen above in looking at occupational aspirations by educational expectations and academic outcomes.
Figure 2.3: Career aspirations of 14-15 year old boys and girls by family socio-economic position
Source: LSAC K cohort, Wave 6
Notes: Rankings and percentages are based on weighted data, but occupations are only presented in the "top ten" if the sample size for that occupation was at least 10. As a result, fewer than 10 occupations are sometimes listed. Occupations in bold are those that only appear on the list for this socio-economic status group, within gender.
Source: LSAC K cohort, Wave 6
Preferring a professional or management job was common in all socio-economic status quartiles, and this increased with socio-economic status for boys. For girls, however, the association between socio-economic status and preferences for professional jobs was less clear. In the analyses of academic outcomes, above, we showed that lower-achieving girls (using NAPLAN scores) were almost as likely as higher-achieving girls to aspire to professional jobs, and this socio-economic status finding reflects that same association. As such, when we look at the types of jobs desired by girls in low socio-economic status families, we also see the sorts of professional jobs described above. Looking into these results in more depth, as before, it is apparent that subtle differences in girls' responses do seem to suggest some differences between low and high socio-economic status families, even if the broad categories have similar percentages nominating particular occupations.
Who are 14-15 year olds talking to about their future careers?
For young people, there are various ways that they can develop insights about their possible career futures and learn about what options in education and employment may be available to them. Some of this learning may be done in the family home if parents offer up advice and/or adolescents seek out the opinions of their parents about these topics. Of course, as is the case on a wide range of subjects, at adolescence, these young people may be talking more to others in their lives than they are talking to parents. Peers and teachers are other possible sources of information and, on the subject of career planning, some may have access to school resources specifically directed at providing career advice. Research undertaken in the UK by City and Guilds (2015), with a sample of young people aged 14-19 years, showed that young people had different sources of information about their job of choice including hearing about it from school (30% of them) and seeing it in the media (28%). One in five of them said that the job was suggested by their parents (21%), 16% by a teacher or lecturer and 14% by a career advisor.
Here we present some findings about who the 14-15 year olds in LSAC are talking to about their future as a means of gaining insights on who they may be talking to regarding their career aspirations. The 14-15 year olds were asked who they talk to about plans for the future, and specifically asked whether they talk to parents, friends, teachers, school career counsellors or others. Overall:
- most boys (88%) and girls (86%) said that they talk to their parents;
- talking to peers was more common for girls (75%) than for boys (63%);
- talking to teachers was similar for boys (29%) and girls (32%);
- a little over one in ten boys and girls (12-13%) talked to school guidance or career counsellors; and
- a small percentage (3-4%) talked to other people. This largely reflected adolescents reporting talking to other family members, such as siblings and grandparents.
These percentages did not differ significantly for boys and girls, except in relation to talking to peers. Combining the above information, 99% of the 14-15 year olds in LSAC reported that there was someone that they talked to about their plans for the future.
The child's primary carer (typically the mother) was also asked a number of questions about how often they talked to the child about future work-oriented subjects. Specifically, they were asked about talking about his or her plans for the future; about future jobs he/she might have; about what courses he/she should take in school and how these courses will prepare him/her for these future jobs. It was not entirely clear what a response of "always/almost always" meant in response to these questions, relative to a response of "often", as both captured having frequent discussions, and so these categories have been combined as "often to always".
Table 2.8 shows that:
- Very few parents reported rarely or less often talking to the adolescents about any of these future work-oriented topics.
- About two-thirds of parents of girls reported frequently (often to always) talking to them about their plans for the future, with the proportion slightly less than this for parents of boys. Another 29% of parents of girls and 32% of parents of boys sometimes talked to them about their plans for the future.
- Findings were similar for talking to 14-15 year olds about future jobs they might have, and there were no significant differences according to whether parents had a girl or a boy. Slightly more parents reported rarely or less often talking to their child about future jobs, compared to how often they talked about their son/daughter's plans for the future more generally.
- The percentage of parents reporting to rarely or never talk to their son/daughter about possible school courses was a little higher than the percentages for the other items, with slightly fewer saying they often to always talk to their child about this.
Were adolescents more or less likely to be talking to others if they knew what career they wanted to have? Looking just at adolescents' reports of who they talk to about their plans for the future:
- Girls who knew what career they wanted were a little more likely to talk to parents (88% talked to parents) than were other girls (86%). For boys, this difference was not apparent.
- Boys who knew what career they wanted were more likely to talk to friends (65%) compared to those who did not know (58%). This finding was not apparent for girls.
- Boys and girls who knew what career they wanted were more likely to talk to teachers (33% and 36% respectively) compared to those who did not know (23% and 26% respectively).
- Girls who knew what career they wanted were more likely to talk to school career guidance counsellors (14%) than were other girls (10%). This finding was not apparent for boys.
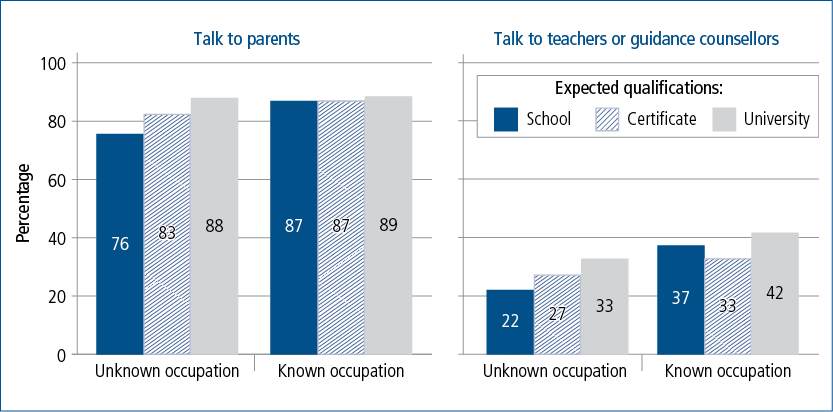
Taking this further, if we examine whether adolescents were talking to others according to their expected educational qualifications, as well as whether they know what occupation they would like, we find that there are some adolescents who may be in need of further help to make a successful transition from school to work. Looking at adolescents' reports of whether they talk to their parents and whether they talk to either teachers or career guidance counsellors, Figure 2.4 shows that:
- Among adolescents who know what career they would like to have, regardless of what educational expectations are, almost nine in ten adolescents are talking to their parents about their future. Further, the same proportion of youth who are uncertain about their career aspiration, but expect to complete university qualifications, are talking to their parents.
- However, one in four of those who do not know what future job they might like and expect to complete no further education after secondary school are not talking to their parents. These youth are also less likely than others to report that they talk to teachers or career guidance counsellors.
Notes: The distribution of boys was significantly different to that of girls (p < 0.01) for talking about plans for the future and talking about what courses should be taken. Differences were not statistically significant for talking about future jobs. Percentages may not total 100.0% exactly due to rounding.
Source: LSAC K cohort, Wave 6
Figure 2.4: Talking to parents and teachers about plans for the future, by educational expectations and whether desired career is known
Source: LSAC K cohort, Wave 6
2.5 Summary and discussion
Overview of 14-15 year old boys' and girls' career aspirations
Six in ten 14-15 year olds were able to say what career they would like to have in the future, with the proportion slightly higher for boys compared to girls. This proportion is similar to that found in other studies in Australia and elsewhere among similarly aged children (Beavis et al., 2005).
Throughout this chapter we found marked gender differences in career aspirations, consistent with findings from other studies (City & Guilds, 2015; Furlong & Biggart, 1999; Patton & Creed, 2007; Schoon & Polek, 2011). The career aspirations are consistent with gender stereotypes, and with the gendered nature of subject selection in school and employment in different occupations (Justman & Méndez, 2016). Differences were apparent at the aggregate level, with some key findings:
- Girls were somewhat more likely to desire a professional job than were boys.
- Boys were much more likely to report desiring a trade or technical job, compared to girls.
- Girls were more likely to aspire to a job in personal services (or miscellaneous), which includes such jobs as hairdresser and beautician.
Significant differences emerged when we looked in more detail at the types of jobs girls and boys aspired to. The "top ten" tables allowed us to be more specific about this. Key findings were:
- Within professional jobs, both boys and girls often mentioned doctor, dentist or other health professional or other medical jobs, and jobs as vets or in science and nature. Working as a professional designer, planner or architect was also in the "top ten" of boys and girls.
- Within professional jobs, boys were most likely to say they wanted to work in ICT or as an engineering and transport professional. Girls rarely stated these occupations as their desired jobs.
- For girls desiring a professional job, the key difference was in the percentage expressing their desire to work as education professionals (teachers, including early childhood education teachers), legal and social professionals (lawyers as well as counsellors), nursing professionals, or media, literature or arts professionals. These occupations were not in the "top ten" for boys.
A number of the adolescents desired "glamorous" or "fantasy" occupations. This was most apparent in the proportion of adolescents aspiring to sports or performing arts and production jobs (11% of those with a desired occupation). Desiring such jobs was found across the range of socio-economic status and educational categories the adolescents were grouped into, so is perhaps a reflection of desires among adolescents at this age. While we have not explored it here, such desires may reflect adolescents' interests and abilities in these areas, which are also likely to contribute to other adolescents' desires to work in jobs of a specific, and perhaps less realistic, nature such as (for boys) "computer games developer" and (for girls) "fashion designer". There were quite marked gender differences in relation to these jobs, which are consistent with gender norms.
A majority (60%) of those who stated a desired occupation aspired to a professional or managerial job: a proportion in line with several other studies (Beavis et al., 2005; Sikora & Saha, 2011) but in excess of the proportion employed in such jobs in the current labour market, as shown in the comparison to occupations in the current labour market. This suggests that the career aspirations of adolescents will not translate into reality for all - an observation that has been made about youths' career aspirations in Australia and elsewhere (Baird, Burge, & Reynolds, 2008; Sikora & Saha, 2011). As in other studies, in these LSAC responses very few adolescents aspired to work in lower status jobs (such as in retail, hospitality or manufacturing), while it is likely this will be the career outcome for some (Beavis et al., 2005). The analyses of occupations in the current labour market showed that almost half of employed people work in jobs here classified as "services or miscellaneous". These captured the job aspirations of only 14% of the 14-15 year olds who knew what occupation they desired.
The analyses by the education and socio-economic status variables showed that those with higher educational aspirations, higher achievement or higher family socio-economic status very often desired a professional job, if they knew what career they wanted. This is consistent with much research showing socio-economic status differences in children and adolescents' career aspirations. We did not attempt to determine the underlying cause or explanation for these differences. The types of jobs these higher socio-economic status (or higher achieving) adolescents aspired to were quite diverse and differed for boys and girls, as discussed above.
Desiring a professional job was less likely for girls and boys who did not expect to gain a university education and, for boys, was less likely for those with poorer achievement scores and lower family socio-economic status. For girls, these associations were weaker, which we found was to some extent explained by girls with lower socio-economic status or lower achievement scores also saying they would like professional jobs. However, when the detailed responses of girls were analysed it appeared that the jobs they aspired to were subtly different to those of girls with higher socio-economic status or achievement scores. For example, within "education professional" jobs, girls from lower socio-economic status families more often referred to early childhood education teaching or teaching art, drama or physical education, rather than referring to general school teaching.
It was common for boys to say that they would like to work in a trade or technical job in the future, and this was strongly associated with boys saying they expect to achieve a trade or vocational certificate or diploma as their highest educational qualification. No doubt, these expectations and aspirations are linked with boys often having some understanding of the pathway into a particular trade job. The same could be said of girls who have aspirations to work in particular service jobs that would require a certificate or diploma.
There was, however, a mismatch between educational expectations and career aspirations for some adolescents, most apparent here for 14-15 year olds who aspired to jobs that they would not be able to achieve with the level of education they expected to reach. This has been observed in other research, including Australian research (Beavis, 2006). As found previously, some young people appear to have insufficient information about the labour market and about the pathways they need to take in order to achieve their desired jobs. Of course, with these LSAC data focused on desired jobs rather than expected jobs, it could be that the 14-15 year olds are already aware that they could not expect to enter their desired occupation. As we do not have information about expected occupation, we cannot make this assessment. (For analyses of occupational expectations, refer to LSAY publications, e.g., Gemici et al., 2014.)
In LSAC, career aspirations have been collected from age 14-15 years (Wave 6). These aspirations may have been shaped at much earlier ages, perhaps influenced by children's interests and abilities as well as their perceptions of available jobs as viewed through gender norms, parents' occupations or the local area labour market (Furlong & Biggart, 1999; Porfeli, Hartung, & Vondracek, 2008). Other characteristics of the child, family, parenting and parent-child relationships may also play a role in shaping adolescents' career aspirations (Frigo et al., 2007; Gemici et al., 2014; Jodl et al., 2001; Rainey & Borders, 1997). In future analyses, we can expand the examination of career aspirations at 14-15 years to consider whether there is variation according to factors such as these. While we cannot look back to earlier ages in the LSAC data, we will be able to track career aspirations as the children grow, as LSAC continues to capture this information. It will be most interesting to explore whether aspirations become defined or more realistic as these young people continue through the education system. In Furlong's longitudinal study, they noted a tendency for lower status jobs to become nominated more as children grew up to age 16, with a decline in the mention of higher status jobs (Furlong & Biggart, 1999). This decline may indicate children moving to more realistic career desires as they grow. In research by Mann et al. (2013), the preferred jobs of the older children in their study (the 17-18 year olds) were more realistic than those of the younger children (13-14 year olds), for whom the top-rated occupation was actor/actress. This research suggests that to some extent the LSAC children at 14-15 years may not yet all have realistic expectations about their possible future jobs.
Previous research indicates that having higher career aspirations as youth is related to later achievement of greater success (in terms of prestige and wages), relative to aspirations for lower prestige jobs, even after taking account of a range of other confounding factors (Super, 1980). Having unrealistic aspirations or uncertain aspirations has also been linked to poorer outcomes (Sabates, Harris, & Staff, 2011; Staff et al., 2010). Whether career aspirations at 14-15 years, later predicts labour market outcomes will be a research question for future waves of LSAC. If these aspirations change significantly to become more realistic at 16-17 years, it may be that the aspirations at 16-17 years are a better indicator of later outcomes.
Adolescents who do not know what career they desire
Overall, four in ten 14-15 year olds did not know what career they would like to have in the future, with this proportion a little higher for girls than boys. These adolescents with uncertain career plans will include those who have multiple options in mind and have not settled on a particular path sufficiently to identify a specific occupation. It will also include those who really have not yet identified an occupation, or possible set of occupations, that they feel will suit them. It may be that some have insufficient information about the types of jobs that are possible, given their interests and skills. Some, however, may simply not yet be thinking about their future in this way - being focused on more salient aspects of their lives such as their school and post-school education choices (Staff et al., 2010).
As discussed in the introduction, to what extent having an unknown career aspiration is a problem is likely to depend on child characteristics, sources of support and whether there are key transition points emerging, for which having some career plan may be helpful (Schoon & Polek, 2011). Many adolescents at this age would be beginning to make subject choices that can enable or limit their post-secondary education options. Adolescents are likely to be thinking about their career aspirations, if they have any, or relying on their interests and perceived abilities when choosing school subjects (Tripney et al., 2010). In the absence of career aspirations, basing decisions on interests and abilities, in itself, may not be problematic, given that future occupations are also likely to be related to these characteristics. The career uncertainty may actually be beneficial, as it means adolescents might explore a range of options, rather than being locked into one pathway that for various reasons may prove unsuccessful. It may be a less positive experience, however, for adolescents who are less motivated to explore different options, who are less certain about their own abilities, whose school outcomes are poorer, or who do not have access to supports that could help them identify career options (Schoon & Polek, 2011; Staff et al., 2010).
From these analyses of LSAC there were groups of adolescents more likely than others to be uncertain in their career aspirations. A large proportion (around half) of those expecting to complete no education after school were uncertain in their career future. Ensuring they have access to resources and supports to help them identify some options will be important in their remaining years of secondary school. Girls and boys who expected to achieve a trade or technical qualification were least likely to say that they did not know what career they wanted, no doubt because their qualification is related to the occupation they would like to follow. About four in ten of those expecting to achieve a university qualification did not know what career they wanted. This is similarly reflected in the analyses by adolescents' achievement scores, with higher scoring adolescents generally the most likely to be uncertain of their career aspiration. This was especially marked for girls who had high numeracy scores. This could indicate a lack of awareness of the types of jobs that might be available, but also it could indicate that these adolescents are considering a range of options. Again, it could also indicate that these adolescents are more focused on their education at this time, and have not yet devoted a lot of thinking to where this education could take them.
Tracking the career aspirations and outcomes of these adolescents as they grow, relative to those with a career aspiration at 14-15 years, will be a useful direction for research with future waves of LSAC.
Are 14-15 year olds talking to others about their future careers?
While talking to people is not the only way that adolescents may develop their career plans, it is one mechanism by which adolescents may be helped to see appropriate career options, should they be having difficulty deciding on which way to steer their education prior to leaving study and joining the workforce. It may be especially useful, then, for those who are undecided about career options, or who have a career aspiration that may be difficult to meet unless particular education (or other) steps are taken. These analyses showed that 14-15 year olds are most likely to talk with parents about their plans for the future, and most adolescents had some degree of communication with parents on this subject. This no doubt is one way that parents at least guide adolescents' career aspirations, although the transmission of values and broad educational aspirations through the family environment is also likely to be important in thinking about how parents might affect adolescents' thinking about possible future pathways (Frigo et al., 2007).
According to an evaluation of career development services for young people (15-24 year olds) by Rainey et al. (2008), parents "were viewed as the 'hidden client' in career development services as they support the young person and seek to influence the decision-making process." The need to develop and implement career-planning programs that are inclusive of or directed to parents has been recognised through previous Australian and international evidence (Bedson & Perkins, 2006). In particular, programs directed at low socio-economic status families are thought to be beneficial, providing a means of helping parents to guide at-risk children into a positive pathway (Bedson & Perkins, 2006). The finding from these LSAC data that showed that children least likely to be talking to parents and to teachers or school counsellors were those with unknown career aspirations who expected to complete no post-school education also suggests a need for programs that may improve these communication channels, or provide access to other means of support. More broadly, career guidance programs aimed at young people at risk of dropping out of school early can have an important role in helping these young people improve their outcomes (Sweet & Watts, 2004).
Adolescents may be drawing on other resources to gain information about their possible career futures. For example, career information is often provided as printed material for distribution or making available at schools (Rainey et al., 2008; Sweet & Watts, 2004). In UK research, there has been some discussion about the fact that children do not often have information on possible occupations direct from employers, yet this may be a means of educating children about the breadth of realistic career pathways (City & Guilds, 2015; Mann et al., 2013). Of course, the Internet is also a source of information (Rainey et al., 2008; Sweet & Watts, 2004), including various sites specifically designed to provide career guidance to young people (and older). LSAC did not collect information about these sources of career information.
Identification and classification of occupational aspirations
To prepare the LSAC data for this publication, a first step was the classification of adolescents' responses about desired occupations, which were captured as text strings. There are different ways this classification might be done (see, e.g., a different classification of occupational aspirations in Patton & Creed, 2007), and given the focus of this analysis was on exploring career aspirations in the context of educational and socio-economic variables, a decision was made to structure the classification around ANZSCO, which groups occupations according to skill levels and specialisations. In future work with these data, with additional coding, it may be possible to use other frameworks or to examine the occupational prestige of adolescents' career aspirations.
The quality of the final data, as classified, is of course dependent on the information collected. In regard to this occupational data, there were some challenges because adolescents did not always provide sufficient detail to allow accurate coding of occupations. However, this may simply reflect that some adolescents are not sufficiently clear about their career futures to allow the identification of exact jobs. Well-known jobs were often mentioned, including "glamorous" ones and ones that are commonly portrayed in the media. In fact, the range of possible jobs is quite likely not known by many adolescents at 14-15 years, no doubt making it difficult for them to identify a particular job they might aspire to. It may be, for example, that there is less awareness among girls of the types of jobs available as engineers or more generally available to those who excel in science and maths. Among boys there may be less awareness of the types of jobs available to those who excel in arts. The quite gendered findings may therefore, in part, reflect different levels of awareness of types of jobs in the labour market by gender.
Key implications and conclusion
There are a few key implications arising from the research presented in this chapter.
- Providing boys and girls with information about potential jobs that suit a range of interests and skills may help them identify possible future careers. This information could challenge gender stereotypes, but should equip adolescents with realistic options, given the range of jobs available in the labour market and the likely educational qualifications of boys and girls.
- Acknowledging that it is not a problem for adolescents to be undecided of their career path, adolescents should be encouraged to explore their skills and interests, looking for future work opportunities that might also suit the values they hold as important. It is important they have access to resources and supports to promote this, particularly for those about to enter the labour market or to make important choices in their education pathway.
- Parents are important supports to adolescents as they develop their ideas and plans for a future career. Some parents may not be well equipped to do this, and may need additional support themselves to help their adolescents find a successful career path.
- Schools can also be where children find out about possible career options. Advice and information given here may be especially valuable for children who will complete their education at secondary school. It also may be valuable for informing children with different sets of skills and interests about a range of realistic education and career pathways.
Understanding the career aspirations of this cohort of adolescents is especially important given that they will be planning for jobs within a labour market that is more insecure and unstable than that of their parents' generation (Rainey et al., 2008). Ensuring adolescents have access to good information and to supports and resources will help these adolescents identify the range of jobs that may be suitable to them and the pathway that will help them achieve their aspirations, or to modify their aspirations to suit their skills and interests and the nature of the labour market.
2.6 References
Auger, R. W., Blackhurst, A. E., & Wahl, K. H. (2005). The development of elementary-aged children's career aspirations and expectations. Professional School Counseling, 322-329.
Australian Bureau of Statistics (ABS). (2013). ANZSCO - Australian and New Zealand standard classification of occupations, version 1.2 (ABS Cat. No. 1220.0 ). Canberra: ABS.
Baird, C. L., Burge, S. W., & Reynolds, J. R. (2008). Absurdly ambitious? Teenagers' expectations for the future and the realities of social structure. Sociology Compass, 2(3), 944-962.
Bandura, A., Barbaranelli, C., Caprara, G. V., & Pastorelli, C. (2001). Self-efficacy beliefs as shapers of children's aspirations and career trajectories. Child development, 187-206.
Beavis, A. (2006). On track? Students choosing a career. Sydney: Smith Family.
Beavis, A., Curtis, D., & Curtis, N. (2005). What do students know about work?: Senior secondary school students' perceptions of the world of work: Sydney: Smith Family.
Bedson, L., & Perkins, D. (2006). A positive influence: Equipping parents to support young people's career transitions: Evaluation of the pacts program. Fitzroy, Vic.: Brotherhood of St. Laurence.
City & Guilds. (2015). Great expectations: Teenagers' career aspirations versus the reality of the UK jobs market. London: The City and Guilds of London Institute.
Creed, P. A., Conlon, E. G., & Zimmer-Gembeck, M. J. (2007). Career barriers and reading ability as correlates of career aspirations and expectations of parents and their children. Journal of Vocational Behavior, 70(2), 242-258.
Erikson, E. (1968). Identity: Youth and crisis. New York: Norton.
Flanagan, C. A., & Eccles, J. S. (1993). Changes in parents' work status and adolescents' adjustment at school. Child development, 64(1), 246-257.
Frigo, T., Bryce, J., Anderson, M., & McKenzie, P. (2007). Australian young people, their families and post-school plans: A research review. Melbourne: Australian Council for Education Research.
Furlong, A., & Biggart, A. (1999). Framing "choices": A longitudinal study of occupational aspirations among 13 to 16 year olds. Journal of Education and Work, 12(1), 21-35.
Gemici, S., Bednarz, A., Karmel, T., & Lim, P. (2014). The factors affecting the educational and occupational aspirations of young Australians. Adelaide, SA: National Centre for Vocational Education Research.
Gottfredson, L. S. (1981). Circumscription and compromise: A developmental theory of occupational aspirations. Journal of Counseling Psychology, 28(6), 545.
Jodl, K. M., Michael, A., Malanchuk, O., Eccles, J. S., & Sameroff, A. (2001). Parents' roles in shaping early adolescents' occupational aspirations. Child development, 72(4), 1247-1266.
Justman, M., & Méndez, S. J. (2016). Gendered selection of stem subjects for matriculation (Melbourne Institute Working Paper Series Working Paper No. 10/16). Melbourne: Melbourne Institute of Applied Economic and Social Research.
Kelly, A. (1989). "When i grow up i want to be …": A longitudinal study of the development of career preferences. British Journal of Guidance and Counselling, 17(2), 179-200.
Mann, A., Massey, D., Glover, P., Kashefpadkel, E., & Dawkins, J. (2013). Nothing in common: The career aspirations of young Britons mapped against projected labour market demand (2010-2020) (Occasional taskforce research paper no. 2). London: Education & Employers Taskforce.
Morgan, M. (2012). Engaging parents in the career development of young people. Hawthorn, Vic.: Career Industry Council of Australia.
Patton, W., & Creed, P. (2007). Occupational aspirations and expectations of Australian adolescents. Australian Journal of Career Development, 16(1), 46-59.
Porfeli, E. J., Hartung, P. J., & Vondracek, F. W. (2008). Children's vocational development: A research rationale. The Career Development Quarterly, 57(1), 25-37.
Rainey, L., Simons, M., Pudney, V., & Hughes, E. (2008). What choice? An evaluation of career development services for young people. Adelaide, SA: National Centre for Vocational Education Research.
Rainey, L. M., & Borders, L. D. (1997). Influential factors in career orientation and career aspiration of early adolescent girls. Journal of Counseling Psychology, 44(2), 160-172.
Sabates, R., Harris, A. L., & Staff, J. (2011). Ambition gone awry: The long term socioeconomic consequences of misaligned and uncertain ambitions in adolescence. Social Science Quarterly, 92(4), 959-977.
Schoon, I., & Polek, E. (2011). Teenage career aspirations and adult career attainment: The role of gender, social background and general cognitive ability. International Journal of Behavioral Development, 35(3), 210-217.
Sikora, J., & Saha, L. J. (2011). Lost talent? The occupational ambitions and attainments of young Australians. Adelaide, SA: National Centre for Vocational Education Research.
Staff, J., Harris, A., Sabates, R., & Briddell, L. (2010). Uncertainty in early occupational aspirations: Role exploration or aimlessness? Social forces, 89(2), 659-683.
Super, D. E. (1980). A life-span, life-space approach to career development. Journal of Vocational Behavior, 16(3), 282-298.
Sweet, R., & Watts, A. G. (2004). Career guidance and public policy: Bridging the gap. Paris: OECD Publications.
Tripney, J., Newman, M., Bangpan, M., Niza, C., Mackintosh, M., & Sinclair, J. (2010). Subject choice in stem: Factors influencing young people (aged 14-19) in education: A systematic review of the UK literature. Executive summary (Wellcome Trust Education Reports). London: Wellcome Trust.
Young, R. A. (1994). Helping adolescents with career development: The active role of parents. The Career Development Quarterly, 42(3), 195-203.
2.7 Appendix
Notes: The ABS occupation estimates (classified using ANZSCO) were matched as best as possible to the classifications used for LSAC. See footnote 2 for a description of some of the ways the classification used for LSAC differs to the ANZSCO classification.
Source: LSAC and ABS 6291.0.55.003 - Labour Force, Australia, Detailed, Quarterly, Feb 2016 EQ08 - Employed persons by Occupation unit group of main job (ANZSCO), Sex, State and Territory, August 1986 onwards.
Notes: Low socio-economic status is quartile 1, middle socio-economic status is quartiles 2 and 3 and high socio-economic status is quartile 4. a The NAPLAN percentages are calculated only over those children with a NAPLAN score matched to LSAC. All differences by family SEP within gender were statistically significant (p < .001).
1 These data were not available for 159 adolescents whose parents did not consent for them to be asked this module of questions. A small number (10) answered "yes" but then indicated that they did not know when asked their desired occupation. They were recoded to "don't know".
2 Responses were initially coded to the sub-major group level (two digits). However, insufficient numbers selecting certain occupations even at the major group level (one digit) necessitated collapsing major and sub-major group categories. Some additional changes were implemented to better match the occupations listed by adolescents. As a result, the classification is based on but does not fully reflect ANZSCO. For example, according to ANZSCO, the occupations of dancer and actor fit within the professional "arts" category, but they have been reclassified into a new "performing arts and production" category that is placed in the classification near "sports", as it seemed that girls' selection of occupations such as "ballet dancer" and "actor" should be coded in a similar way to boys' selection of "professional football player". It was not always possible to determine with certainty to which classification a response belonged, given insufficient detail in some responses. For example, a response of "engineer" could mean a professional engineer, to be classified in the "professional" group, or a specific type of engineer, such as automotive engineer, which would be coded as "technician and trade". In this case, general responses of "engineer" were coded to the category of "professional". Some stated occupations were clearly identified (e.g., physiotherapist, journalist, lawyer, architect, hairdresser, mechanic) while some were very general (e.g., "something to do with animals"; "something with computers"). Responses were matched to the category that best fit the response given.
3 Categories that appeared to have a disproportionate number of "fantasy" selections were ICT professionals (including "games developer", "Youtuber", "blogger"), sports jobs (e.g., professional AFL player, professional skateboarder, stunt car driver), and in performing arts (e.g., actor, ballet dancer), but they appeared across various occupations (e.g., fashion designer, rocket scientist, heart surgeon, military sniper). As noted in the text, for some children these may be realistic but it is assumed that they are "fantasy" since they represent only a very small percentage of actual jobs in the labour market.
4 This is consistent with coding to the occupation with the highest prestige, but given the uncertainty about coding some adolescents' responses, this is not as precise a measure as might be attained if analysing actual occupations.
5 This would require a more sophisticated approach than can be easily presented here. While there are numerous other child and family variables that may be of interest that are not explored here, the literature suggests that the educational and socio-economic status ones that have been included are expected to be the most relevant.
6 The proportion with known versus unknown desired occupation varied significantly by gender (p < .05), with differences in the distributions in the broad and detailed occupation groupings shown in Table 2.3 also significant (p < .001).
7 This is somewhat different to parents' reports, with parents less-often expecting adolescents will achieve a post-graduate qualification (10% for boys and 11% for girls), with more expecting adolescents to achieve a university qualification (48% of boys and 64% of girls).
8 The distribution of NAPLAN scores for writing did not allow the scores to be divided to give 25% in each group, instead resulting in 28% in the lowest "quartile" and 21% in the highest "quartile". For numeracy and reading the distributions were close to 25% in each category.
9 For example, of those who expected to achieve only school qualifications, 5% were in the highest quartile for numeracy; of those who expected to achieve trade or vocational qualifications, 6% were in the highest quartile; of those who expected to complete a bachelor degree, 27% were in the highest quartile; and of those who expected to achieve post-graduate qualifications, 38% were in the highest quartile.
10 Of course, other factors not explored in this chapter (e.g., parents' occupations) may also contribute to adolescents' aspirations, and help explain variation by family socio-economic status.
Share


