8. Maternal age and family circumstances of firstborn children
8. Maternal age and family circumstances of firstborn children
8.1 Introduction
As in other Western countries, the age at which women in Australia become mothers has increased over the last 50 years. In the 1950s-1960s, almost half of all women who became mothers in Australia had their first child in their early 20s; in 2014, 46% of new mothers were aged 30 years and older (Australian Institute of Health and Welfare [AIHW], 2016)1 and the majority of these births are to cohabiting parents. The proportion of babies born outside marriage has increased from around 5% in the 1950s-1960s to 34% in 2014 (Australian Bureau of Statistics [ABS], 2015).
Studies have found that teenage mothers are particularly likely to be disadvantaged in a range of areas (for Australian studies, see Aitken et al., 2016; Bradbury, 2006; Kalb, Le, & Leung, 2014; Marino, Lewis, Bateson, Hickey, & Skinner, 2016). While having a child when a teenager can limit these mothers' chances of pursuing further education and establishing a career, it appears that those who become mothers as teenagers tend to be already experiencing disadvantaged circumstances in many areas of their lives (e.g., Bradbury, 2006).
Using data from Wave 1 of the B cohort of LSAC, Weston, Soriano, and Qu (2006) compared various circumstances of mothers, according to the age at which they had their first child. The authors found that teenage mothers were the most likely to experience socio-economic disadvantages. However, the women who had their first child in their early 20s were also more likely than those who had their first child at older ages to experience disadvantaged circumstances. Together with the teenage mothers, these mothers were more likely than the older groups to be living without a partner, have low income and low educational attainment levels, and less likely to be employed.2 However, they were just as confident in their role as parents and as likely to express warmth to their child, but also slightly more likely to respond harshly towards the child (e.g., become angry with the child, lose their temper, shout at their child).
With regard to older mothers, a great deal of the research has focused solely on the health-related risks for mother and child (Brown, 2016; Li et al., 2013). Women may delay having their first child for many reasons (e.g., changing priorities as they age, earlier relationship separation, inability to find a partner they consider suitable, having a partner who already has children or does not want children, and perceived inability to afford a child) (see Weston, Qu, Parker, & Alexander, 2004). The analyses by Weston et al. (2006) suggested that the women who became mothers at age 38 or older tended to be better off than those who became mothers before age 25 across virtually all wellbeing indicators examined. However, compared with the women who became mothers between the ages of 25 and 37, the oldest mothers tended to have lower educational attainment levels and were slightly less likely to be employed. They also tended to have lower gross family incomes than those who had their first child at 25 to 37. It should be noted, however, that the sample of women in the oldest group was small.3
This chapter focuses on the question: Does maternal age have a bearing on the family circumstances in which children are raised over their first 10 years of life? Selected measures of family composition, socio-demographic circumstances and self-reported parenting practices of LSAC mothers are compared according to their maternal age, using the same five maternal age cut-offs as those used by Weston et al. (2006). It extends the earlier study in two ways: by tracking these mothers over 10 years, from 2004-2014 (Waves 1-6), and by including data for K-cohort mothers where possible.
The analyses focus on:
- family composition (family type, number of children and, for partnered mothers, whether in registered marriage or cohabiting);
- mothers' socio-economic circumstances (i.e., educational attainment, maternal employment and the family's financial circumstances); and
- parenting practices.
The next section explains the sample of mothers focused on and the number of mothers represented in each survey wave. This is followed by an outline of the results covering aspects of mothers' living arrangements, indicators of their socio-economic circumstances, and their self-reported parenting practices. A synthesis of these results and a reflection on their meaning are then provided.
8.2 The sample
As explained above, the sample used for this chapter is mothers for whom the LSAC study child was their firstborn child; and the analysis focuses on maternal age (i.e., their age when they became mothers).4 Table 8.1 shows the number of mothers in each "maternal age" subgroup across the survey waves. Some of the subgroups in these studies, which focused on mothers with B-cohort children in Wave 1, were already quite small (as shown in the top panel of Table 8.1), and became even smaller in later waves due to sample attrition. For this reason, the data for these mothers are combined with those of mothers of K-cohort children where possible. In addition to the omission of all mothers for whom the LSAC study child was not their firstborn, two small groups of other mothers were omitted from the sample: (a) those who were not the primary carer of the study child, given that the information collected from these mothers was more limited; and (b) those who reported in Wave 1 that they had children living elsewhere, where the ages of these children were not recorded.
To overcome the issue of small subgroup sample sizes, the Wave 1 data for mothers of K-cohort firstborn children were combined with the Wave 3 data for mothers of B-cohort firstborn children, as these children were all 4-5 years old. The B- and K-cohort data were also combined when the children were 6-7, 8-9 and 10-11 years old. Data for children at ages 0-1 and 2-3 were only available for mothers of B-cohort children, and data for mothers of K-cohort children in Waves 5 and 6, when their children were over 11 years old, were not included due to small numbers in some subgroups.5
After Wave 1, some mothers (and their study child) may have missed a wave and later returned, but the net effect was one of increasing attrition. This net attrition rate was highest for the women who became mothers as teenagers, followed by those who entered motherhood when in their early 20s. For example, for the B-cohort mothers, only 46% of teenage mothers (n = 61) and 59% of those in their early 20s (n = 197) participated in Wave 6, compared to over 80% of the new mothers in the three older age groups (25+ years). Similarly, among K-cohort mothers, Wave 6 participants represented 45% and 57% of those who had their first child when teenagers or in their early 20s respectively (n = 73 and 244 respectively) and participated in Wave 6 interviews, compared to over 75% of those who had their first child when aged 25 years and over. (The number of K-cohort mothers in Waves 5 and 6 are not shown in the table.)
Across maternal age and cohort (B or K cohort), systematic differences emerged in some of the characteristics of those who had dropped out of the study by Wave 6, compared to those who continued to participate. For example, of B-cohort mothers in Wave 1, those who had dropped out were more likely to have been single (19% vs 8%), not employed (57% vs 38%), and without any post-school qualification (39% vs 24%). These biases in the results associated with attrition in this chapter were in the same direction for all maternal age groups.
| Maternal age (years) | Age of study child (years) | |||||
|---|---|---|---|---|---|---|
| 0-1 | 2-3 | 4-5 | 6-7 | 8-9 | 10-11 | |
| B cohort | W1 (2004) | W2 (2006) | W3 (2008) | W4 (2010) | W5 (2012) | W6 (2014) |
| 15-19 | 134 | 104 | 88 | 77 | 70 | 61 |
| 20-24 | 331 | 282 | 261 | 244 | 227 | 197 |
| 25-34 | 1,160 | 1,059 | 1,032 | 1,019 | 984 | 929 |
| 35-37 | 143 | 137 | 132 | 126 | 123 | 119 |
| 38+ | 85 | 83 | 81 | 80 | 77 | 75 |
| K cohort | W1 (2004) | W2 (2006) | W3 (2008) | W4(2010) | ||
| 15-19 | 112 | 88 | 78 | 73 | ||
| 20-24 | 332 | 275 | 262 | 244 | ||
| 25-34 | 1,225 | 1,127 | 1,116 | 1,099 | ||
| 35-37 | 135 | 125 | 125 | 120 | ||
| 38+ | 61 | 57 | 57 | 53 | ||
| B and K cohorts | ||||||
| 15-19 | 134 | 104 | 200 | 165 | 148 | 134 |
| 20-24 | 331 | 282 | 593 | 519 | 489 | 441 |
| 25-34 | 1,160 | 1,059 | 2,257 | 2,146 | 2,100 | 2,028 |
| 35-37 | 143 | 137 | 267 | 251 | 248 | 239 |
| 38+ | 85 | 83 | 142 | 137 | 134 | 128 |
Note: "Maternal age" refers to the mothers' age at the time they gave birth to their first child (i.e., their study child in this chapter).
As noted above, mothers of B-cohort and K-cohort children were both interviewed in the four waves of data collection when their study child was aged from 4-5 years to 10-11 years old. The patterns of results for each cohort tended to be similar. For simplicity, the results based on the combined samples of the two cohorts are therefore presented, and any clear differences in results are discussed. The results reported in this chapter are based on unbalanced panel data (as shown in Table 8.1.7 Any clear inconsistencies in the results based on balanced and unbalanced data are discussed below.
8.3 Living arrangements
This section examines two aspects of the children's family composition - family type and the subsequent birth of siblings - and for children in couple families, whether their mother was married or cohabiting (regardless of whether their partner was the child's biological or step-father).
Three family types were identified on the basis of whether the mother was living with their (first) child's father or with another partner, or whether she was unpartnered. Families headed by single parents (most of whom are single mothers) are considerably more likely than other families to experience multiple disadvantages that are both deep and persistent (McLachlan, Gilfillan, & Gordon, 2013). It is not surprising then, that children in families headed by single mothers have a higher risk of poor outcomes across a range of areas, despite the fact that many children in these families do well (see Qu & Weston, 2012).
The birth of a child typically has many repercussions for existing family members and the family as a whole. For example, financial and time costs for parents are particularly strong when they become parents for the first time, while increases in the costs associated with subsequent births become progressively smaller, reflecting economies of scale in both time and money. However, the bulk of changes occur in the way mothers spend their time, resulting in increases in the gender division of domestic labour (Craig & Bittman, 2005).
Finally, although most couples delay having children until they are married, increasing proportions have children while cohabiting. Parents in cohabiting relationships (including those whose children are born of the relationship) are more likely to separate than those in married relationships - a clearly disruptive experience for children and their parents (see Qu & Weston, 2012).
Figure 8.1: Family type, by maternal age and age of study child
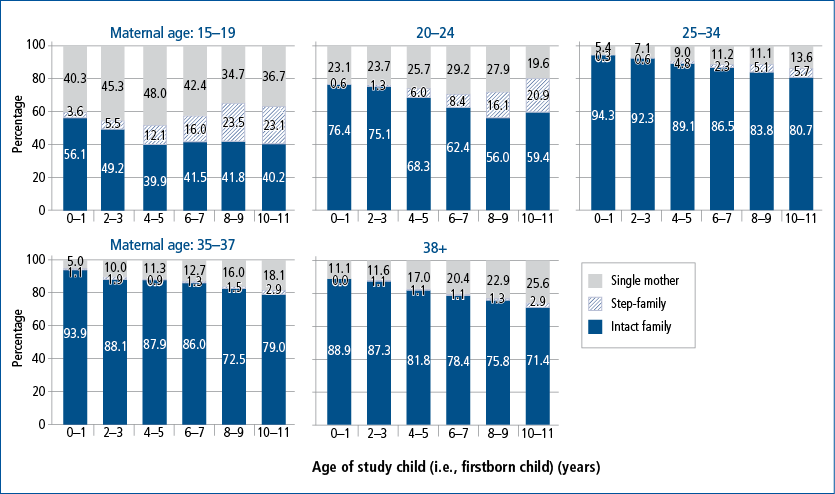
Note: "Maternal age" refers to the mothers' age at the time they gave birth to their first child (i.e., their study child in this chapter). For each maternal age group, by age of study child, the percentages in an intact family, step-family and single-mother family add to 100.0, any variation is due to rounding.
Source: Combined data from B and K cohorts as shown in Table 8.1.
Previous research by Weston et al. (2006), which focused on the mothers at the time when their first child was an infant (i.e., LSAC B-cohort children in Wave 1), showed that mothers under 25 years old, especially teenage mothers, were considerably more likely than older mothers to be unpartnered at this time. In subsequent waves of LSAC, some of the mothers who had been living with a partner in Wave 1 had separated, and partnering and re-partnering also occurred.
Figure 8.1 depicts the proportions of the LSAC mothers represented in the three family forms across the waves, according to the age they had their first biological or adopted child (remembering that we have excluded all study children who were not firstborns). For simplicity, these three forms are referred to as "intact families"8 where the mother was living with the child's biological father, "step-families" where the mother was living with a partner who is not the biological father of their child, and single-mother families where the mother was not living with a partner.9
- In Wave 1, 56% of the youngest mothers were in intact families, compared to 76% of the second youngest group, 94% in the next two age groups, and 89% in the oldest group.
- Mothers who had their first child when teenagers continued to be the least likely to be living with their child's father, followed by those who became mothers when in their early 20s, while those who became mothers during the relatively "normative years" (between 25-34 years), along with those who were slightly older than this (35-37 years), were particularly likely to have continued living with their child's father.10
- The likelihood of living in an intact family tended to decrease across time for all groups, especially for the two youngest groups and the oldest group.
- Across the years (from when the child was an infant to the time the child was 10-11 years), mothers who had their child when a teenager were the most likely of all groups to be single, while those who became mothers at the normative age of 25-34 years were the least likely to be in this family form, with the difference between these two groups being greatest when their child was aged 4-5 years.
- Except when their child was 10-11 years, the women who became mothers in their early 20s were the second most likely of all groups to be single. By the time their child reached 10-11 years, a slightly lower (though not statistically significant) proportion of these mothers were single, compared with mothers in the oldest age group (20% vs 26%).
- While Figure 8.1 shows that the proportion of the oldest group who were in an intact family fell by 18 percentage points across the survey waves, Figure 8.1 also shows these mothers were unlikely to have re-partnered by the time their child was aged 10-11 years, and hence were the second most likely group to be single by this period in their child's life.
Figure 8.1 shows the proportion of mothers who were living with a partner who was not their (first) child's father (i.e., they and their child were in a step-family):
- When their child was an infant (aged 0-1 year), only 4% of teenage mothers and 1% (or fewer) of mothers in all other age groups had formed step-families.
- Step-family rates increased to 21-23% by the time the child was 10-11 years for the two youngest groups, 6% for the third youngest group (who became mothers when aged 25-34 years), and 3% for the two oldest maternal age groups.
Table 8.2 shows the proportions of partnered mothers who were cohabiting rather than married.
- Of those who were living with a spouse or with a partner when their child was an infant, the teenagers were the most likely to be in a cohabiting relationship (71%), followed by those who became mothers at ages of 20-24 years (45%). Only around one-fifth of partnered mothers in the three older groups were cohabiting.
- Over the years, mothers who had their child when they were teenagers continued to have the highest rate of cohabitation, followed by those who became mothers at ages of 20-24 years. However, for both groups of mothers, the rate of cohabitation fell11 until the time their child was 4-5 years (from 71% to 49% and from 45% to 24% respectively) and then remained stable. In contrast, cohabitation rates were quite stable for the three older groups across the 10-year period.
Note: "Maternal age" refers to the mothers' age at the time they gave birth to their first child (i.e., their study child in this chapter).
Source: Combined data from B and K cohorts as shown in Table 8.1.
Figure 8.2: Number of children in the family, by maternal age at first birth and age of study child
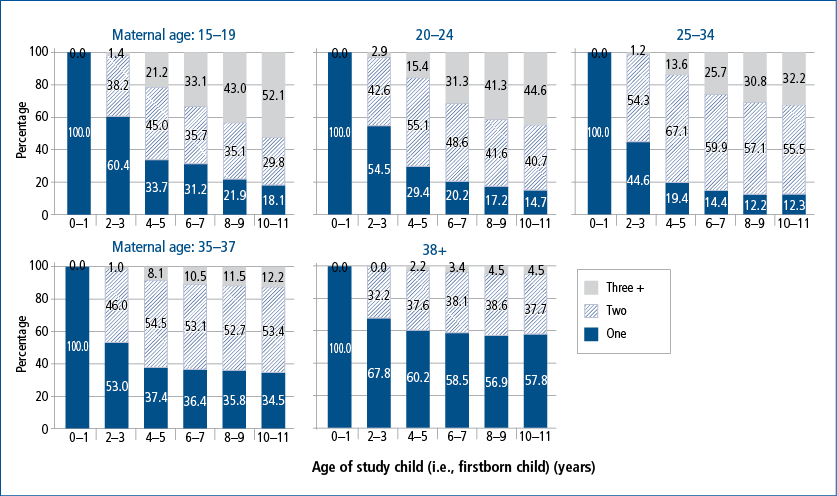
Notes: "Maternal age" refers to the mothers' age at the time they gave birth to their first child (i.e., their study child in this chapter). Children include any subsequent new biological or adopted children, along with step-children living in the household. One child means that no children other than the study child were living in the household. For each maternal age group, by age of study child, the percentages with one, two or three or more children add to 100.0, any variation is due to rounding.
Source: Combined data from B and K cohorts as shown in Table 8.1.
While the discussion above focuses on the relationship status of mothers, Figure 8.2 shows the extent to which family composition changed through the birth (or adoption) of additional children, or through additional children entering the family as a consequence of the (study child's) mother having formed a new relationship (i.e., step-children).
- As would be expected, the number of additional children was clearly age-related. By the time their first child was 10-11 years, most mothers in all groups except the oldest group had at least one other child. This was the case for over 80% of mothers who had their first child when under 35 years old, around 65% of mothers who had their first child at 35-37 years, and around 40% in the oldest group.
- In addition, the younger their maternal age, the more likely they were to have had an additional two children (i.e., at least three children in total). Ten years after they had their first child, more than one-half of the youngest group (52%) and 45% of the second youngest group had at least two additional children, compared with only 5% of the oldest group and 12% of the second oldest group.
- Having two children was most common among those who had their first child when aged 25-34 years and 35-37 years (53-55%), and least common for those who became mothers as teenagers (30%).
It is worth noting that the younger their age at the birth of their first child, the more likely mothers were to subsequently have additional children who were half-siblings or step-siblings to the first child (results not shown). For example, by the time their first child was 10-11 years, 29% of mothers in the youngest group and 14% in the second youngest group either had children born of new relationships or step-children in the household, while this applied to under 4% of mothers in the older groups. This pattern reflects the complex family relationships that some mothers in the younger groups and their firstborn children (and the additional children) needed to navigate.12
8.4 Socio-economic characteristics
This section focuses on three commonly used domains of socio-economic status: educational attainment level, employment status, and financial wellbeing (self-reported prosperity and whether any financial hardship had been experienced in the previous 12 months).
Education
Mothers' educational attainment was classified into three levels: having left school before Year 12 and not achieved a subsequent qualification (here referred to as having "left school early"); having completed Year 12 or achieved a certificate or diploma but no degree; and having achieved a degree or higher qualification. Table 8.3 shows the proportions of mothers in each maternal age group who had left school early and the proportions who had attained a degree or higher qualification (here called "lowest" and "highest" educational attainment levels respectively).
When their child was an infant:
- The majority of teenage mothers had left school early (two in three - a rate that was more than twice that of any other groups).
- A minority of those who had their child in their early 20s had left school early (around one in five), and an even smaller minority had achieved a degree by this stage (around one in ten). The remainder had achieved a non-degree post-school qualification, such as a certificate, or completed year 12 without a non-degree, post-school qualification.
- More than half of the oldest mothers had a degree, but a substantial minority (around one in five) had left school early.
- The overall profiles of mothers who had their child when aged 25-34 years and 35-37 years were the most similar.
- The three older groups of mothers were more than twice as likely as the two younger groups of mothers to have attained a degree or higher qualification.
By the time their child was 10-11 years, differences in the educational profiles of teenage mothers and other mothers appeared to have narrowed - especially in relation to the proportions with the lowest attainment level, but also in relation to achieving a degree. The results suggest that:
- Half of the teenage mothers with the lowest educational attainment levels when their child was an infant had completed Year 12 and/or acquired a non-degree, post-school qualification, while 10% of all mothers in this youngest age group had attained a degree or higher qualification. However, these mothers remained the most likely of all groups to have the lowest educational levels.
- Some of the mothers who had their (first) child in their early 20s had also attained a higher education level since having their first child, with the proportion with a degree or higher qualification increasing from 10% to 17%.
- On the other hand, the educational profiles of the three older groups changed little over the ten-year period.
However, the above results do not take into account the fact that attrition rates varied according to maternal age and educational attainment levels. Nor do they take into account the fact that the data for K-cohort mothers were not included until their child was 4-5 years old. As discussed above, some mothers withdrew from one survey wave but then returned, though the overall trend was for accumulating attrition across survey waves. Attrition was most common among teenage mothers, followed by those in their 20s, and was considerably less common among the three older groups. In addition, for each maternal age group, the mothers with the lowest educational attainment level were more likely than the other mothers to withdraw from the study.13 Although the number of B-cohort mothers in the two youngest groups who participated in each wave were small (see Table 8.1, it seems reasonable to suggest that, compared to their older counterparts, those with a very young maternal age would be more likely to complete secondary education and or further education after their first child was born.
Notes: "Maternal age" refers to the mothers' age at the time they gave birth to their first child (i.e., their study child in this chapter). Three levels of educational attainment were derived. One group - those who had completed Year 12 and/or acquired a non-degree post-school qualification - are not represented in this figure. The figure is based on the unbalanced panel. The decrease in proportions with a degree or higher qualification over time is a result of sample attrition as well as the combination of cohorts.
Source: Combined data from B and K cohorts as shown in Table 8.1.
Employment
The movement of mothers into the labour force represents one of the most dramatic changes in family life over the last several decades (Baxter, 2013a). In addition to personal characteristics such as educational attainment and career history, family characteristics play a major role in determining the mothers' employment decisions (or aspirations), including hours of work. Of these family characteristics, the age of the youngest child is perhaps the most significant factor for mothers, in general, with family type (couple parents or single parents living with children) also being important (Baxter, 2013b, 2013c). Employed mothers may reduce their paid work hours or leave paid work altogether should they have another child. Figure 8.3 depicts the proportion of mothers in each maternal age group who were employed full-time or part-time and the total proportion in paid work over the ten-year period.
Figure 8.3: Proportions of mothers who were employed, by maternal age and age of study child
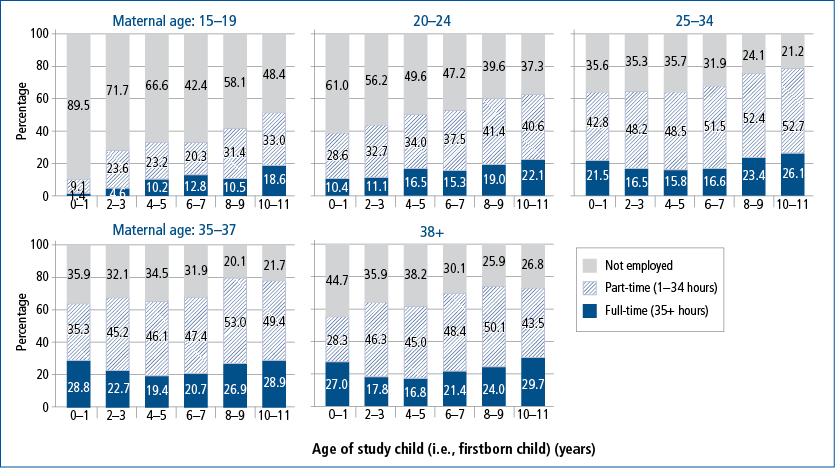
Note: "Maternal age" refers to the mothers' age at the time they gave birth to their first child (i.e., their study child in this chapter). The percentage of mothers who were not employed is not shown. For each maternal age group, by age of study child, the percentages working part-time, full-time or not employed add to 100.0, any variation is due to rounding.
Source: Combined data from B and K cohorts as shown in Table 8.1.
Regarding the overall employment rates (full-time or part-time employment), the following patterns emerged:
- The employment rates of mothers in all age groups increased overall across the ten-year period, though some "dips" in employment rates occurred during this period, most likely reflecting the birth of an additional child.14
- Not surprisingly, the greatest increase in employment rates occurred for the groups with the lowest employment rates when their child was an infant. These were the two youngest groups, especially the teenagers.
- Only 10% of the teenagers were employed when their child was an infant. Ten years later, the employment rate for these mothers was more than five times higher, representing just over half of these mothers.
- The employment rate of mothers who were in their early 20s when their child was an infant increased from 39% to 63% over the ten-year period - that is, from around two in five of these mothers to around three in five.
- The employment rates of the other three groups were more similar across time (especially for those who had their child when aged 25-34 years and 35-37 years).
- Of these three older groups, those who had their child when 38 years or older had the lowest employment rate when their child was born (55% vs 64%), with the gap having narrowed slightly 10 years later (73% vs 78-79%).
- Although the levels of increase in employment rates were greater for the two youngest groups (especially those who had their child when a teenager) than the older groups, the youngest group of mothers continued to have the lowest rates, followed by the second youngest group, across the ten-year period. To some extent, this would be related to their relatively lower levels of educational attainment and their having a larger number of children, on average, compared to mothers who had their first child when older.
The following trends emerged in relation to the proportions of mothers working full-time and part-time:
- With the exception of those in the oldest maternal age group, mothers were considerably more likely to work part-time than full-time across the different periods. When their child was an infant, those in the oldest maternal age group had virtually the same proportions working full-time and part-time (27-28%).
- The proportion of mothers in the two oldest groups who were working full-time fell from the time their child was an infant to age 2-3 years (from 27% to 18% for the oldest group and from 29% to 23% for the second oldest group). A small fall in the proportion working full-time was also apparent for mothers who had their first child at the normative age of 25-34 years (from 22% to 17%).
- Across the ten-year period, the greatest increase in the proportion of mothers working full-time was apparent for the youngest group (from 1% to 19%), followed by the second youngest group (from 10% to 22%).
- The increase in part-time employment rates (which was apparent for all groups) was also greatest for the teenage mothers (from 9% when their child was an infant to 33% when their child was 10-11 years old). Nevertheless, these mothers had the lowest rates of full-time and of part-time work across virtually all years.15
Financial circumstances
Regardless of their general longer-term direction, a family's financial circumstances can ebb and flow considerably, according to changes in income, non-cash benefits, costs, discretionary spending decisions and so on. These can be affected by many factors, including parental separation or re-partnering, the birth of new children, changes in labour-force circumstances of either parent in the household, changes in care responsibilities (including for children with additional needs, the elderly or other family members), housing tenure and residential relocation. A primary responsibility of families is to meet family members' basic needs for food, housing, clothing, health care and education. Financial circumstances are therefore clearly important to family functioning and the wellbeing of family members. Substantial government support is provided but families that rely solely or mainly on government support may well struggle to make ends meet. As noted above, many couples decide to postpone childbearing until they achieve what they see as a secure financial base. In addition, despite the adage that "money doesn't buy happiness", there is ample evidence that financial difficulties tend to generate a great deal of distress.16 Financial circumstances can be measured objectively and subjectively. This section focuses on two measures: mothers' assessment of financial circumstances (i.e., a subjective measure) and their experience of financial hardships (measured objectively).
Mothers' assessments of financial circumstances
The subjective measure was based on mothers' responses to the question: "Given your current needs and financial responsibilities, how would you say you and your family are getting on?" Six response options were provided: three suggested generally favourable circumstances ("prosperous", "very comfortable" and "reasonably comfortable") and the other three suggested some level of struggle ("just getting along", "poor" and "very poor"). Taken as a single group, the mothers focused on in this chapter most commonly indicated that they were reasonably comfortable across all survey waves (47-51% of all these mothers, regardless of their maternal age). "Just getting along" was the second most common response, applying to 22-31%. In each survey wave, the mothers were more likely to indicate that they and their family were in a "prosperous" or "very comfortable" position (18-26%), than to describe their financial circumstances as "poor" or "very poor" (2-3%).
To simplify the comparisons of maternal age groups, we created three categories, classifying the responses as suggesting they were "well-off" (prosperous or very comfortable), "comfortable" (reasonably comfortable) or "struggling" (just getting along, poor or very poor). Figure 8.4 depicts the percentages of mothers providing these assessments according to their maternal age and their child's age.
When their child was an infant:
- Overall, similar proportions in each maternal age group considered themselves to be well-off (15-20%).
- The proportions of mothers describing their circumstances as reasonably comfortable varied by maternal age, ranging from 37% (the youngest mothers) to 50% (those with a maternal age of 25-34 years).
- The youngest and the oldest groups were the most likely of all groups to indicate that they were struggling at this stage in their child's life (43-45% vs 33% of all other three groups).
When their child was aged 10-11 years:
- By this stage, all groups most commonly indicated that they were reasonably comfortable, with those with a maternal age of 35-37 years being the least likely to state this (39% vs 50-54%).
- Overall 22-31% indicated that they were struggling, with mothers with a maternal age of 25-34 years being the least likely to state this, followed by the oldest group (25%). Much the same proportions of mothers in the other three groups indicated that they were struggling (29-31%).
- During this period, the greatest diversity between groups emerged in the proportions indicating that they were well-off: such assessments ranged from 15% (for those who had their child in their early 20s) to 31% (for those who became mothers when of 35-37 years old).
Figure 8.4: Proportions of mothers who provided different assessments of their financial circumstances, by maternal age and age of study child
Notes: "Maternal age" refers to the mothers' age at the time they gave birth to their first child (i.e., their study child in this chapter). For each maternal age, by age of study child, the percentages of mothers describing their circumstances in the ways represented in this figure sum to 100, any variation is due to rounding.
Source: Combined data from B and K cohorts as shown in Table 8.1.
Financial hardship
To assess financial hardship (the more objective of the two measures), parents were asked whether they had experienced the following circumstances over the previous 12 months because they were short of money: they could not pay gas, electricity or telephone bills on time; they could not pay mortgage or rent payments on time; any members of the household went without meals; they were unable to heat or cool their home; they pawned or sold something because they needed the cash; or they sought assistance from a welfare or community organisation.17 Figure 8.5 shows the proportions of mothers who reported having experienced one or at least two such hardships in the previous 12 months.
Figure 8.5: Proportions of mothers who reported experiencing a single or multiple forms of financial hardship, by maternal age and age of study child
Notes: "Maternal age" refers to the mothers' age at the time they gave birth to their first child (i.e., their study child in this chapter). Mothers reporting no hardship are not represented in this figure. For each maternal age, by age of study child, the percentages of mothers describing their circumstances in the ways represented in this figure sum to 100, any variation is due to rounding.
Source: Combined data from B and K cohorts as shown in Table 8.1.
Across all six time-points covering ten years, the two youngest groups were more likely than the older groups to report having experienced at least one form of hardship in the previous 12 months.
When the child was an infant, the patterns of results for the two youngest groups were similar. However, when their child was older, patterns for the youngest groups varied somewhat, whereas the patterns for the three older groups remained fairly similar across the later time points.
- When their child was an infant, women who became mothers as teenagers or in their early 20s were considerably more likely than those in the other three groups to indicate the experience of some form of hardship in the previous 12 months (42-43% vs 18-22%).
- Differences between the three older groups were relatively small.
- Although trends for each group tended to vary somewhat across time, such variation was greatest for the second youngest group. These mothers were most likely to report some form of hardship when their child was an infant (43%) and least likely to do so when their child was 2-3 years old and 10-11 years old (25-28%).
- Across the survey waves, the two youngest groups were also more likely than the older three groups to report at least two different types of hardship experienced in the previous 12 months.
- The youngest group was more likely to report multiple hardship experiences than a single form in the first four survey waves (from when their child was an infant to age 6-7 years). Thereafter, reports of a single form of hardship experience predominated.
- Teenage mothers were the only group who were more prone to report multiple hardships than a single hardship in some periods. Mothers in all other groups were more prone to report a single rather than multiple hardship experiences for some years, and equally prone to report single and multiple hardship experiences for other years.
8.5 Parenting practices
Various studies have suggested that, other things being equal, children tend to do well developmentally where the parenting they receive is generally characterised by high levels of warmth, consistency, inductive reasoning and self-efficacy and low levels of irritability, hostility and over-protectiveness (see Lucas, Nicholson, & Maguire, 2011; Zubrick, Lucas, Westrupp, & Nicholson, 2014). In each of the LSAC waves, parents have been asked a series of questions to gauge the extent to which they adopted these approaches in relation to their study child. In this section, we focus on four of these self-reported behaviours of mothers towards their first child: warmth, inductive reasoning, parenting consistency, hostile/angry parenting (here referred to as parenting harshness).
The parental warmth scale was based on parents' responses to six questions about how often they: a) express affection by hugging, kissing and holding this child; b) hug or hold this child for no particular reason; c) tell this child how happy he/she makes you; d) have warm, close times together with this child; e) listening to the child (omit this part if child was 0-1 years) and doing things with him/her; f) feel close to the child both when he/she is happy and when he/she is upset.
The inductive reasoning scale was constructed from parents' responses to three items about how often they: a) explain to this child why he/she is being corrected; b) talk it over and reason with the child when he/she misbehaves; c) give the child reasons why rules should be obeyed.
The parenting consistency scale was based on five questions: a) When you give this child an instruction or request to do something, how often do you make sure that he/she does it? b) If you tell this child he/she will get punished if he/she doesn't stop doing something, but he/she keeps doing it, how often will you punish him/her? c) How often does this child get away with things that you feel should have been punished? d) How often is this child able to get out of a punishment when he/she really sets his/her mind to it? e) When you discipline this child, how often does he/she ignore the punishment?
The scores derived for parental warmth, inductive reasoning and consistency range from 1 to 5, with higher scores indicating positive parenting practices (i.e., a greater tendency to express warmth, use inductive reasoning and apply consistency).18 The precise nature of these measures differs somewhat according to the child's age. Not surprisingly, inductive reasoning was not measured for B-cohort children in Wave 1 (when the child was aged 0-1 year). In addition, the measurement of parenting consistency commenced in Wave 3 for B-cohort children (when the children were 4-5 years old).
The parenting harshness scale here refers to a measure called "hostile parenting" for Waves 1 and 2 for the B cohort and called "angry parenting" for the remaining waves for the B cohort and all waves for the K cohort.
The hostile parenting scale was based on parents' responses to the following the five statements that described their feelings in the previous four weeks: a) I have been angry with this child; b) raised voice with or shouted at this child; c) the child gets on my nerves when crying; d) lost my temper with this child; e) left this child alone in his/her bedroom when the child was particularly irritable or upset. The response options were from 1 (not at all) to 10 (all the time). The scores, the mean of the responses, ranged from 1 to 10, with higher scores meaning that the parent was more frequently hostile towards the child.
The angry parenting scale was based on four questions: a) Of all the times you talk to this child about his/her behaviour, how often is this praise?; b) Of all the times you talk to this child about his/her behaviour, how often is this disapproval?; c) How often are you angry when you punish this child?; d) How often do you feel you are having problems managing this child in general? The response options were from 1 (never/almost never) to 5 (always/almost always). The scores of this scale were the mean of responses to the questions, after the responses to the first item were revised. Higher scores indicate more frequent anger towards the child.
In this chapter, we focus on the proportions of mothers who indicated that they adopted relatively high levels of each parenting practice measured. Relatively high levels of warmth, inductive reasoning and consistency were defined as scores of 4-5 on the relevant 5-point scales. Compared with these behaviours, mothers were considerably less inclined to indicate that they adopted harsh parenting. Indeed, only a small proportion of mothers had scores at the mid-point and above of the harshness scales.19 For this reason, we used a lower threshold (the mid-point of the scale) in classifying "relatively harsh parenting". That is, relatively harsh parenting was defined as scores of 5.5-10 on the 10-point scale (used for B-cohort mothers in the first two waves) and as scores of 3.5-5 on the 5-point scale (used for B-cohort mothers in subsequent waves and for K-cohort mothers in all waves).20 The results are shown in Table 8.4.
Parental warmth
- Regardless of the age the mothers had their child and the survey wave, most reported a great deal of warmth towards their child (65-98%). This pattern persisted over the ten-year period.
- When their child was an infant, the proportion of mothers who reported a high level of warmth toward their child was similar across the maternal age groups (92-96%).
- The proportions of mothers in all age groups who reported high warmth fell over the ten-year period (from 92-96% when their child was an infant to 64-78% by the time the child was 10-11 years old).
- This fall was more marked for the teenage mothers (falling by 33 percentage points, compared with 17-20 percentage points for other groups of mothers).
- By the time their child was 10-11 years old, only 64% of teenage mothers reported high parental warmth compared with 73-78% of mothers in other age groups. While women who became mothers in their early 20s were more similar to teenage mothers than older mothers in terms of various socio-demographic characteristics (Weston et al., 2006), they were more similar to the older maternal groups than the teenage mothers in terms of their tendency to report high warmth towards their child.
Inductive reasoning
- Across all time points examined (from when their child was a toddler (2-3 years) to 10-11 years, most mothers reported adopting a high level of inductive reasoning to help their child learn rules and to correct their behaviours (67-90%).
- When their child was a toddler, mothers who had their child when a teenager were the least likely of all the maternal groups to report a high level of inductive reasoning (67% vs 81-90%).
- With the exception of teenage mothers, a greater proportion of mothers reported high inductive reasoning when their child was aged 2-3 years than when their child was either 8-9 years or 10-11 years.
- The mothers who gave birth to their firstborn when in their teens provided the most variable picture. The proportion reporting high inductive reasoning increased and then declined, peaking when their child was 6-7 years (85%).
- While the proportions of mothers reporting high inductive reasoning fell for the four older maternal groups, this difference was the largest for the two oldest age groups (representing a 14 percentage point difference over the eight years),21 and lowest for those who become mothers in their early 20s (falling by 5 percentage points).
Notes: "Maternal age" refers to the mothers' age at the time they gave birth to their first child (i.e., their study child). a) Scores on the parental warmth, inductive reasoning and consistency scales range from 1 to 5, with higher scores indicating more positive parenting practices in these areas (i.e., greater parental warmth and greater use of reasoning and consistency). In the present analysis, scores of 4-5 were taken as indicating high use of these behaviours. The three items comprising the inductive reasoning scale were not identical in all waves. b) The measure of parenting harshness for the B-cohort for Waves 1 and 2 (when the study children were under 4 years old) differed from the measure used when they were 4-5 years and older, with the nature of items and length of rating scale varying. A 10-point rating scale was used when the children were under 4 years old and a 5-point scale was used thereafter. From age 4 years and over, the same measure was used for two cohorts. Scores ranging from the mid-point and above were classified as reflecting relatively high parenting harshness (i.e., scores of 5.5-10 on the 10-point scale and of 3-5 on the 5-point scale).
Source: Combined data from B and K cohorts as shown in Table 8.1.
Parenting consistency
- At least one-half of the mothers reported a high level of parenting consistency across the four time points examined - that is, when their child was 4-5 years old to 10-11 years old (51-78%).
- When their child was 4-5 years, the youngest group of mothers were the least likely of all the groups to report a high level of parenting consistency (51%), followed by the second youngest group (57%). The proportions in the three older groups reporting a high level of consistency were fairly similar (67-73%).
- Over the six-year period examined, the patterns of reports varied across the maternal age groups.
- For the two youngest groups (especially those who had their child as a teenager), highly consistent parenting appeared to become increasingly prevalent with time. The proportion reporting high consistency increased by 15 percentage points (from 51% to 66%) for the teenage mothers and by 11 percentage points (from 57% to 68%) for those who became mothers when in their early 20s.
- The proportion of mothers indicating high levels of parenting consistency fell for the oldest group by 11 percentage points (from 67% to 56%).
- The extent to which mothers reported high levels of parenting consistency remained fairly stable over the six-year period for the two remaining groups of mothers.
- By the time their child was 10-11 years old, the oldest group of mothers were the least likely of all the groups to report high levels of parenting consistency (56%), while those who became mothers when 25-34 years old were the most likely to report this (75%). A similar proportion of mothers in the other three groups indicated that they adopted a high level of parenting consistency (66-69%) at this stage in their child's life.
Parenting harshness
As discussed above, the threshold for "relatively harsh parenting" was set at the mid-point of the scale, because few parents reported that they engaged in harsh parenting behaviours. Secondly, a 10-point scale was used when the children were infants and 2-3 years old, and a 5-point scale was used when the children were older than this. These differences may have affected the results for the first two waves compared with subsequent waves. Mothers classified as adopting "relatively harsh parenting" were clearly in the minority and at each time point (taken separately), differences between maternal age groups in apparent use of relatively high harshness were not statistically significant.
- Few mothers in each maternal age group indicated that they tended to treat their child relatively harshly when their child was an infant or at age 2-3 years, especially during the former period (reported by 1-3% during infancy and by 2-9% two years later).
- When the child was 4-5 years, 10-24% of mothers appeared prone to treating their child relatively harshly. This apparent increase in reports of relative harshness may be a function of the different sets of questions used by the time the child was 4-5 years old compared with earlier.
- When the child was 4-5 years old, the two youngest groups of mothers (especially those who had their child as teenagers) seemed the most likely of all groups to report being relatively harsh in their parenting (24% and 16% respectively), although, as noted above, differences were not statistically significant. It is worth noting that when analysis was restricted to the B-cohort mothers, the two youngest groups continued to be the most likely of all groups to report relatively harsh parenting in this wave, and virtually the same proportions of B-cohort mothers in these two youngest groups acknowledged such behaviour (19-20%).
From the time the child was 4-5 years to 10-11 years, the patterns varied somewhat across the groups. For instance, mothers in the oldest group were considerably more likely to report relatively harsh parenting when their child was aged 10-11 years than when younger (e.g., 21% when their child was aged 10-11 years vs 12% when their child was 4-5 to 8-9 years). Compared with these mothers, the proportions of other mothers reporting such behaviour were relatively stable, with those aged 35-37 years tending to be the least likely to indicate relatively harsh parenting (e.g., 13% vs 16-21% when the child was 10-11 years). However, as noted above, differences between maternal age groups in the apparent use of relatively high harshness were not statistically significant.
8.6 Summary
Over the last few decades, the age at which women typically have their first child has increased, with over 40% of new mothers now being at least 30 years old. The overall picture, however, is also one of increasing diversity. While many studies have examined the circumstances experienced by women who become mothers as teenagers, for women who become new mothers at older ages, there is a relatively strong focus on the increased health-related risks for mothers and their newborn children.
This chapter extended earlier analysis by Weston et al. (2006), which focused exclusively on Wave 1 data for LSAC mothers firstborn children in the B cohort. In these earlier analyses, mothers were classified into five groups according to the age at which they had their child (here called "maternal age"). The earlier study found that teenage mothers and mothers in their early 20s were more likely to be experiencing disadvantaged circumstances compared with older mothers, with the differences being particularly marked for teenage mothers. In terms of parenting behaviour, all groups tended to indicate that they expressed considerable levels of warmth and avoided harsh parenting.
In the present chapter, we retained a focus on the same five maternal age groups, and we combined the data for mothers of B-cohort firstborn children with those of K-cohort firstborn children where the children were of the same age. The central question was whether maternal age "made any difference" in the long run, in relation to certain living arrangements, socio-economic circumstances and parenting behaviour. We focused on the first six waves of data, which spanned 10 years (from the time the study child was aged 0-1 year to 10-11 years).
Living arrangements covered family type (intact, step- and single-mother families), the relationship status of partnered mothers (cohabiting or married), and number of additional children in the family after Wave 1. We found that, across the ten-year period, women who had their first child when teenagers continued to be the least likely of all groups to be living with their child's father, followed by those who became mothers when in their early 20s.
Not surprisingly, few if any mothers in each maternal age group had formed a step-family when their child was an infant. The likelihood of doing so increased for the two youngest groups but had hardly changed for the older groups. Some of the new relationships formed after Wave 1 had ended within the period examined. Ten years on, around one in five mothers who were under the age of 25 when their first child was born were in step-families. Nevertheless, across the ten-year period, the likelihood of being single continued to be higher for those who had their first child as teenagers than those who became mothers when aged 25 years and over. This difference had narrowed considerably by the tenth year, because of the greater re-partnering rate apparent for the youngest group. Although, when their child was an infant, mothers in their early 20s were also more likely than older mothers to be single, this difference had largely disappeared ten years later, owing to age-related differences in re-partnering.
The two youngest groups of mothers who were living with a partner, especially the teenage mothers, were more likely than older partnered mothers to be in a cohabiting relationship when their child was an infant. While this pattern continued to hold across the ten-year period, the differences in cohabiting rates among partnered mothers of different maternal ages had narrowed.
Across the ten-year period, women in the oldest group were the least likely to have had any more children, followed by the second oldest group. On the other hand, the younger the maternal age group, the more likely the mothers were to have at least two more children. The two youngest groups were also more likely than other mothers to have had a child with a partner other than the father of their first child, or to have a step-child in their family.
The earlier study (Weston et al., 2006) showed that women who entered motherhood when under 25 years, especially when teenagers, were socio-economically disadvantaged (e.g., they had left school early and did not have any post-school qualifications, they were not employed, and they were more likely to have experienced financial hardship). The current research suggests that the gaps in educational attainment and employment between women who started childbearing at early ages and those who started at later ages continued to hold but had diminished over the subsequent ten years. In addition, women who entered motherhood before age 25 were more likely than other women to experience financial hardship in the subsequent ten years. This difference was reduced somewhat in the subsequent ten years for those who became mothers when in their early 20s but not for those who commenced motherhood in their teenage years. Despite the fact that the two youngest groups of mothers were more likely than other mothers to experience at least one form of financial hardship across the ten-year period, the two youngest groups were not significantly more likely than the older mothers to indicate that they felt they were struggling financially when their child was 10-11 years old.
Regardless of their maternal age when they had their first child, mothers tended to provide favourable reports of their parenting practices at the different time points examined over the ten-year period. According to their reports, they expressed a great deal of warmth towards their child and a tendency to use inductive reasoning and consistency when correcting their child, and to avoid treating their child harshly. Although reports of the tendency to express warmth did not vary according to maternal age when their child was an infant, the reports of the teenage mothers suggested that they were less likely than other mothers to maintain their high level of parental warmth.
The use of inductive reasoning was first assessed when their child was 2-3 years old, while consistency in parenting was first assessed (for both cohorts) when their child was 4-5 years old. Compared with women who became mothers when older, the youngest group of mothers provided less favourable reports regarding inductive reasoning, parenting consistency and parenting harshness when their first child was relatively young but by the time their child was 10-11 years, such differences had largely disappeared. While women who entered motherhood before age 25 appeared to be increasingly likely to use inductive reasoning and to adopt a consistent stance over time, women who became mothers at a much later age (38+ years) were less likely to indicate using such approaches.
Regarding all the issues examined in this chapter, patterns for the oldest group (who were 38 years or more when they had their child) tended to resemble those of the other two groups of women who became mothers when 25-34 and 35-37 years old. The key exceptions were that the oldest mothers were significantly more likely than those aged 25-34 years to be single when their child was 10-11 years old, and less likely to report that they maintained a consistent approach to parenting and used inductive reasoning.
In summary, women who became mothers before age 25 (especially the teenagers) experienced greater levels of disadvantage than those who became mothers at older ages, although gaps in the areas of disadvantage examined diminished considerably over time. The two youngest groups of mothers were more likely than the other mothers to be living apart from their child's father in Wave 1. By the time their child was 10-11 years old, the mothers of the two youngest groups were the most likely of all groups to have formed a step-family.
The results in this chapter should be interpreted with some caution owing to limitations inherent in the data. Firstly, given that the numbers of women who became mothers either before age 25 or at age 38 or older were small, the results were less reliable for these groups. Secondly, the levels of sample attrition were higher for those who became mothers in their teens or early twenties and systematic differences in the characteristics of those who participated and those who did not may well undermine the strength of the results.
8.7 References
Aitken, Z., Hewitt, B., Keogh, L., LaMontagne, A. D., Bentley, R., & Kavanagh, A. M. (2016). Young maternal age at first birth and mental health later in life: Does the association vary by birth cohort? Social Science & Medicine, 157, 9-17.
Australian Bureau of Statistics. (2015). Births, Australia, 2014 (Catalogue No. 3301.0 - Table 1.9). ABS: Canberra. Retrieved from <www.abs.gov.au/ausstats/abs@.nsf/mf/3301.0>.
Australian Institute of Health and Welfare. (2015). Perinatal data portal - Data tables Demographics module. Canberra: AIHW. Retrieved from <www.aihw.gov.au/perinatal-data/>.
Baxter, J. (2013a). Parents working out work (Australian Family Trends Series No. 1). Melbourne: Australian Institute of Family Studies.
Baxter, J. A. (2013b). Employment and the life course: Analyses of birth cohort differences of young Australian women. In A. Evans & J. H. Baxter (Eds.), Negotiating the life course: Stability and change in life pathways (pp. 99-120). Netherlands: Springer.
Baxter, J. A. (2013c). Employment characteristics and transitions of mothers in the Longitudinal Study of Australian Children (Occasional Paper No. 50). Canberra: Department of Social Services.
Baxter, J. A. (2016). Diversity, complexity and change in children's households. In Australian Institute of Family Studies (Ed.), The Longitudinal Study of Australian Children annual statistical report 2015. Melbourne: Australian Institute of Family Studies.
Bradbury, B. (2006). The impact of young motherhood on education, employment and marriage (SPRC Discussion Paper No. 148). Sydney: The Social Policy Research Centre, University of New South Wales. Retrieved from <www.researchgate.net/profile/Bruce_Bradbury/publication/24112588_The_Imp....
Bronfenbrenner, U. (1999). Environments in developmental perspective: Theoretical and operational models. In S. L. Friedman & T. D. Wachs (Eds.), Measuring environment across the life span: Emerging methods and concepts (pp. 3-28). Washington, DC: American Psychological Association. Retrieved from <www.uncg.edu/hdf/facultystaff/Tudge/Bronfenbrenner%201999.pdf>.
Brown, H. (2016, 3 August). How old is too old for safe pregnancy? The Conversation. Retrieved from <theconversation.com/how-old-is-too-old-for-a-safe-pregnancy-63446>.
Craig, L., & Bittman, M. (2005). The effect of children on adults' time-use: Analysis of the incremental time costs of children in Australia (SPRC Discussion Paper No. 143). Sydney: Social Policy and Research Centre, University of New South Wales. Retrieved from <www.sprc.unsw.edu.au/media/SPRCFile/DP143.pdf>.
Crossley, I. A., & Buckner, J. C. (2012). Maternal-related predictors of self-regulation among low-income youth. Journal of Child and Family Studies, 21(2), 217-227.
Herstad, L., Klungsøyr, K., Skjaerven, R., Tanbo, T., Forsén, L., & Åbyholm, T. (2015). Maternal age and emergency operative deliveries at term: A population-based registry study among low-risk primiparous women. British Journal of Obstetrics and Gynaecology, 122(12), 1642-1651.
Kalb, G., Le, T., & Leung, F. (2014). Outcomes for teenage mothers in the first years after birth. (Working Paper No. 6/14). Melbourne: Melbourne Institute of Applied Economic and Social Research, University of Melbourne. Retrieved from <www.melbourneinstitute.com/downloads/labour/4-12_FINAL_REPORT.pdf>
Lee, B. K., & McGrath, J. J. (2015). Advancing parental age and autism: Multifactorial pathways. Trends in Molecular Medicine, 21(2), 118-125.
Li, Z., Zeki, R., Hilder, L., & Sullivan, E. A. (2013). Australia's mothers and babies 2011. (Perinatal statistics series no. 28. Cat. no. PER 59). Canberra: AIHW National Perinatal Epidemiology and Statistics Unit. Retrieved from <www.aihw.gov.au/WorkArea/DownloadAsset.aspx?id=60129545698>.
Lucas, N., Nicholson, J. M., & Maguire, B. (2011). Parenting practices and behaviours. In Australian Institute of Family Studies (Ed.), The Longitudinal Study of Australian Children annual statistical report 2010 (pp. 43-55). Melbourne: Australian Institute of Family Studies. Retrieved from <growingupinaustralia.gov.au/pubs/asr/2013/asr2013.pdf>.
McConnell, D., Breitkreuz, R., & Savage, A. (2011). From financial hardship to child difficulties: Main and moderating effects of perceived social support, Child: Care, Health and Development, 37(5), 679-691.
McLachlan, R., Gilfillan, G., & Gordon, J. (2013). Deep and persistent disadvantage in Australia, Productivity Commission Staff Working Paper. Canberra: Productivity Commission. Retrieved from <www.pc.gov.au/research/supporting/deep-persistent-disadvantage/deep-pers....
Marino, J. L., Lewis, L. N., Bateson, D., Hickey, M., & Skinner, S. R. (2016). Teenage mothers. Australian Family Physician, 45(10), 712-717. Retrieved from <www.racgp.org.au/afp/2016/october/teenage-mothers/>.
Meltzer, H., Bebbington, P., Brugha, T., Farrell, M., & Jenkins, R. (2012). The relationship between personal debt and specific common mental disorder. European Journal of Public Health, 23(1), 108-113.
Morris, J. K., Mutton, D. E., & Alberman, E. (2002). Revised estimates of the maternal age specific live birth prevalence of Down's syndrome. Journal of Medical Screening, 9(1): 2-6.
Qu, L., & Weston, L. (2012). Parental marital status and children's wellbeing (Occasional Paper No. 46). Canberra: The Department of Families, Housing, Community Services and Indigenous Affairs.
Reimondos, A., & Trevenar, S. (2013). Appendix: Negotiating the Life Course Project. In A. Evans, and J. Baxter (Eds.) Negotiating the life course: Stability and change in life pathways. Life Course Research and Social Policies, Volume 1. Dodrecht: Springer.
Schoeni, R. F., & Wiemers, E. E. (2015). The implications of selective attrition for estimates of intergenerational elasticity of family income. Journal of Economic Inequality, 13(3), 351-372.
Watson, N., & Wooden, M. (2009). Identifying factors affecting longitudinal survey response. In P. Lynn (Ed.), Methodology of longitudinal studies (pp. 157-181). Chichester: Wiley.
Weston, R., Soriano, G., & Qu, L. (2006). Starting early, starting late: socio-demographic characteristics and parenting of new mothers of different ages. Family Matters, 73, 52-59
Weston, R., Qu, L., Parker, R., & Alexander, M. (2004)."t's not for lack of wanting kids": A report on the Fertility Decision Making Project (Research Report no. 11). Melbourne: Australian Institute of Family Studies.
Zubrick, S. R., Lucas, N., Westrupp, E. M., & Nicholson, J. M. (2014). Parenting measures in the Longitudinal Study of Australian Children: Construct validity and measurement quality, Waves 1 to 4 (LSAC Technical Paper No.12). Canberra: Department of Social Services
1 Indigenous women have children at a younger age than non-Indigenous women in Australia. For instance, 17% of Indigenous mothers and 2% of non-Indigenous mothers who gave birth to a child in 2014 were teenagers, while 10% of Indigenous mothers and 23% of non-Indigenous mothers were aged 35 years and over. These percentages are based on data for all births in 2014, not just first births (AIHW, 2016).
2 Using maternal age cut-offs that differed from those used here and analysing the first four waves of LSAC, Baxter (2013a) also found that employment rates were lower among mothers with a lower age at first birth, taking account of various other maternal and family characteristics.
3 Only 102 mothers were in this oldest group.
4 In LSAC, 37% of study children in the two cohorts were firstborn.
5 For example, there were only 46 K-cohort mothers in the oldest maternal age group (38+ years) in Wave 6. As noted above, maternal age refers to the mother's age when she gave birth to her (firstborn) child.
6 The sample sizes for B cohort in Wave 1 differed slightly from those used by Weston et al. (2006). The variation was due to the further restriction on the sample in this chapter (focusing on mothers who were interviewed as the primary carer of the study child). In addition, some mothers were found to be ineligible for inclusion because of corrections to the data that occurred after Wave 1. These corrections were based on new information that was made available in subsequent releases of the dataset.
7 The analyses were applied to both "balanced" and "unbalanced" panel data, where "balanced" panel data refer exclusively to the information provided by mothers who participated in every wave, and the "unbalanced" panel data focus on all relevant information collected in each wave, including that provided by mothers who did not participated every wave.
8 This approximates the classification system used by the ABS, where "intact family" refers to a couple family in which all children in the household are the natural or adopted children of both members of the couple.
9 The patterns discussed below continued to hold when the analysis was based on the balanced sample of the B cohort. It should also be noted that single mothers may have been living with other adult(s) (e.g., child's grandparents, uncles, aunts) who may represent a parental figure for the study child.
10 The balanced dataset indicated that virtually all mothers who were living with their child's father when the child was 10-11 years old were also doing so in each survey wave. However, temporary separations that may have occurred between survey waves would not have been detected.
11 Two factors have contributed to the fall in cohabitation: the separation rate was higher for parents in cohabiting relationships than those in married relationships, and some cohabiting parents subsequently married each other (Qu & Weston, 2012).
12 For further information on the complexity of LSAC households across the ten years, see Baxter (2016).
13 A relatively high rate of attrition among people with low educational attainment is commonly observed in longitudinal studies, although the effect is not necessarily large (Schoeni & Wiemers, 2015; Reimondos & Trevenar, 2013; Watson & Wooden, 2009).
14 The merging of the B and K cohorts at age 4-5 may also account for some of the dip in the older age groups at a point where one might expect it to rise.
15 When their child was 6-7 years old, the full-time employment rate of teenage mothers was very similar to that of mothers who had their first child when in their early 20s (13% and 15% respectively). In all other periods investigated, the full-time rates of teenage mothers were considerably lower than those of all other groups.
16 Indeed, some research provides support for the notion that financial difficulties tend to increase parents' distress and thereby impair their parenting behaviour, increasing the risk of child maladjustment (see McConnell, Breitkreuz, & Savage, 2011). However, other factors may well be at play. For instance, mental health problems and certain addictions (e.g., addictions to alcohol or other drugs) tend to increase financial difficulties and impair parenting behaviour (see Crossley & Buckner, 2012; Meltzer, Bebbington, Brugha, Farrell, & Jenkins, 2012).
17 This is a rough indicator of hardship experiences, given that any of the events may have been one-off or repetitive; people who are short of cash may adopt other strategies not listed; for example, borrowing money from family or friends to make ends meet or taking on additional work, perhaps involving cash payments. Furthermore, some experiences/strategies, such as going without meals, would appear to suggest considerable financial hardship, while the level of hardship reflected in an inability to heat or cool the home would vary according to whether the respondent resided in a region with extreme, moderate or very mild temperatures. On the whole, however, any results based on this measure probably provide conservative estimates of hardship, given the limited number of experiences/strategies assessed.
18 Response options for these questions ranged from 1 never/almost never to 5 always/almost. The scores for these scales are the mean of the responses to these items. For the maternal consistency scale, responses to the third, fourth and fifth items were first reversed so that higher scores indicate greater consistency.
19 Only 2-16% of all mothers across the six waves of B and K cohorts had scores ranging from the mid-point to the highest point of the two variants of the harshness scales (i.e., "hostile parenting": scores of 5.5-10 on a scale of 1-10; or "angry parenting": scores 3-5 on a scale of 1-5).
20 We also compared the mean scores on each parenting practice scale across maternal age groups (results not shown here). The overall pattern of results were consistent with those outlined in this chapter, even though the differences in mean scores across maternal age groups seemed small.
21 This fall refers to the difference in percentages between the times when the child was 2-3 years old and 10-11 years old. Of the women who had their child when aged 35-37 years, much the same the proportions reported relatively high use of inductive reasoning when the child was 8-9 and 10-11 years old (around 75% and 76% respectively).
Share


