7. Teaching practices in Australian primary schools
7. Teaching practices in Australian primary schools
7.1 Introduction
There is significant debate within the research literature about the effectiveness of different teaching practices in promoting student achievement and engagement. This literature is full of recommendations regarding what educators should and should not do, and many hold passionate views as to why particular approaches are superior to others (Hattie, 2009).
Some aspects of teaching practice that are widely debated include whether students should be grouped within classes for particular subjects according to level of ability (within-class grouping; see Loveless, 1998; Slavin, 1987); the relative effectiveness of whole-group instruction compared with small-group learning and other types of classroom activities (Hattie, 2009); and which approaches work best in teaching fundamental reading and maths skills (see National Inquiry into the Teaching of Literacy, 2005, Sullivan, 2011). For example, with reading, some favour a focus on phonics, while others believe that recognition and comprehension of whole-word units is most effective.
The decision to use a particular teaching approach may be influenced by a range of student-related factors including age, ability, motivation, learning style and socio-cultural background (Isac, Dinis Da Costa, Araujo, Soto Calvo, Albergaria-Almeida, 2015; Rowe, 2006, Tomlinson, 2001). Teaching practices may also vary according to school type (Choy, 1997) and socio-economic status level (Stipek, 2004); teacher characteristics such as the amount of teaching experience (Jensen, Sandoval-Hernandez, Knoll & Gonzalez, 2012) and self-efficacy1 (Rice, 2010); as well as class size and composition (Bourke, 1986; Veenman, 1995).
Much has been written on the strengths and weaknesses of particular instructional practices. However, less consideration has been given to trying to comprehensively document the type of teaching practices that Australian teachers actually use, and how these may vary in accordance with school, teacher or class characteristics.
This chapter aims to provide a comprehensive snapshot of teaching practices in Australian primary schools and how these differ according to:
- the year level of the student (Years 1–2, 3–4 or 5–6);
- school characteristics (school sector, school educational advantage);
- teacher characteristics (experience, self-efficacy regarding teaching ability); and
- class characteristics (single-grade or multi-grade class, proportion of students from non-English speaking background or with a diagnosed disability).
In this chapter, three main aspects of teaching practice are examined. Namely (i) whole group versus other forms of instruction (small group, individual and child-initiated activities), (ii) approaches to teaching maths and reading, and (iii) the use of within-class grouping. These teaching practices are selected as they have been subject to debate, and data on these teaching practices are available from the LSAC dataset. It is not the purpose of this chapter to explain why differences in teaching practices occur but instead to document what is happening in Australian primary schools, with a view to generating further discussion.
7.2 Data and methods
Sample
This chapter uses teacher-reported data relating to the LSAC K cohort, focusing on the waves in which study children were in primary school. Teachers provided information about their teaching practices at three waves: when study children were in Years 1–2 (Wave 2), Years 3–4 (Wave 3) and Years 5–6 (Wave 4).2 As it is usual within the Australian education system for a student’s classroom teacher to change from year to year, the teacher reporting on each study child typically varied between waves. Further, as teaching practices, rather than study children, were the main focus of the analysis, we used all available teacher data at each wave. Consequently, some variations in sample size were observed across waves and analyses. Table 7.1 presents a summary of the sample size by wave of data collection.
Teacher practice measures
A number of measures were used to examine the types of teaching practices used by primary school teachers:
- type of classroom activity;
- emphasis when teaching mathematics and reading; and
- within-class grouping for mathematics and reading.
Type of classroom activities
At each wave, teachers were asked to report on the frequency with which they used four types of classroom activities on a typical day. Age-appropriate examples were included for each classroom activity type. The examples below relate to Years 1–2 students. The activities were:
- teacher-directed whole-group activities (e.g., language or numeracy activities, story time or news time);
- teacher-supported small-group activities (e.g., literacy or numeracy activities, science, cooking or art activities);
- teacher-supported individual activities (e.g., reading, doing puzzles, writing or completing worksheets); and
- child-initiated activities (e.g., free choice of activities, free play in outdoor activities, pretend play).
Ratings were made on a four-point scale: 1 = “never”, 2 = “occasionally”, 3 = “often” 4 = “very often”. Few teachers reported that they “never” engaged in these activities. Therefore, the decision was made to collapse responses into three categories: “never/occasionally”, “often” and “very often”. It should be noted that no quantitative description was provided to teachers to differentiate between “often” and “very often”.
Emphasis when teaching reading and maths
When study children were in Years 1–2 and 3–4, their teachers were asked what their main emphasis was in their approach to teaching (i) reading and (ii) mathematics (hereafter referred to as “maths”). Responses were made on a 7-point scale.
For the reading item, a rating of 1 indicated that the teacher favoured an “emphasis on reading and comprehending whole texts”, a 7 indicated an “emphasis on phonetics and decoding”, while a rating midway between these values signified “equal emphasis on both approaches”.
To aid interpretation, responses were collapsed into three categories, reflecting these three preference options. Ratings from 1–3 were seen as endorsing an “emphasis on reading and comprehending whole texts”, a rating of 4 as indicating “equal emphasis on both approaches” and ratings from 5–7 as favouring an “emphasis on phonetics and decoding”.3
For the maths item, a rating of 1 indicated an “emphasis on talking about and solving mathematical problems”, a 7 indicated an “emphasis on learning rules, facts and procedures”, and a score midway between these values showed that the teacher placed “equal emphasis on both approaches”. As with the reading item, responses were collapsed into three categories to improve interpretability. These were an “emphasis on talking about and solving mathematical problems” (ratings from 1–3), “equal emphasis on both approaches” (rating of 4), and “an emphasis on learning rules, facts and procedures” (rating from 5–7).
Within-class grouping for reading and maths
At each wave, teachers were also asked about the frequency with which they organised their class in achievement level groupings for (i) reading and (ii) maths. Responses were made on a five-point scale whereby 1 = “never” and 5 = “daily”. For the current analyses, responses were collapsed into the following three categories: “never/less than once a week”, “1–2 times a week” and “3 or more times a week”.
Analysis
The use of different teaching practices was compared:
- at different year levels (Years 1–2, 3–4, 5–6);
- by school characteristics (school sector, school socio-educational advantage);
- by teacher characteristics (experience and self-efficacy); and
- by classroom characteristics (single grade/multi-grade; proportion of class from non-English speaking background; proportion of class with disability).
Descriptive statistics (e.g., crosstabs, ANOVA) were used for these comparisons. Due to the large number of analyses undertaken, only statistically significant results are discussed in detail in this chapter.
7.3 Teaching practices by year level
The use of different teaching practices was compared at each wave to determine whether there were any systematic differences in the approaches teachers used with students in different year levels. Table 7.2 provides a summary of those teaching practices that significantly differed according to student year level, and a more detailed discussion of the results follows.
Note: ns = not statistically significant at any wave based on the results of chi-square test at p < 0.05.
Source: LSAC K cohort, Waves 2, 3 and 4
Type of classroom activities
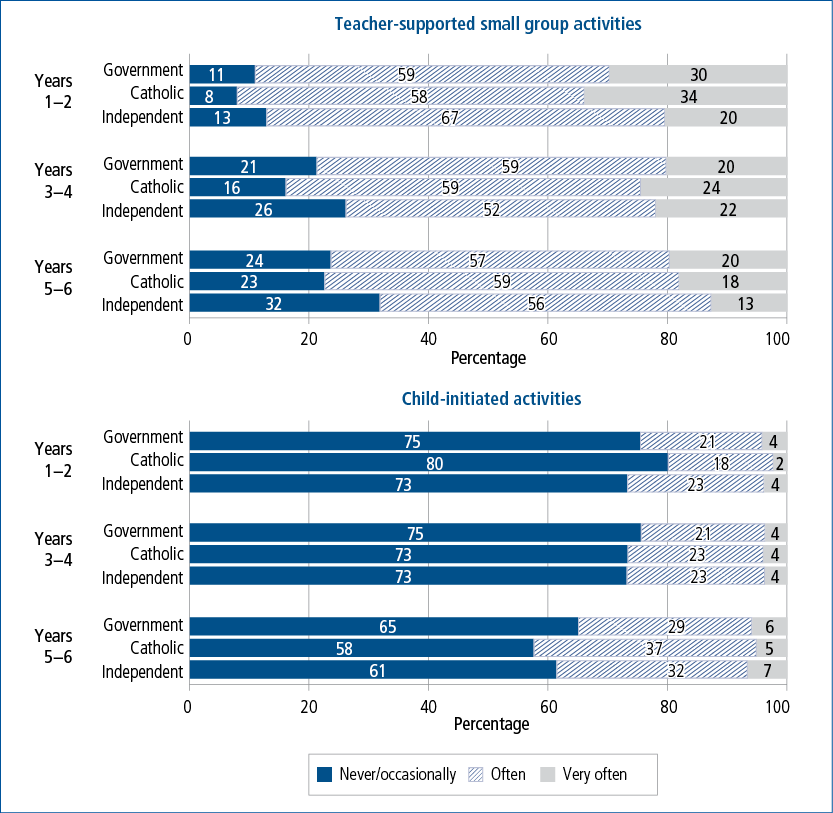
As indicated in Figure 7.1, student year level was not significantly associated with teachers’ use of directed whole-group activities or supported individual activities, with similar proportions of teachers using these approaches across all year levels (Years 1–2, 3–4 and 5–6).
However, there was some variation in teachers’ use of supported small-group activities by year level, with teachers reporting that they were less likely to frequently use these activities, or engage in them at all as students matured (see Figure 7.1). For example, only 18% of teachers reported running supported small-group activities “very often” in Years 5–6 compared to 30% of teachers in Years 1–2. Conversely, almost a quarter of teachers reported engaging students in small groups “never/occasionally” in Years 5–6 compared to one in ten teachers in Years 1–2.
Teachers also differed in their use of child-initiated activities in accordance with the age of their students. While the majority of teachers reported “never/occasionally” running child-initiated activities, a higher proportion of teachers reported engaging older students in these activities than younger students (37% used child-initiated activities “often” or “very often” in Years 5–6 compared with 24% in Years 1–2).
Figure 7.1: Frequency of teachers’ engagement in different types of classroom activities, by year level
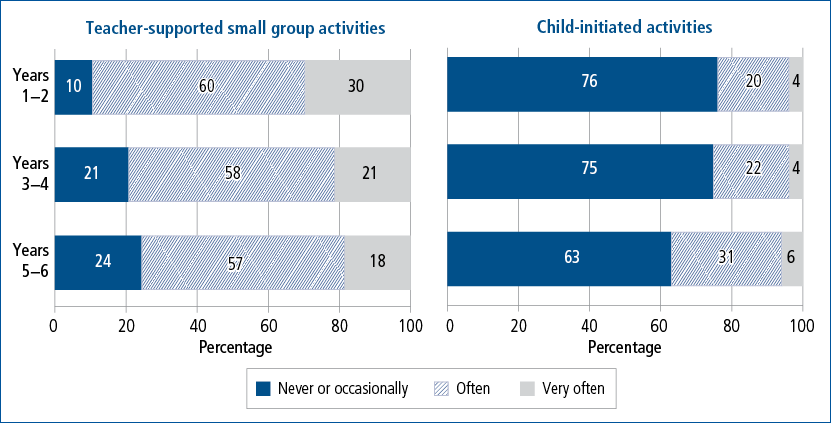
Notes: Teacher supported small-group activities: c2 (4, n = 10,096) = 276.7, p < .001; child-initiated activities: c2 (4, n = 10,097) = 169.1, p < .001. The pooled data across three waves was used in the analyses. Percentages may not total exactly 100.0% due to rounding.
Source: LSAC K cohort, Waves 2, 3 and 4
Emphasis when teaching reading and maths
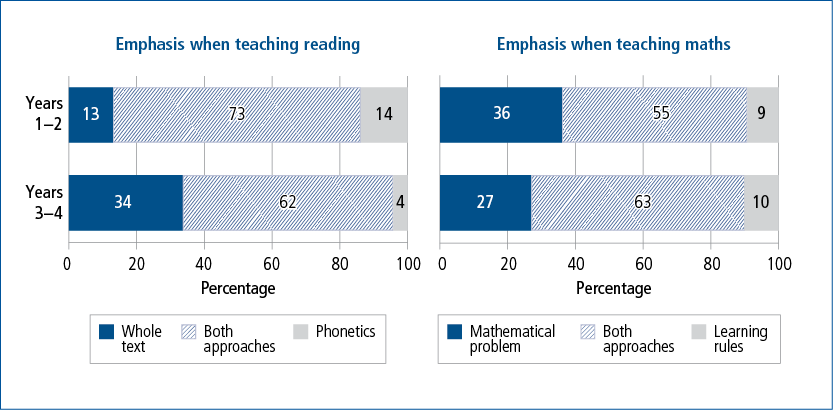
Different patterns were observed across year levels in the approaches teachers took to teaching reading (Figure 7.2). While the majority of the teachers placed equal emphasis on both approaches when students were in Years 1–2 and 3–4, teachers were more likely to favour an emphasis on “reading and comprehending whole texts” when students were in Years 3–4 (34%) than when they were in Years 1–2 (13%). A much smaller proportion of teachers reported placing a greater emphasis on “phonetics and decoding”. Furthermore, preference for this approach declined as students matured (14% of teachers favoured this approach in Years 1–2 compared with only 4% of teachers in Years 3–4).
Figure 7.2: Emphasis when teaching reading and maths, by year level
Notes: Emphasis in reading (whole texts = an emphasis on reading and comprehending whole texts; phonetics = an emphasis on phonetics and decoding): c2 (2, n = 6,737) = 505.8, p < .001. Emphasis in maths (mathematical problem = an emphasis on talking about and solving mathematical problems; learning rules = an emphasis on learning rules, facts and procedures): c2 (2, n = 6,707) = 64.4, p < .001.
Source: LSAC K cohort, Waves 2 and 3
When teaching maths, the majority of Years 1–2 and 3–4 teachers also reported focusing equally on both approaches (Figure 7.2). The proportion of teachers who favoured “talking about and solving mathematical problems” was greater in Years 1–2 (36%) than Years 3–4 (27%). One in ten teachers at both waves reported a preference for “learning rules, facts and procedures”.
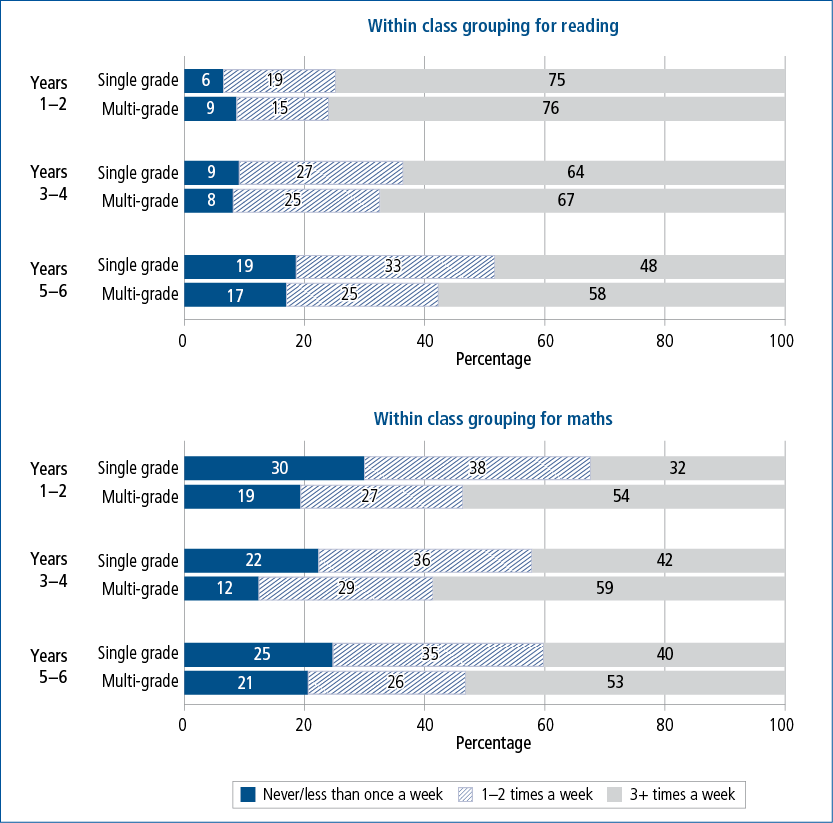
Within-class grouping for reading and maths
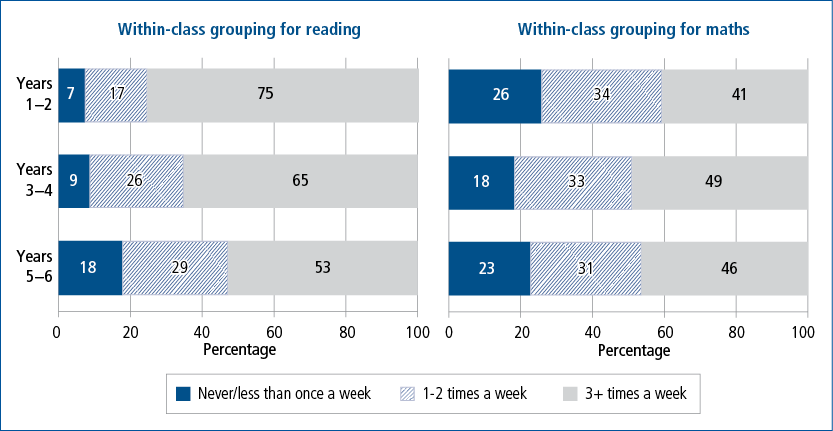
Figure 7.3 reports the frequency with which teachers reported using within-class grouping when teaching reading and maths. As this figure shows, the use of within-class grouping was very common at all year levels; however, within-class grouping for reading was used less frequently with older students. For example, just over half of teachers reported using within-class grouping for reading three or more times per week when students were in Years 5–6, compared with 65% of teachers in Years 3–4, and 75% in Years 1–2.
Use of within-class grouping for maths was also common among teachers. Use of this practice was highest in Years 3–4, with almost half of teachers reporting that they used within-class grouping for maths three or more times a week.
Figure 7.3: Within-class grouping when teaching reading and maths, by year level
Notes: Within-class grouping for reading: c 2 (4, n = 10,039) = 423.1, p < .001. Within-class grouping for maths: c 2 (4, n = 10,008) = 74.6, p < .001. Percentages may not total exactly 100.0% due to rounding.
Source: LSAC K cohort, Waves 2, 3 and 4
7.4 Teaching practices by school characteristics
Next, the use of different teaching practices was examined across (i) different school sectors, and (ii) schools with differing levels of socio-educational advantage. As variations were noted in teachers’ use of different teaching practices according to the year level they taught, results are presented by year level throughout the remainder of the chapter.
School type
At each wave, parents provided information about the type of school their child attended (i.e., government, Catholic, or independent). Close to 70% of teachers surveyed at each year level (between 67% and 69%) taught at government schools, 21% worked in Catholic schools and about one in ten (between 10% and 13%) in independent schools.
The use of different teaching practices in government, Catholic and independent schools was examined. There was some variation in sample size between analyses due to missing data. A summary of the results follows (see Table 7.3).
Notes: ns = not statistically significant at any wave based on the results of chi-square test at p < .05.
Source: LSAC K cohort, Waves 2, 3 and 4
Type of classroom activities
Significant differences were observed in the frequency with which teachers from different school types (i.e., Catholic, government or independent) reported engaging their students in supported small group activities. Teachers working in independent schools were somewhat less likely than other teachers to use these activities, with a higher proportion of independent school teachers at each year level indicating that they “never or occasionally” engaged in supported small-group activities (see Figure 7.4).
Although the majority of teachers across different sectors reported using child-initiated activities only occasionally or not at all, differences were not consistent across year levels (Figure 7.4).
Significant differences were also observed in the frequency with which government, Catholic and independent school teachers used supported individual activities, though only with Years 3–4 students (not shown in figures). Teachers at independent schools were more likely to report that they frequently used supported individual activities than their counterparts at Catholic and government schools (used “very often”: independent 28.8%, government 21.8%, Catholic 19.8%; c2 (4, n = 3,587) = 14.3, p < .05).
In contrast, there were no differences between teachers from government, Catholic and independent schools in their frequency of use of directed whole-group activities.
Figure 7.4: Frequency of supported small group activities and child-initiated activities, by school type
Notes: Teacher-supported small-group activities: Years 1–2: c2 (4, n = 3,171) = 23.0, p < .001; Years 3–4: c2 (4, n = 3,587) = 21.8, p < .01; Years 5–6: c2 (4, n = 3,338) = 21.0, p < .01. Child-initiated activities: Years 1–2: c2 (2, n = 3,174) = 7.6, p < .05; Years 3–4: not significant; Years 5–6: c2 (2, n = 3,340) = 13.1, p < .01. Percentages may not total exactly 100.0% due to rounding.
Source: LSAC K cohort, Waves 2, 3 and 4
Emphasis when teaching reading and maths
Teachers working in different sectors also significantly differed in the approaches they used to teach reading and maths. While most teachers favoured an equal emphasis on “phonetics and decoding” and “reading and comprehending whole texts” when teaching reading, a higher proportion of teachers at independent schools placed greater emphasis on phonetics and decoding than teachers from other schools (Figure 7.5). These differences were evident at different year levels (i.e., Years 1–2 and 3–4).
Figure 7.5: Approach to teaching reading, by school type
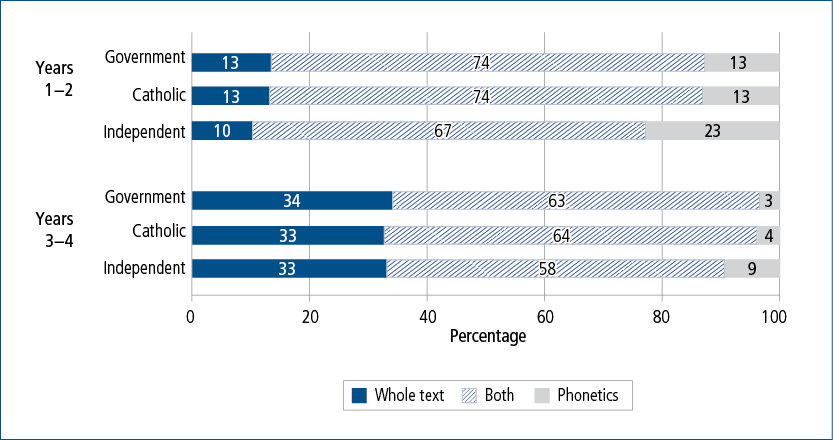
Notes: Whole texts = an emphasis on reading and comprehending whole texts; phonetics = an emphasis on phonetics and decoding; Years 1–2: c2 (4, n = 3,167) = 26.3, p < .001; Years 3–4: c2 (4, n = 3,570) = 32.4, p < .001. Percentages may not total exactly 100.0% due to rounding.
Source: LSAC K cohort, Waves 2 and 3
Teachers from different school types also differed in the approaches they used to teach maths in Years 1–2 (c2 (4, n = 3,157) = 12.5, p < .05). Teachers from independent schools were somewhat more inclined than other teachers (particularly Catholic school teachers) to favour an emphasis on “learning rules, facts and procedures” when teaching maths to Years 1–2 students (independent school teachers 14%, government 9%, Catholic 7%). Conversely, they were less likely than other teachers to favour an emphasis on “talking about and solving mathematical problems” (37% of government school teachers favoured this approach compared with 35% of Catholic school teachers and 32% of teachers at independent schools).
Within-class grouping for reading and maths
Clear, consistent differences emerged in the use of within-class grouping by teachers from different school types (Figure 7.6). Teachers at government schools were more likely than those at non-government schools to frequently use within-class grouping for reading and maths. These differences were evident at all year levels (Years 1–2, 3–4 and 5–6). On the other hand, independent school teachers were the group least likely to use within-class grouping for reading.
Figure 7.6: Use of within-class grouping activities, by school type
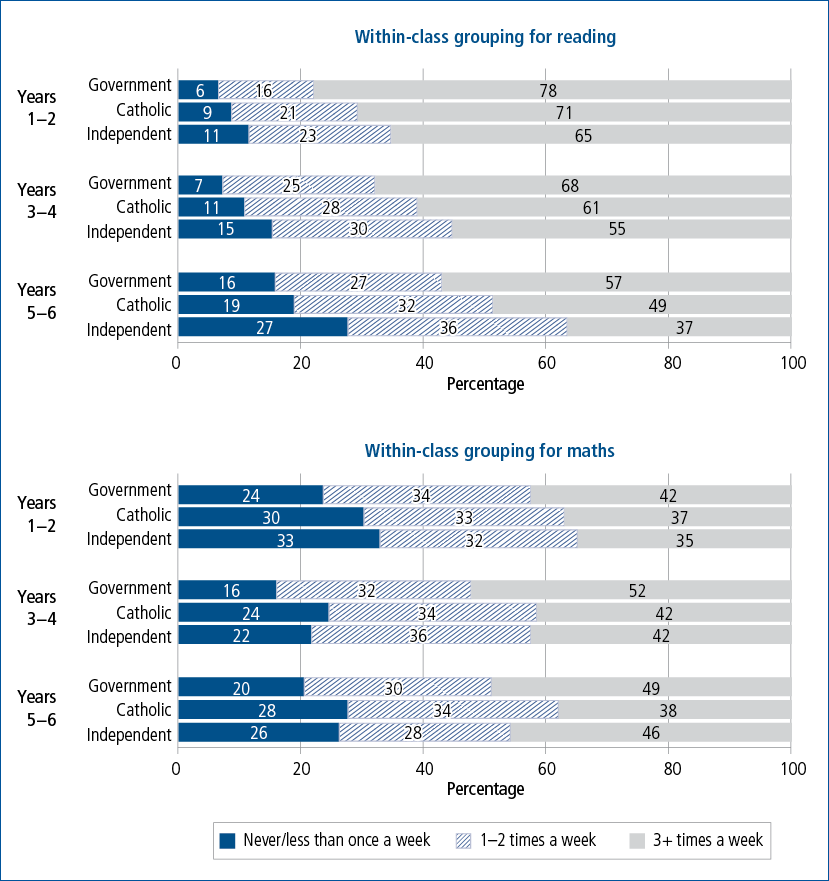
Notes: Within-class grouping for reading: Years 1–2: c2 (2, n = 3,159) = 34.2, p < .001; Years 3–4: c2 (2, n = 3,551) = 44.7, p < .001; Years 5–6: c2 (2, n = 3,329) = 44.1, p < .001. Within-class grouping for maths: Years 1–2: c2 (2, n =3,146) = 21.8, p < .03; Years 3–4: c2 (2, n = 3,546) = 44.1, p < .001; Years 5–6: c2 (2, n = 3,316) = 32.6, p < .001. Percentages may not total exactly 100.0% due to rounding.
Source: LSAC K cohort, Waves 2, 3 and 4
School educational advantage
The Index of Socio-Educational Advantage (ICSEA) was used to assess the socio-educational background of students in Years 3–4 and 5–6. ICSEA data was not available for the K cohort in Wave 2 (Years 1–2). This index provides information on the average level of educational advantage among a school’s student population. Parent (education, occupation) and school-level factors (geographic location, proportion of Indigenous students) are used to calculate scores on this index. Higher ICSEA scores signify higher relative levels of educational advantage (ACARA, 2015). For the purposes of the current analyses, schools were divided into three groups based on ICSEA scores: (1) lower ICSEA scores (bottom 33% of the distribution of mean scores); (2) average ICSEA scores (middle 33% of the distribution of mean scores); and (3) higher ICSEA scores (top 33% of the distribution of mean scores). The categorisation was based on percentile scores, therefore, allocations to each subgroup were relative to each other, rather than being an absolute measure. Examination of teacher data revealed that about 40 per cent of Years 3–4 and 5–6 teachers worked in schools with lower ICSEA scores (39–40%), a third in average ICSEA schools (32%–33%), and close to 30 per cent in higher ICSEA schools (29–30%).
Teaching practices were compared across schools with differing levels of educational advantage. As ICSEA data was not available when students were in Years 1–2, comparisons could only be made at Years 3–4 and 5–6. A summary of the results follows (Table 7.4).
Notes: ns = not statistically significant at any wave based on the results of chi-square test at p < 0.05. a Data only available at Wave 3 (Years 3–4).
Source: LSAC K cohort, Waves 3 and 4
Type of classroom activities
There was a significant relationship between the use of child-initiated activities and the level of school educational advantage (based on ICSEA scores) in Years 3–4 and 5–6. However, the magnitude of this difference was small. Teachers working at more advantaged schools were more likely than teachers at less advantaged schools to frequently engage their students in child-initiated activities (Figure 7.7).
Figure 7.7: Frequency of use of child-initiated activities, by school ICSEA
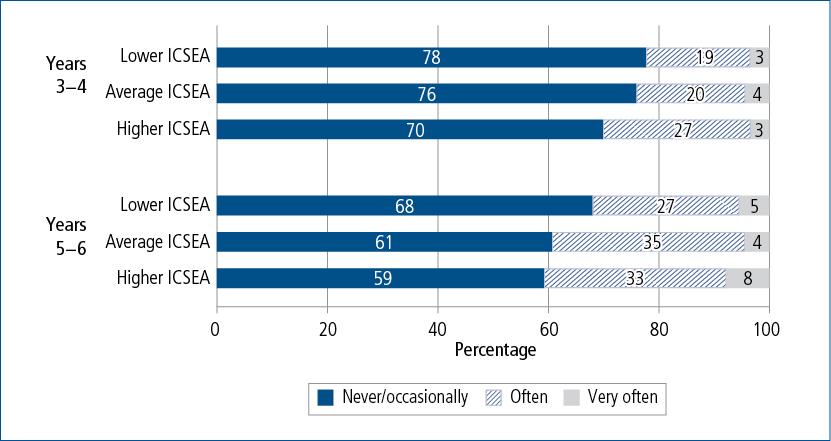
Notes: Years 3–4: c2 (4, n = 3,486) = 25.6, p < .01; Years 5–6: c2 (4, n = 3,263) = 32.9, p < .001.
Source: LSAC K cohort, Waves 3 and 4
Significant differences were also observed in the frequency that teachers used supported small-group activities and directed whole-group activities, by level of school educational advantage, but only at particular year levels. Teachers working at more advantaged schools were more likely to implement supported small group activities “very often” in Years 3–4 (lower ICSEA = 18%, average ICSEA = 22%, higher ICSEA = 24%; c2 (4, n = 3,490) = 19.0, p < .05) and less likely to use directed whole group activities “very often” in Years 5–6, (lower ICSEA = 35%, average ICSEA = 30%, higher ICSEA = 27%, c2 (4, n = 3,262) = 16.6, p < .01). However, the differences were small.
There were no differences observed in teachers’ use of supported individual activities at any year level according to school ICSEA level.
Emphasis when teaching reading and maths
When teaching Years 3–4 students to read, teachers at the most advantaged schools (those within the highest tertile on the ICSEA) were more likely to favour “reading and comprehending whole texts” than teachers at less advantaged schools (c2 (4, n = 3,474) = 35.0, p < .001). Thirty-nine per cent of teachers working in the most advantaged schools reported placing greater emphasis on this approach to reading in Years 3–4, compared with 33% of teachers working in schools with average ICSEA scores, and 29% of teachers in the least advantaged schools. However, teachers working at lower, average and higher ICSEA schools did not significantly differ in their approaches to teaching maths in Years 3–4.
Within-class grouping for reading and maths
A highly significant difference was observed in the use of within-class grouping for reading, according to the level of educational advantage of a school’s student population, but only in Years 5–6 (c2 (2, n = 3,253) = 116.0, p < .001). Teachers working at less advantaged schools tended to use within-class grouping for reading more frequently than teachers at more advantaged schools (lower ICSEA 68% used three or more times a week; average ICSEA 65%; higher ICSEA 62%).
No differences were found in teachers’ use of within-class grouping for maths, according to the level of educational advantage of a school’s student population.
7.5 Teaching practices by teacher characteristics
Teaching practices were compared according to teachers’ (i) amount of teaching experience and (ii) self-efficacy about their teaching abilities.4 An overview of the findings follows.
Teacher experience
Data were collected from teachers at each wave regarding the number of years of experience they had (i) “altogether as a teacher”, (ii) “as a teacher at this grade level” and (iii) “as a teacher at this school”. Teaching practices were compared using these three measures of teaching experience. Few differences were found when teachers were compared according to their total amount of teaching experience or their experience teaching within their current school. Hence, the decision was made to focus on teaching experience at this grade level in this chapter.
For this analyses, amount of teaching experience was categorised as follows: “less than three years”, “3–7 years” or “more than seven years” teaching at current year level. Some variations were found in teachers’ levels of experience in accordance with the year level they taught. For those who were teaching at the Years 1–2 and Years 5–6 levels, there was very little difference in experience. However, among those who were teaching at the Years 3–4 level, only 21% had more than seven years’ experience and 40% had less than three years’ experience (see Figure 7.8).
Figure 7.8: Teachers’ experience at current year level
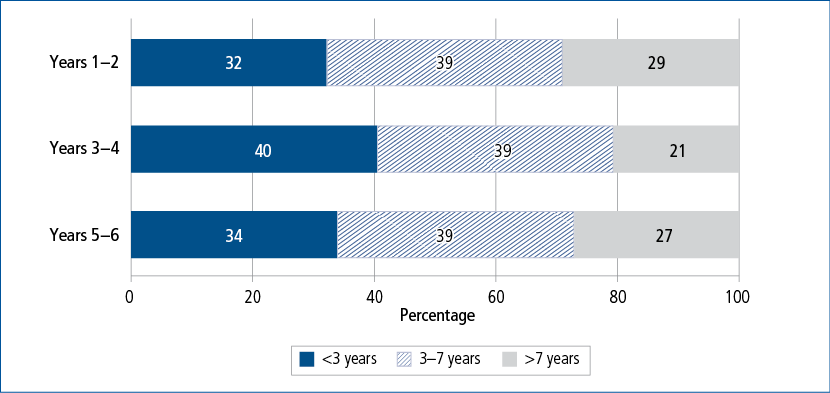
Source: LSAC K cohort, Waves 2, 3 and 4
Table 7.5 provides a summary of those teaching practices that significantly differed according to teachers’ experience teaching at their current year level.
Notes: ns = not statistically significant at any wave based on the results of chi-square test at p < 0.05.
Source: LSAC K cohort, Waves 2, 3 and 4
Type of classroom activities
No significant differences were observed in teachers’ use of directed whole-group activities by amount of experience teaching at their current year level. Some significant differences were observed in teachers’ use of other classroom activities in accordance with their level of experience but these were generally not consistent across year levels and group differences were small.
For instance, teachers with higher levels of experience teaching at their current year level were significantly less likely than other teachers to use supported individual activities with their students in Years 3–4, although group differences were quite small. About 23% of teachers with more than three years of experience teaching at Years 3–4 (“3–7 years” and “more than seven years”) engaged their students in supported individual activities never or occasionally, compared with 19% of teachers with less than three years of experience teaching at this year level (Table 7.6). Teachers with higher levels of experience teaching Years 3–4 students were also less likely to report running supported individual activities “very often”.
Teachers’ use of supported small-group activities also differed significantly in accordance with the teacher’s experience teaching at their current year level. Teachers with more than seven years of experience teaching Years 3–4 students were somewhat less inclined to run supported small-group activities than teachers with less experience working at this year level.
Almost a quarter (24%) of teachers with more than seven years of experience teaching at this year level reported that they never or only occasionally engaged their students in small-group activities, compared with 20% of teachers in the other two groups. Conversely, teachers with limited experience teaching Years 3–4 students were more likely to report running these activities “very often”.
Notes: Teacher-supported individual activities (Years 3–4): c2 (4, n = 3,538) = 16.1, p < .05; teacher-supported small-group activities (Years 3–4): c2 (4, n = 3,538) = 17.0, p < .05. Percentages may not total exactly 100.0% due to rounding.
Source: LSAC K cohort, Wave 3
A significant difference was also observed in teachers’ use of child-initiated activities according to their level of experience teaching at grade level; however, this was only apparent at Years 1–2 (c2 (4, n = 3,057) = 13.61, p = .029). A higher proportion of teachers with more than seven years of experience teaching at this year level reported using this approach either “often” or “very often” compared with teachers with less experience (more than seven years, 28%; 3–7 years 23%; less than 3 years, 21%).
Emphasis when teaching reading and maths
Teachers’ approach to teaching reading also significantly differed in accordance with the amount of experience teaching at their current year level (c2 (4, n = 3,052) = 23.4, p < .01). However, this difference was only observed in Years 1–2. Teachers with higher levels of experience teaching Years 1–2 students were more inclined to place equal emphasis on “phonetics and decoding” and “reading and comprehending the whole text” when teaching students to read than teachers who had been teaching Years 1–2 students for less than three years (at less than three years of experience, 68% favoured an equal emphasis; at 3–7 years, 75%; and more than 7 years, 77%). More experienced teachers were also less likely to favour a greater emphasis on reading and comprehending whole texts with this age group (less than 3 years, 16%; 3–7 years, 12%; more than 7 years, 10%).
No significant differences were found in teachers’ approaches to teaching maths.
Within-class grouping for reading and maths
Teachers’ use of within-class grouping for reading was not significantly related to their experience teaching at their current year level, with no significant differences observed at any year level.
A significant difference was observed in teachers’ use of within-class grouping for maths according to how long they had been teaching at their current year level, but only at Years 5–6 (c2 (2, n = 3,223) = 13.3, p <.05). Teachers who had more than seven years of experience working with Years 5–6 students tended to use this approach more often than less experienced teachers, particularly those with less than three years of experience teaching at this year level (at more than seven years of experience 50% used within-class grouping “very often”; at 3–7 years, 47% did; and less than 3 years, 43% did).
Teacher self-efficacy
Teacher self-efficacy was assessed at each wave using the following four items: “I have a strong effect on the academic achievement of the students I teach”; “I feel competent in dealing with students’ behavioural problems”; “I feel competent in dealing with students’ learning problems”; and “I have high expectations for the academic success of my students”. Teachers rated their level of agreement with each statement on a five-point scale ranging from 1 = “strongly disagree” to 5 = “strongly agree”. The mean score was calculated and three categories were derived: (1) lower efficacy (less than mean); (2) average efficacy (mean); (3) higher efficacy (above the mean).5
Some variations in teacher self-efficacy were evident across year levels, with teachers at Years 3–4 tending to report lower self-efficacy than those teaching other year levels. For instance, 38% of teachers scored below the mean on self-efficacy compared with 33% of Years 1–2 teachers, and only 30% of Years 5–6 teachers. Additionally, fewer teachers in Years 3–4 were classified as having higher self-efficacy (29%) than teachers in Years 1–2 (36%) and Years 5–6 (39%). These differences may be related to teacher experience, as Years 3–4 teachers also reported having lower levels of experience teaching at that year level.
Teaching practices were compared by teacher’s self-efficacy (lower, average, higher). A summary of the results is presented in Table 7.7.
Notes: ns = not statistically significant at any wave based on the results of chi-square test at p < 0.05.
Source: LSAC K cohort, Waves 2, 3 and 4
Type of classroom activities
Teachers significantly differed in their use of various teaching practices according to their level of self-efficacy. These differences were evident for all types of teaching practices examined (i.e., directed whole group, supported small group, supported individual and child initiated) and at all year levels (i.e., Years 1–2, 3–4 and 5–6). As shown in Table 7.8, teachers with higher levels of confidence in their teaching abilities were more likely to regularly use all of these classroom activities, compared to those with average and lower self-efficacy. Additionally, teachers with average self-efficacy were generally more likely to engage in these activities than those with lower self-efficacy. Group differences were most pronounced for teacher-supported small group activities (at all waves) and child-initiated activities (in Years 3–4 and 5–6). For instance, 42% of teachers with higher self-efficacy reported using supported small group activities “very often” in Years 1–2 compared with 28% of teachers with average self-efficacy and only 18% of those with lower self-efficacy.
Notes: Teacher-directed whole-group activities: Years 1–2: c2 (4, n = 3,152) = 35.7, p < .001; Years 3–4; c2 (4, n = 3,562) = 37.4, p < .001: Years 5–6: c2 (4, n = 3,332) = 23.5, p < .01. Teacher-supported small-group activities: Years 1–2: c2 (4, n = 3,149) = 176.2, p < .001; Years 3–4; c2 (4, n = 3,563) = 150.7, p < .001: Years 5–6: c2 (4, n = 3,332) = 151.5, p < .001. Teacher-supported individual activities: Years 1–2: c2 (4, n = 3,149) = 96.44, p < .001; Years 3–4; c2 (4, n = 3,563) = 77.17, p < .001: Years 5–6: c2 (4, n = 3,331) = 88.0, p < .001. Child-initiated activities: Years 1–2: c2 (4, n = 3,151) = 28.6, p < .001; Years 3–4; c2 (4, n = 3,559) = 139.8, p < .001: Years 5–6: c2 (4, n = 3,334) = 135.3, p < .001. Percentages may not total exactly 100.0% due to rounding.
Source: LSAC K cohort, Waves 2, 3 and 4
Emphasis when teaching reading and maths
Approaches to teaching reading at Years 1–2 and 3–4 did not differ significantly depending on teachers’ levels of self-efficacy. However, teacher self-efficacy was significantly associated with the approach to teaching maths (see Figure 7.9). Years 1–2 and 3–4 teachers with lower self-efficacy were more likely than teachers with higher self-efficacy to favour a greater emphasis on “learning rules, facts and procedures” when teaching maths, although the number of teachers that favoured this approach was quite small (only 12% of those with lower self-efficacy, and 6–7% with higher self-efficacy).
Figure 7.9: Emphasis when teaching maths, by teacher’s self-efficacy
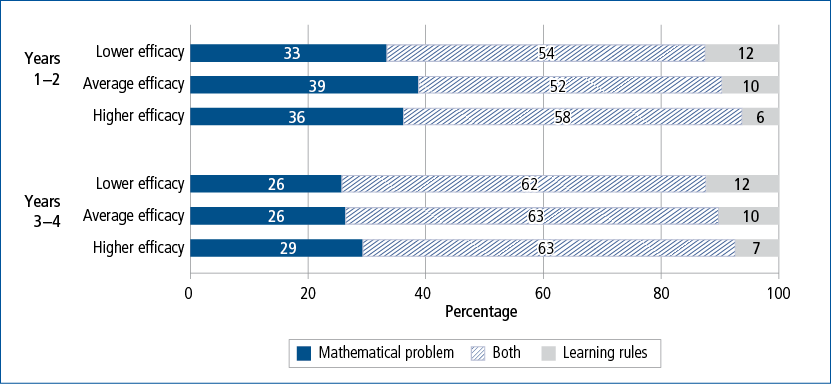
Notes: Years 1–2: c2 (4, n = 3,134) = 30.5, p < .001; Years 3–4: c2 (4, n = 3,546) = 17.7, p < .05. Percentages may not total exactly 100.0% due to rounding.
Source: LSAC K cohort, Waves 2 and 3
Figure 7.10: Within-class grouping for reading and maths, by teacher self-efficacy
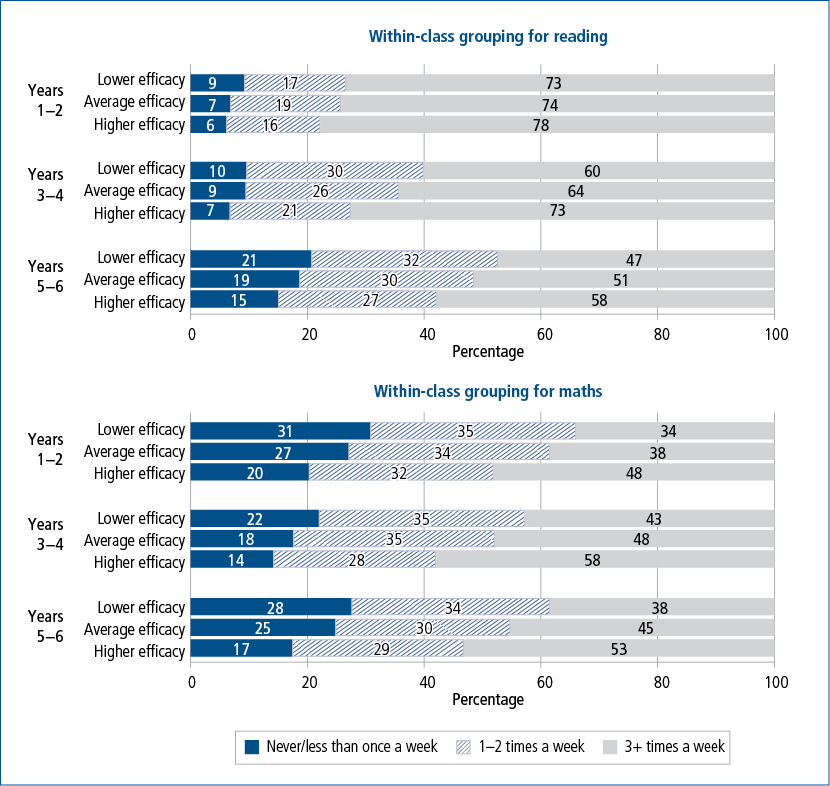
Notes: Within-class grouping for reading: Years 1–2: not significant; Years 3–4: c2 (2, n = 3,546) = 41.4, p < .001; Years 5–6: c2 (2, n = 3,325) = 27.7, p < .001. Within-class grouping for maths: Years 1–2: c2 (2, n = 3,141) = 54.2, p < .001; Years 3–4: c2 (2, n = 3,542) = 59.4, p < .001; Years 5–6: c2 (2, n = 3,312) = 58.6, p < .001. Percentages may not total exactly 100.0% due to rounding.
Source: LSAC K cohort, Waves 2, 3 and 4
Within-class grouping for reading and maths
Teachers with higher confidence in their teaching abilities were significantly more likely to use within-class grouping for reading on a frequent basis at Years 3–4 and 5–6, and to frequently use within-class grouping for maths with all year levels (see Figure 7.10). For instance, almost three-quarters of Years 3–4 teachers with high levels of self-efficacy reported using within-class grouping for reading more than three times a week, compared with only 60% of those with lower self-efficacy.
7.6 Teaching practices by class characteristics
Finally, teaching practices were compared by (i) class type (single- or multi-grade), (ii) the proportion of students in the class from non-English speaking family backgrounds, and (iii) the proportion of students in the class with diagnosed disabilities.
Single-grade or multi-grade class
At each wave, teachers were asked “Which category best describes your class organisation?” Options were: “Single grade/year level”, “Multi-age/multi-grade (single teacher)”, “Multi-age/multi-grade (team teaching)”, “Ungraded (special education class)”, “Ungraded (alternative school program)”. For these analyses, the multi-age/multi-grade and ungraded categories were combined, resulting in two categories: single-grade and multi-grade. A higher proportion of teachers at Years 5–6 (48%) reported teaching multi-grade classes than teachers at Years 3–4 (41%) and 1–2 (39%).
Teaching practices were compared by class type (single or multi-grade). Table 7.9 provides a summary of the significant results.
Notes: ns = not statistically significant at any wave based on the results of chi-square test at p < 0.05.
Source: LSAC K cohort, Waves 2, 3 and 4
Type of classroom activities
Significant differences were observed in teachers’ use of supported small-group activities, according to class type. Teachers of multigrade classes engaged their students in supported small-group activities more often than teachers of single-grade classes. This difference was evident at all year levels (see Figure 7.11). For instance, a third (33%) of teachers of multi-grade classes used small-group activities “very often” at Years 1–2 compared with 27% of teachers of single-grade classes.
Conversely, teachers who taught a multi-grade class were significantly more likely than those who taught a single-grade class to report that they “never” or only “occasionally” engaged in directed whole-group activities (12% vs 8%), although this difference was only evident at Years 5–6 (c2 (2, n = 3,333) = 17.0, p < .01). This difference is to be expected, given that teachers of multi-grade classrooms would be required to provide instruction appropriate to two different year levels.
Class type was also significantly associated with teachers’ use of child-initiated activities (see Figure 7.11). Compared to teachers of multi-grade classrooms, teachers of single-grade classes were more likely to report that they never or occasionally used these activities with their Years 3–4 and 5–6 students. Group differences were largest at Years 3–4.
Teachers of single- and multi-grade classes did not significantly differ in their use of supported individual activities at any wave.
Figure 7.11: Frequency of teachers’ engagement in different types of activities, by class type
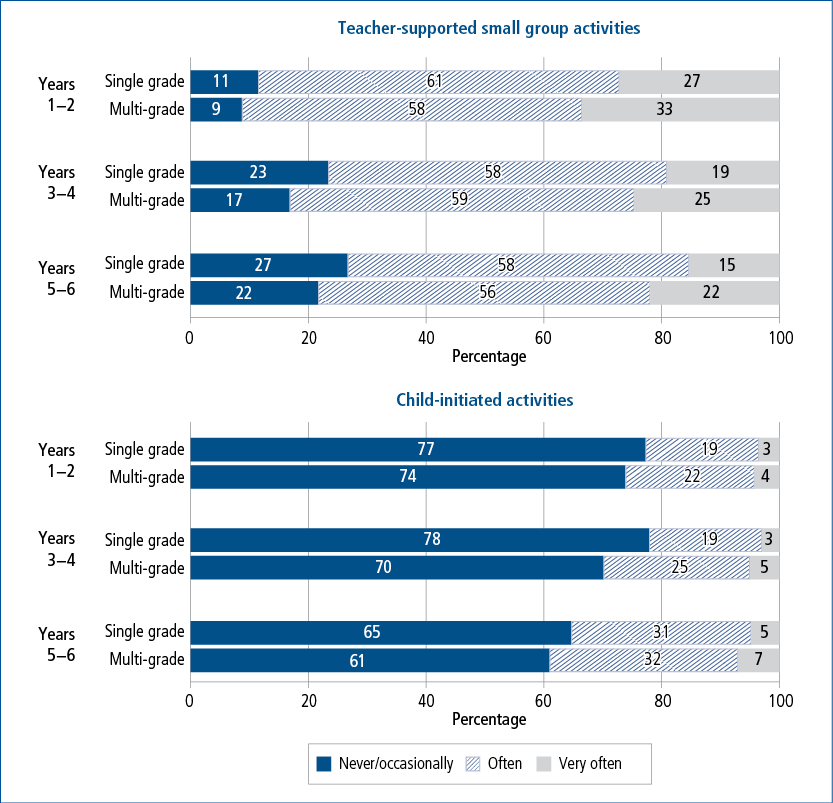
Notes: Teacher-supported small-group activities: Years 1–2: c2 (4, n = 3,156) = 17.2, p < .01; Years 3–4; c2 (4, n = 3,583) = 30.5, p < .001: Years 5–6: c2 (4, n = 3,333) = 28.4, p < .001. Child-initiated activities: Years 1–2: not significant; Years 3–4; c2 (4, n = 3,579) = 29.6, p < .001: Years 5–6: c2 (4, n = 3,335) = 9.8, p < .05. Percentages may not total exactly 100.0% due to rounding.
Source: LSAC K cohort, Waves 2, 3 and 4
Emphasis when teaching reading and maths
Class type (single- or multi-grade) was not significantly associated with teachers’ approaches to teaching reading and maths, at any wave.
Within-class grouping for reading and maths
Some significant differences were found in teachers’ use of within-group reading depending upon whether they taught a single- or multi-grade class (see Figure 7.12). The nature of these differences varied according to year level. For instance, in Years 5–6, teachers of multi-grade classes used within-class grouping for reading more frequently than teachers of single-grade classes (58% of teachers of multi-grade classes reported using these groups “three or more times a week” compared with 48% of single-grade classes). Conversely, in Years 1–2, teachers of single-grade classes were somewhat more likely than teachers of multi-grade classes to use within-class grouping for reading 1–2 times a week, although the magnitude of this difference was quite small (19% vs 15%).
In comparison, group differences were larger and more consistent when looking at the use of within-class grouping for maths (see Figure 7.12). At all year levels, a notably higher proportion of teachers of multi-grade classes reported more frequently using within-class grouping to teach maths. This difference was most pronounced among teachers in Years 1–2 and 3–4. For instance, more than half (54%) of Years 1–2 teachers of multi-grade classes used within-class grouping to teach maths three or more times a week, compared with about a third (32%) of teachers of single-grade classes.
Figure 7.12: Within-class grouping for reading and maths, by class type
Notes: Within-class grouping for reading: Years 1–2: c2 (2, n = 3,137) = 10.1, p < .05; Years 3–4: not significant; Years 5–6: c2 (2, n = 3,324) = 32.2, p < .001. Within-class grouping for maths: Years 1–2: c2 (2, n = 3,141) = 139.7, p < .001; Years 3–4: c2 (2, n = 3,542) = 105.0, p < .001; Years 5–6: c2 (2, n = 3,312) = 57.1, p < .001.
Source: LSAC K cohort, Waves 2, 3 and 4
Proportion of students from non-English speaking (NES) background
Data were collected at each wave from teachers regarding the number of children in their class that were “from a non-English speaking family background” (hereafter, referred to as NES background). No information was available on their English proficiency. This should be taken into account while interpreting the results.
For these analyses, the number of students in the class who were from a NES background was divided by class size to derive a proportion. Classes were divided into three groups on the basis of the proportion of students from NES backgrounds they contained: “none”, “20% or less”, or “more than 20%”. Approximately one in five teachers (19–21%) at each wave reported that their class was quite ethnically diverse, with more than 20% of their students having a NES family background (see Figure 7.13).
Figure 7.13: Proportion of students from non-English speaking backgrounds, by year level
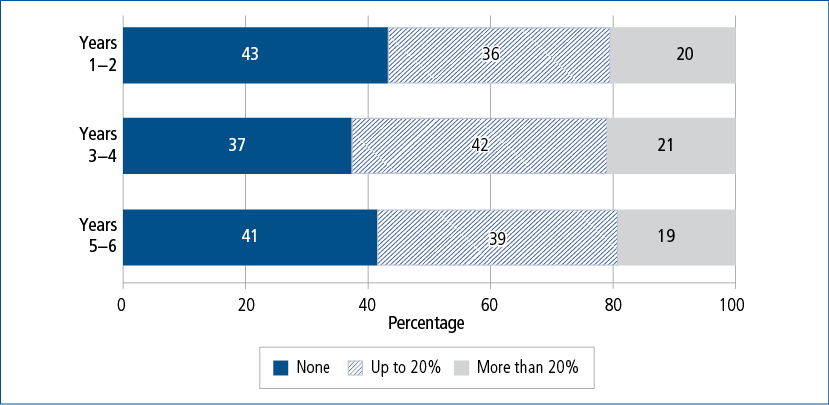
Notes: Percentages may not total exactly 100.0% due to rounding.
Source: LSAC K Cohort, Waves 2, 3 and 4
A few significant differences were observed in teachers’ use of different teaching practices, according to the proportion of students from NES backgrounds in their class (see Table 7.10).
Notes: NES = non-English speaking. ns = not statistically significant at any wave based on the results of chi-square test at
p < 0.05.
Source: LSAC K cohort, Waves 2, 3 & 4
Type of classroom activities
On the whole, teachers’ use of different classroom activities did not differ in accordance with the proportion of students from NES backgrounds in their class. The only exception related to teachers’ use of child-initiated activities in Years 5–6 (c2 (4, n = 3,196) = 15.2, p < .05). Teachers whose classes comprised of more than 20% of students from NES backgrounds were less likely than teachers with less ethnically diverse classes to report that they used child-initiated activities “often”. About a quarter (26%) of teachers with more than 20% of students from NES backgrounds in their class used these activities often, compared with about a third of those with some students from NES backgrounds (33%) or none (32%).
Emphasis when teaching reading and maths
The proportion of students in a class from a NES background was not significantly associated with teachers’ approaches to teaching reading at any year level.
However, a significant difference was observed in teachers’ approaches to teaching maths, depending upon the ethnic diversity of their class, but only at Years 1–2 (c2 (4, n = 3,108) = 14.2, p < .05). Teachers with a high proportion of students from NES backgrounds were more likely than other teachers to favour an equal emphasis on “talking about and solving mathematical problems” and “learning rules, facts and procedures” (60%) than those with up to 20% students from NES backgrounds (51%) or no students from NES backgrounds (54%).
Within-class grouping for reading and maths
Teachers’ use of within-class grouping to teach maths and reading also varied in accordance with the ethnic diversity of their classes, but only at Years 1–2 (see Table 7.11).
Compared to teachers who had a high proportion of students from NES backgrounds in their class and those with no students from NES backgrounds, teachers whose classes comprised of up to 20% of students from NES backgrounds tended to use within-class grouping to teach reading less frequently. In contrast, teachers with more ethnically diverse classes tended to use within-grouping for maths more frequently than other teachers. Almost half (47%) of Years 1–2 teachers whose classes comprised more than 20% students from NES backgrounds used this approach three or more times a week, compared with 37% of those with up to 20% of NES background students and 40% of those with no NES background students.
Notes: Within-class grouping for reading (Years 1–2): c2 (2, n = 3,102) = 14.9, p <.05. Within-class grouping for maths (Years 1–2): c2 (2, n = 3,089) = 19.1, p < .01. Percentages may not total exactly 100.0% due to rounding.
Source: LSAC K cohort, Wave 2
Proportion of students with a diagnosed disability
Data were collected at each wave from teachers regarding the number of children in their class that had “a diagnosed disability (e.g., intellectual, sensory, physical, Autism Spectrum Disorder, developmental delay)”. No information was available on type or severity of disability. This should be taken into account when interpreting the results.
The proportion of students in each class that met this criterion was calculated by dividing the number of students in the class with a diagnosed disability by class size. Using these proportions, classes were classified as having “none”, “up to 10%” and “more than 10%” of students with disabilities.6 The distribution of classes with students with disabilities was almost identical in Years 1–2 and 5–6, with more than a third of teachers having no students with disabilities in their class, 45–46% teaching classes comprising up to 10% students with disabilities, and 17% of teachers teaching classes in which more than 10% of students had disabilities. At Years 3–4 only 33% of teachers said that none of the children in their class had a diagnosed disability. As it is not possible to determine the severity of these students’ limitations due to their disability, there is likely to be a considerable amount of variation.
Table 7.12 provides an overview of those teaching practices that significantly differed according to the proportion of students in the class with diagnosed disabilities.
Notes: ns = not statistically significant at any wave based on the results of chi-square test at p < 0.05.
Source: LSAC K cohort, Waves 2, 3 & 4
Type of classroom activities
It appeared that having students with disabilities in the classroom had little impact on teachers’ use of different classroom activities. The only exception was with child-initiated activities. However, the pattern of group differences was not consistent across waves (Figure 7.14).
Figure 7.14: Use of child-initiated activities by proportion of students with diagnosed disabilities
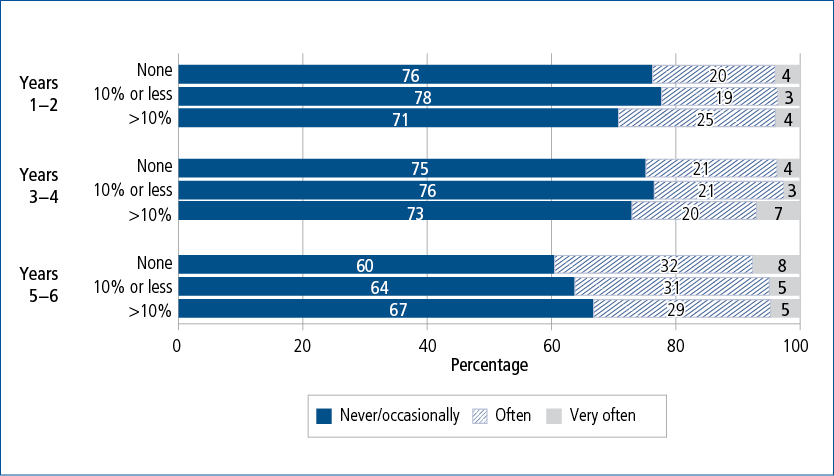
Notes: Years 3–4: c2 (4, n = 3,075) = 22.3, p < .01; Years 5–6: c2 (4, n = 3,196) = 13.6, p < .05.
Source: LSAC K cohort, Waves 2, 3 & 4
In Years 3–4, a slightly higher proportion of teachers who taught classes with more students with a disability reported using child-initiated activities with their students “very often” (7% compared with 3% of those with < 10% of students, and 4% with none). In Years 5–6, teachers with more than 10% of students with diagnosed disabilities were less inclined to engage their students in child-initiated activities, compared to those with no students with diagnosed disabilities. Over two-thirds of teachers whose classes comprised more than 10% of students with diagnosed disabilities never or only occasionally used child-initiated activities, compared to 60% of teachers in classes where no students had a diagnosed disability.
Emphasis when teaching reading and maths
There was some variation in teachers’ approach to teaching reading based on the proportion of students with a disability in their class, but only with younger students. At Years 1–2, teachers of classes with at least one student with a disability were somewhat more likely to favour an increased emphasis on “phonetics and decoding” when teaching their students to read, although the majority of teachers still favoured a more balanced approach to teaching reading (c2 (4, n = 3,116) = 15.0, p < .05). For instance, 16% of teachers with classes comprising the highest proportions of disabled students and 15% of those with at least one student with a disability reported favouring phonetics and decoding, compared with only 11% of teachers with no students with diagnosed disabilities in their class.
Teachers did not differ in their approach to teaching maths depending upon the number of children with disabilities they had in their class.
Within-class grouping for reading and maths
Some significant differences were found in teachers’ use of within-class grouping to teach reading and maths; however, these were not observed consistently across year levels. For instance, teachers with students with disabilities in their class tended to use within-class grouping to teach reading more frequently in Years 5–6 than those who had no students with a disability in their class (c2 (2, n = 3190) = 20.5, p < .01). Fifty-seven per cent of teachers with >10% of students with disabilities in their class used within-class grouping three or more times a week, compared with 53% of those with at least one student with a disability and 49% of those with no students with a diagnosed disability.
Similarly, teachers with classes comprising a high proportion of disabled students were also more likely to use within-class grouping to teach maths in Years 1–2. Almost half (49%) of teachers whose classes comprised more than 10% of students with a disability used within-grouping for maths three or more times a week, compared with 40% of those whose classes included at least one student with a disability, and 38% of those who had none (c2 (2, n = 3089) = 19.4, p = < .01).
7.7 Summary
This chapter has provided a comprehensive overview of teaching practices in Australian primary schools. More specifically, this chapter examined how teaching practices differed across year levels and according to a range of school, teacher and class characteristics. Three aspects of teaching practice were examined: (i) types of classroom activities, (ii) approaches to teaching maths and reading, and (iii) within-class grouping for maths and reading. As expected, clear differences were observed in the approaches teachers used with students in different year levels. School, teacher and class characteristics also appeared to influence how teachers worked. An overview of the main findings follows.
Use of classroom activities
Teachers used a variety of teaching approaches in their classrooms, with the majority reporting that they engaged their students in whole group, small group and individual activities on a regular basis. Child-initiated activities, on the other hand, were used much less commonly by teachers. The frequency with which teachers used these activities varied somewhat depending on year level, with supported small group activities being used less frequently as students moved through primary school, and child-initiated activities being used most often with Years 5–6 students.
Teachers’ use of different classroom activities varied according to the characteristics of the school that they worked at, the structure and composition of the class that they taught, and their own attributes. Group differences were generally small and centred mainly around how often teachers used small-group activities and child-initiated activities.
Teachers working in independent schools were less likely to use supported small-group activities with students at all year levels, as were teachers with higher levels of experience teaching at Years 3–4. In contrast, the use of supported small-group activities was more common among teachers working at schools with more advantaged student populations (in Years 3–4).
A broad range of school, teacher and class characteristics was associated with teachers’ use of child-initiated activities. Teachers working in schools with higher levels of socio-educational advantage tended to engage their students in these activities more often than teachers at other schools (Years 3–4, 5–6). In Years 1–2, the use of child-initiated activities was less common among teachers who were more experienced at that grade level. Those teaching single-grade classes (in Years 3–4 and 5–6) and teachers with a high proportion of students in their class from NES backgrounds (in Years 5–6) also used child-initiated activities less commonly. Teachers’ use of these activities also differed according to school sector and the proportion of disabled students within their class, although the nature of these differences varied across year levels.
Additionally, teachers with higher levels of self-efficacy tended to use all types of classroom activities more often than teachers who reported lower levels of self-efficacy. Group differences were strongest for the use of supported small group and supported individual activities.
Emphasis when teaching reading and maths
There was some variation in the approaches teachers took to teaching reading in Years 1–2 and 3–4. While the majority of teachers at each year level favoured an equal emphasis on language structure (i.e., phonetics and decoding) and deriving meaning from text (i.e., reading and comprehending whole texts), teachers were more likely to show a preference for reading and comprehending whole texts with Years 3–4 students than students in Years 1–2.
School, teacher and class characteristics appeared to influence the approaches that teachers used when teaching reading. For instance, compared to those in government or Catholic schools, a higher proportion of teachers working in independent schools reported a preference for phonetics and decoding (in Years 1–2 and 3–4). Teachers with a relatively high proportion of students with a diagnosed disability in their class (> 10%) were also more inclined to place a greater emphasis on this approach (in Years 1–2). On the other hand teachers working in schools ranked high in socio-educational advantage were more likely to favour an emphasis on “reading and comprehending whole texts”, compared to those teachers in less advantaged schools (in Years 3–4). Approaches to teaching reading also varied in accordance with teachers’ experience at the year level they were currently teaching. Highly experienced Years 1–2 teachers were more likely to favour an equal emphasis on language structure and deriving meaning from text when teaching reading.
Turning now to maths, most teachers favoured a balanced approach to teaching this subject, and spent time discussing and solving mathematical problems as well as teaching students mathematical rules, facts and procedures. More than a third of Years 1–2 teachers (36%) favoured a greater emphasis on talking about and solving mathematical problems. However, the majority of those teaching Years 3–4 had a strong preference for a more balanced approach.
There was more uniformity in teachers’ approaches to teaching maths than there was with teaching reading, with few school, teacher and class characteristics making a difference to their approach to teaching. Teachers who had lower levels of confidence in their teaching abilities were more likely to place greater emphasis on teaching students mathematical rules, facts and procedures (in Years 1–2 and 3–4). Teachers working in independent schools were also more likely to favour this approach (in Years 1–2). In contrast, those who had a high proportion of students in their class from non-English speaking family backgrounds were more likely to favour an equal emphasis on both approaches to teaching maths.
Within-class grouping for reading and maths
The vast majority of teachers reported organising their class in achievement-level groupings for reading and/or maths, particularly with younger students. However, use of within-class grouping for both reading and maths was more frequent among teachers working in government schools (all year levels) and among teachers with higher levels of confidence in their teaching abilities (in Years 3–4 and 5–6 for reading, and at all year levels for maths).
A range of other school, teacher and class characteristics were also associated with teachers’ use of within-class grouping for reading; however, these differences were not as consistent, only being observed at particular year levels. For example, among teachers of Years 5–6 students, use of this strategy was more common among teachers working in less advantaged schools, teachers of multi-grade (composite) classes, and those with a relatively high proportion of students with a diagnosed disability. On the other hand, in Years 1–2, within-class grouping was used less regularly for reading if teachers had moderate levels of ethnic diversity (up to 20% of students from NES backgrounds) in their classes.
Class characteristics were also significantly associated with teachers’ use of within-class grouping for maths. At all year levels, teachers of multi-grade classes used achievement-level grouping for maths more frequently than teachers of single-grade classes. In Years 1–2, teachers with a high proportion of students in their class from non-English speaking family backgrounds, and those teaching students with diagnosed disabilities also tended to use this strategy more often than other teachers. Use of within-class grouping for maths also differed according to teacher experience. Teachers who had more experience teaching Years 5–6 students tended to use this practice more often than teachers with less experience at this year level.
Limitations
Some limitations of these data analyses should be acknowledged. Firstly, the current chapter examined variations in teaching practices according to a range of school, teacher and class characteristics. These characteristics were selected on the basis on what was available in the LSAC dataset and considerations about chapter readability. As a result, it is likely that other important correlates of teaching practices were not included in our analyses. Secondly, in the interests of readability, the decision was made to limit the scope of these analyses to the K cohort rather than reporting results from both cohorts. Hence, it would be interesting to replicate these analyses with the B cohort to see if a similar pattern of results emerges. Thirdly, ICSEA data were not available at Wave 2, when participants were in Years 1–2, meaning that analyses comparing teaching practices by school educational advantage level were not possible at this wave. Fourthly, student’s skill levels within the classroom may differ considerably according to the proportion of children with NES backgrounds and diagnosed disabilities. With more variation in skill levels, teachers may have to use strategies such as ability-based grouping more often. However, there is also likely to be considerable variation within the groups of students who have diagnosed disabilities (depending on the severity of the limitation) and among those from NES backgrounds (depending on levels of English fluency, and it may be the case that these children are actually the higher skilled group). This may contribute to the lack of significant differences in terms of classroom activities. Additionally, missing teacher data resulted in lower sample sizes, affecting these data analyses. Next, data reported in this chapter were collected prior to the implementation of the new Australian Curriculum (which is currently underway). It is possible that variations in teaching practices between states and territories may have affected our findings; however, their influence is unlikely to be large, given that the focus of this chapter was on how teachers teach, rather than on what they teach. Finally, the measures of teaching practice used in this chapter were all self-reported by the teachers themselves, not objectively measured through observations in the classroom. Hence, it is possible that self-report biases may have influenced study findings.
Conclusion
As the previous summary highlights, teaching practices were not universal. Teachers worked in different ways according to the age of their students, the school where they worked, the structure and composition of their class, and their own characteristics. Group differences were generally quite small and mainly related to the amount of time that teachers devoted to small group and child-initiated activities; the emphases they placed when teaching students to read; and their use of within-class grouping for reading and maths. Not surprisingly, student year level was a strong correlate of teaching practice, with teachers more likely to favour particular strategies with certain age groups. Teacher self-efficacy was also strongly associated with teachers’ use of different teaching practices, particularly the modes of instruction they employed. School sector and class type (single- or multi-grade) were also important differentiators.
It is not the purpose of this chapter to explain why teaching practices varied in accordance with school, teacher and class characteristics but to provide a snapshot of teaching practices in Australian primary schools. However, it is likely that developmental considerations, and the need to adapt teaching to meet the needs of a wide range of students were among the factors that contributed to these differences. Indeed, findings highlight the ways teachers tailor their teaching to student needs, with within-class grouping appearing to be a popular approach for managing student diversity (in age, ability and cultural background), and teachers of students with disabilities or from non-English speaking backgrounds favouring different approaches to teaching maths and reading (in some year levels).
An important question arising from this research is: What impact does this variation in teacher practice have on student outcomes? Future research examining the interconnections between teacher, student and class characteristics on children’s learning would be of benefit in helping to understand which factors work best in promoting student achievement and engagement, and how teaching practices can be best tailored to fit the needs of students.
7.8 References
Australian Curriculum, Assessment and Reporting Authority (ACARA). (2015). About ICSEA: My School Fact Sheet. Retrieved from <www.acara.edu.au/verve/_resources/About_ICSEA_2014.pdf>.
Bourke, S. (1986). How smaller is better: Some relationships between class size, teaching practices, and student achievement. American Educational Research Journal, 23, 558–571.
Caprara, G. V., Barbaranelli, C., Steca, P., & Malone, P. S. (2006). Teachers’ self-efficacy beliefs as determinants of job satisfaction and students’ academic achievement: A study at the school level. Journal of School Psychology, 44, 473–490.
Choy, S. P. (1997). Public and private schools: How do they differ? Findings from “The Condition of Education 1997” (No. 12). Washington, DC: National Center for Education Statistics.
Hattie, J. (2009). Visible learning: A synthesis of over 800 meta-analyses relating to achievement. Oxon: Routledge.
Isac, M. M., Dinis da Costa, P., Araújo, L., Soto Calvo, E., & Albergaria-Almeida, P. (2015). Teaching practices in primary and secondary schools in Europe: Insights from large-scale assessments in Education (JRC Science and Policy Report EUR 27277 EN). Luxembourg: Publications Office of the European Commission.
Jensen, B., Sandoval-Hernandez, A., Knoll, S., & Gonzalez, E. J. (2012). The experience of new teachers: Results from TALIS 2008. Paris: OECD Publishing.
Loveless, T. (1998). Making sense of the tracking and ability grouping debate. Washington, DC: The Thomas B. Fordham Foundation.
Midgley, C., Feldlaufer, H., & Eccles, J. (1989). Change in teacher self-efficacy and student self- and task-related beliefs in mathematics during the transition to junior high school. Journal of Educational Psychology, 81, 247–258.
National Inquiry into the Teaching of Literacy (Australia). (2005). Teaching reading: Report and recommendations. Canberra: Department of Education, Science and Training.
Rice, J. K. (2010). The impact of teacher experience: Examining the evidence and policy implications (Brief 11). Washington, DC: National Center for Analysis of Longitudinal Data in Education Research.
Rowe, K. (2006). Effective teaching practices for students with and without learning difficulties: Constructivism as a legitimate theory of learning AND of teaching? Retrieved from <research.acer.edu.au/learning_processes/10>.
Slavin, R. E. (1987). Ability grouping and student achievement in elementary schools: A best evidence synthesis. Review of Educational Research, 57, 293–336.
Stipek, D. (2004). Teaching practices in kindergarten and first grade: different strokes for different folks. Early Childhood Research Quarterly, 19(4), 548–568.
Sullivan, P. (2011). Teaching mathematics: Using research-informed strategies. Australian Educational Review No. 59. Camberwell, Vic: Australian Council for Educational Research.
Tomlinson, C. A. (2001). The rationale for differentiated instruction in mixed-ability classrooms. In C.A. Tomlinson (Eds.), How to differentiate instruction in mixed-ability classrooms (2nd ed.). Alexandria, VA: Association for Supervision and Curriculum Development.
Veenman, S. (1995). Cognitive and noncognitive effects of multigrade and multi-age classes: A best-evidence synthesis. Review of Educational Research, 65, 319–381.
1 The extent to which teachers believe their teaching can make a difference to their students, feel competent to deal with students’ problems and have high expectations for their students’ achievement (Caprara, Barbaranelli, Steca, & Malone, 2006; Midgley, Feldlaufer, & Eccles, 1989).
2 Note that this school-level data cannot be considered to be nationally representative. Due to LSAC’s clustered sampling design, government schools are under-represented and independent schools are over-represented.
3 Notably, only 1% of teachers put emphasis only on phonetics or understanding the whole text in Years 1–2. In Years 3–4, only one teacher reported putting emphasis only on phonetics and around 100 teachers (2%) reported focusing on understanding the whole text only.
4 Differences in teaching practices according to teachers’ highest level of qualification and their major field of study were also examined. However, few significant differences emerged when teaching practices were compared according to teachers’ qualification levels. Further, the vast majority of teachers at each year level listed their major field of study as either Primary Education (77% in Years 1–2 to 90% in Years 5–6) or Early Childhood Education (18% in Years 1–2 to 3% in Years 5–6). Therefore, it was not feasible to examine differences in teaching practices according to teachers’ field of study.
5 Continuous measure was not used as the distribution was heavily skewed.
6 A cut-off of 10% was selected in favour of a higher cut-off due to the small number of teachers who taught classes with relatively high proportions of disabled students (i.e., less than 4% of teachers taught classes with more than 20% of disabled students). At all waves, less than 20% of teachers reported having two or more students in their class with disabilities, and less than 3% taught five or more disabled students.
Share


