3. Teen employment experiences
3. Teen employment experiences

3.1 Introduction
Many young people work part-time while they are still in school, including doing casual jobs such as babysitting, working in a family business, and working for wages outside school hours. Little is known, however, about how teens fit their employment around their school hours, and to what extent this varies across demographic groups. This chapter will explore this using Wave 6 of the K cohort in LSAC, to focus on the employment participation of 14–15 year olds. Wave 5 information is also incorporated to explore to what extent children were working at 12–13 years. Throughout the chapter these young people at 12–13 and 14–15 years are referred to as teens.
It is generally acknowledged that part-time employment can be beneficial to school students, through the positive effects on their independence (in terms of income and a sense of autonomy or responsibility, for example) and the potential for them to acquire new skills (Marsh, 1991; Stern & Briggs, 2001). However, it may also pose risks for children’s academic outcomes if a significant amount of time is spent in employment (Vickers, Lamb, & Hinkley, 2003). This may be because work time encroaches too much on time that children would be undertaking schoolwork. By exploring which teens are working, how much and when they are working, we aim to contribute to the research evidence on to what extent teens are balancing their study commitments with those of employment.
To explore this, it is valuable to focus on those who are just beginning their journey of combining work with study. For many this will occur from around 15 years, which is the age at which restrictions on employment are lifted in most jurisdictions of Australia, although regulations continue to govern the type, times and amount of work children may do while they are still undertaking compulsory education.1 The main source of research on the employment of 15 year olds in Australia has been the Longitudinal Surveys of Australian Youth (LSAY), in which Year 9 students (who are around 15 years old) across a number of birth cohorts have been asked about their employment participation (e.g., Anlezark & Lim, 2011; Vickers et al., 2003). In LSAY, in 2009, 41% of 15 year olds (average age 15.7 years) who answered the employment questions were classified as employed at the time of the study.2
The Australian Bureau of Statistics (ABS) also produces information relevant to this age group. The Labour Force Survey captures employment information for all persons aged 15 years and over. From publication of these data for 15–19 year olds in full-time school (not tertiary study), in March 2016, 32% were employed (29% of boys and 37% of girls).3 These estimates are produced monthly, showing variation across the year. For example, in the year to March 2016, the highest employment rate was 36% in December 2015 and the lowest was 29% in August 2015. From the ABS 2011 Census of Population and Housing (the Census), which was conducted in August, the estimated percentage employed among 15–19 year old school students was 35%. Among 15-year-old students, it was lower than the estimate from LSAY, at 18% (16% boys and 21% girls).4
Differences in estimates across data collections are likely to reflect different data collection and recruitment methodologies and different reference periods. In the Census and the Labour Force Survey employment information is based on work in the previous week, while the LSAY question more generally asks about having a current job, business or farm.
None of these data sources provides information about the employment of young people under the age of 15. In all jurisdictions of Australia, the employment of children younger than 15 is permitted, although under stricter conditions than for those aged 15 and over.5 A survey on child employment (of 5–14 year olds) was conducted by the ABS in 2006 (ABS, 2007), and captured any sort of work (including casual work or work for a family business) done in the previous year. This survey found that 2% of 5–9 year olds and 11% of 10–14 year olds had done some work in the previous year. While this publication included some useful information about children’s jobs, the aggregation of information for all employed 5–14 year olds (sometimes disaggregated into 5–9 years and 10–14 years) made it difficult to assess how employment might matter to children at different points in their school life.
This chapter will explore the employment of teens at 12–13 and 14–15 years, by looking at the percentage who worked in the previous year, using Waves 5 and 6 of the LSAC K cohort. We explore how child and family characteristics are associated with patterns of employment, contributing to the fairly sparse Australian literature on this topic. In addition to the child employment publication by the ABS, previous research includes Biddle’s (2007) analysis of the 2001 Census to explore the employment participation of 15–19 year old students, and their likelihood of working long hours. This included specific analysis by single years of age, allowing examination of the employment of 15 year olds. The characteristics of teens’ employment was covered in research by Anlezark and Lim (2011) using the LSAY cohort aged 15 years in 2003, in research on whether combining work and study affected post-school outcomes. Previously, analyses by Vickers et al. (2003) examined a similar question using an earlier (1995) cohort of LSAY, and also included some analyses of which teens were employed and the characteristics of employment. Smith and Wilson (2002) reported on findings from a study of student employment conducted in NSW and South Australia in 2000. A report on student employment by Robinson (1996) used data from Youth In Transition (the precursor to LSAY), in which students were aged 15 years in 1990. Robinson (1999) also used these data to analyse the effects of part-time work on students, with a significant focus on students’ reasons for employment.
Some findings from this research are:
- Age: Employment participation among school students increases with age from age 15 years (Anlezark & Lim, 2011; Robinson, 1996). Smith and Wilson (2002) found a slightly different trend for older school students, reporting lower participation rates at Year 12 compared to Year 11, which seemed to reflect withdrawal from employment by some Year 12 students who wished to focus more on their schooling.
- Gender: Most evidence points to female students aged 15 years or older having higher employment participation rates compared to males (Anlezark & Lim, 2011; Biddle, 2007; Robinson, 1996). However, in the LSAY Year 9 cohort of 1995, the employment rates were slightly higher for boys than girls (Vickers et al., 2003). Also, in the analyses of child employment by the ABS (2007), the proportion working in the previous year was higher for boys (12.7%) than for girls (9.5%) in the 10–14 years age group.
- Region: Findings are not consistent across all studies, nor even within studies (e.g., Robinson, 1996). Biddle found that differences by remoteness were not statistically significant for 15 year olds, but at ages 16 and 17 years, the proportion employed was highest in major city areas, declining with increased remoteness. However, the ABS found lower rates of child employment in capital cities compared to other areas of Australia, and Vickers et al. (2003) also found that employment rates were lowest among students living in urban areas, compared to rural or remote areas. This was found again in later analyses of LSAY by Anlezark and Lim (2011), in which employment rates were highest in remote areas of Australia. Smith and Wilson (2002) also found that rural students were more likely to work than students in urban areas; and while informal work was more common in rural than urban areas, higher rates of employment in rural areas were not explained entirely by higher rates of informal work.
- Socio-economic status: Research typically finds students’ employment rates are lower in lower socio-economic families, as measured by family or household wealth or income (Biddle, 2007; Robinson, 1996; Vickers et al., 2003). Biddle also found lower rates of employment among students living in jobless households. Anlezark and Lim (2011) found that the association between family socio-economic status and teens’ employment varied by age and gender of the children. Smith and Wilson (2002) found that children from higher socio-economic status families seemed to be more likely to work in informal jobs, while those in lower socio-economic status families were the most likely to have “ordinary” paid jobs.
- Culture and language: Indigenous students generally have lower employment rates than non-Indigenous students. Further, children from non-English speaking backgrounds are less often employed than English-speaking students. For a comprehensive analysis of employment according to ethnic origin, refer to Robinson (1996).
Differences in findings across years are likely to reflect changes in school student employment, with rates of employment higher now than they were prior to the 1990s, and trends also affected by more teens completing secondary school than was the case in previous decades (Biddle, 2007; Robinson, 1996).
A key contribution of this chapter is that we look at informal employment as well as work for an employer, and explore how participation in different types of work varies across different teens. In examining informal work, we will include teens’ reports of working for themselves, their family or someone else, other than an employer.6 Informal work may be undetected in some of the previous research on teen employment, given more precise definitions of employment applied, so we can explore whether a more inclusive measure allows us to see different patterns of participation.
Some of the abovementioned research has explored the characteristics of employment, with the greatest focus being on the number of work hours. Generally, students at around 15 years have quite low average weekly work hours (Robinson, 1999; Smith & Wilson, 2002). Anlezark and Lim (2011), for example, reported that in Year 9 the average work hours were 10.9 hours per week, with 17% of all working Year 9 students working 15 hours or more per week. The ABS (2007) survey of child employment also found that on average children worked few work hours during school terms, with 45% of children aged 10–14 years working 1–2 hours per week, 28% working 3–5 hours, 15% working 6–9 hours and 11% working 10 hours or more. We will be exploring work hours in this chapter, along with information about whether teens work in school holidays or school terms, on weekdays or weekends, and the times of day they work. This information is especially valuable for learning about how teens fit their work around their school commitments.
Information on teens’ reasons for employment reveals that they are predominantly motivated to work by their own financial goals to earn some spending money and gain financial independence (ABS, 2007; Robinson, 1999). This is not the only motivation however, as some teens work to help with a family business, to gain experience or skills, or have other reasons such as wishing to help others (ABS, 2007; Robinson, 1999). Here we examine whether reasons for employment differ for those in different types of employment and for children with different characteristics. We extend this by also examining whether teens earn a wage or salary from their employment (some do not, for example those working for a family business), and if so, how much they earn.
A significant focus of the literature on teens’ employment has been concerned with whether this employment is associated with poor academic results or problem behaviours. While a popular view is that teen employment is character building, providing opportunities for teens to learn about the world of work and to develop a sense of responsibility, it has been theorised that teen employment may be related to adverse outcomes for children for a range of reasons. The two main reasons put forward in the literature are the zero-sum hypothesis (teens will have less time for school work or other productive activities if they are employed) and the precocious maturity hypothesis (teens will be exposed too early to adult roles and behaviours) (see, for example, Marsh & Kleitman, 2005; Monahan, Lee, & Steinberg, 2011; Schoenhals, Tienda, & Schneider, 1998). Findings from empirical research are diverse, such that debate continues on whether and in what circumstances teens’ employment might adversely affect academic or behavioural outcomes. An important factor, it appears, is the intensity of work (measured with different thresholds across studies), with outcomes typically not varying when teens work shorter hours, but sometimes reported to be negative for longer work hours. From the Australian research, for example, Vickers et al. (2003) found that working more than five hours per week in Year 9 was negatively associated with Year 12 completion. Other Australian research on school and post-school outcomes has varied a little in its findings, but with negative associations typically found for those working longer hours (Anlezark & Lim, 2011; Robinson, 1999).
Much of the international research is focused on teens older than those covered in this LSAC analysis, and will no doubt be useful to explore when analysing later waves of the LSAC data. A significant challenge for all of this research is that pre-existing characteristics of children (such as poor school performance or anti-social behaviour) may lead to them focusing more on employment than on school, and, in turn, the literature could overstate claims of employment being the cause of children’s poorer outcomes (Lee & Staff, 2007; Monahan et al., 2011; Paternoster, Bushway, Apel, & Brame, 2003). Undertaking a full analysis of the links between teen employment and children’s academic or social emotional outcomes is beyond the scope of this paper and will be best explored with future waves of the study. As a precursor to possible future work, here we present some evidence of the selection into employment of children with different characteristics, comparing measures of academic results (at Years 5 and 7, and Year 9) and social emotional wellbeing (at ages 10–11 years and 12–13 years, and 14–15 years) according to teen’s employment at 14–15 years. The inclusion of measures of social emotional wellbeing is a particular contribution to the literature that has been given scant attention in the existing research.
The research questions we aim to answer in this chapter are:
- How common is it for teens to work at 15 years and younger?
- When and how much are teens working?
- Which teens are doing some paid work?
- Why are teens working, and what are the financial gains to their working?
- How does social emotional wellbeing and academic achievement vary according to teens’ employment at 14–15 years?
To contribute to this analysis of LSAC we also provide some information about children’s occupations from the ABS child employment survey and about 15 year olds’ occupations as derived from the Census. We will present this information before the LSAC analyses, as it helps to put some of the LSAC findings into context.
After a description of the LSAC data and methods used, the results are organised as follows. First, the overview of employed teen’s occupations, from the ABS data, is shown in section 3.3. Turning to the LSAC data we then begin by presenting an overview of teens’ employment, by age and gender, in section 3.4. Section 3.5 explores when and how much teens are working. In section 3.6 we analyse which teens are working and in what types of employment. In section 3.7 we examine what income teens receive for their employment, and to what extent they are working for financial or other reasons. Section 3.8 presents analysis of children’s social emotional wellbeing and academic test scores according to work status at 14–15 years. Finally, in section 3.9, we summarise the key findings, including providing answers to the research questions set out above.
3.2 Data and methods
This chapter is based on the K cohort, with data sourced from Wave 6 when the LSAC study children were aged 14–15 years and Wave 5 when they were aged 12–13 years. We restrict the analyses to respondents at Wave 6, for whom we have information on teens’ employment. This represents 3,453 families. Of these families, for all but 16 cases information was available about teens’ employment at Wave 5.
Most of the information about teen’s employment was collected from the child’s primary carer. The details covered in this chapter are:
- Whether study child had done any work in the previous year. Respondents were instructed that work includes all formal and informal work for money or some other type of payment. It also includes paid or unpaid work in a family business or farm. It excludes any work teens may have done for pocket money around their home.
- How many weeks in the year the study child had worked, if they worked in the last year.
- Whether work was done only in school terms, only in school holidays or both.
- Whether work was done on weekends or weekdays, collected separately for school terms and school holidays.
- At what times of day work was typically done, collected separately for school terms and school holidays, weekends and weekdays.
- How many hours per week the study child worked, in school terms or school holidays.
- Who the study child worked for (e.g., an employer, a family business).
- Study child’s main reason for work.
- Whether study child receives wages or salary and, if so, how much they received.
More information about the classification of each of the above is given as the data are introduced into the chapter.
At Wave 6, some employment information was collected from the teens themselves, including:
- self-reports of whether they had done any work in the previous year (with the same definition of “work” as given to parents); and
- reasons for employment.
Some analyses of ABS data on teens’ occupations are also included in this chapter, in section 3.3.
Other key variables
To analyse these data, throughout the chapter we examine gender and age differences. In some sections we present multivariate analyses to consider how teens’ employment varies with a range of socio-demographic characteristics. These are:
- region of residence: major city areas, inner regional areas, outer or remote areas.
- family socio-economic status: derived from the family socio-economic position variable, with families divided by quartile within each wave. Low socio-economic status families (the bottom quartile) are compared to those in quartiles 2 and 3, and to higher socio-economic status families (the top quartile).
- culture and language: two indicators used. One captures either parent (or single parent) being Indigenous. The other captures either parent (or single parent) mainly speaking a language other than English at home.
- parental employment: two indicators used. One captures either parent (or single parent) being self-employed. The other captures either parent (or single parent) being an employee.
Measures of children’s social emotional wellbeing and academic achievement are presented according to work status at 14–15 years, drawing on these measures for the children at (or around) 14–15 years, as well as earlier points in time. The means and 95% confidence intervals are shown for:
- social emotional wellbeing: The total difficulties score and the prosocial score from the Strengths and Difficulties Questionnaire are analysed. Measures for children at 10–11 years, 12–13 years and 14–15 years are presented.
- NAPLAN results: The Year 5, 7 and 9 NAPLAN results are presented for each of the test scores available: reading, writing and numeracy.
Methods
Much of this chapter is descriptive, examining gender and age differences in employment patterns. Also, logistic regression was used to analyse employment participation, and to analyse some characteristics of employment. This allows us to report on whether certain variables have a significant association with the employment outcomes under consideration, holding other variables constant. Logistic regression is appropriate, since we are examining binary outcomes in each case. We use methods for longitudinal data that take account of there being up to two records (for two waves) per child.
3.3 Employed teens’ occupations – overview from ABS data
While LSAC contains information about the work patterns of teens, details about their occupations are not yet collected. To understand more about the employment patterns of boys and girls at 14–15 years we set the scene using some ABS data on teens’ occupations. First, Table 3.1 presents the occupations of employed 15-year-old boys and girls, from the 2011 Census. About half of the employed 15 year olds worked as sales workers, and another one in four as labourers. However, the occupation patterns are gendered.
- Among employed girls, sales workers were much more likely (61% of employed girls), with labourer work (14% of employed girls) less likely than being employed as a community and personal service worker (16%). If we go beyond this to explore the more detailed classifications of girls’ occupations, using four-digit ASCO (not shown in the table), the ten most common occupations of these girls are (with percentages showing the percentage of employed 15-year-old girls in this occupation):
- general sales assistants (39%), checkout operators and office cashiers (18%), waiters (8%), kitchenhands (6%), fast food cooks (3%), cafe workers (3%), pharmacy sales assistants (2%), sports coaches, instructors and officials (2%), child carers (1%), commercial cleaners (1%).
- Employed boys were most likely to be employed as labourers (43%) or as sales workers (32%). Their most common occupations according to the more detailed classification (not shown in the table) were:
- general sales assistants (22%), kitchenhands (15%), fast food cooks (11%), checkout operators and office cashiers (8%), shelf fillers (5%), sports coaches, instructors and officials (4%), other miscellaneous labourers (3%), waiters (2%), commercial cleaners (2%) and cafe workers (1%).
Note that these data may not fully represent the sorts of casual or intermittent work done by teens, especially younger teens, but this sort of work was included in the data collection in the ABS Child Employment Survey. The occupations of the 5–14 year old children who had worked during school terms in the previous year are also shown in Table 3.1. From this survey, for children working during school terms:
- For girls, a large percentage was employed as labourers (43% in total, of those who worked), which included leaflet or newspaper delivery (15%), cleaner/laundry (10%), farm, forestry, garden worker (10%) and other labourer (9%). The next most common classifications were community and personal service workers (22%) (most in the subcategory of carers and aides) and sales workers (20%). The remaining 14% were employed in other occupations.
- For boys, a much larger percentage was classified as labourers (71%). This category included leaflet or newspaper delivery (24%), farm, forestry, garden worker (22%), cleaner/laundry (11%) and other labourer (14%). Other boys were employed as community and personal service workers (8%), sales workers (6%) and other occupations (15%).
Many of these jobs appear to be a mix of informal jobs (e.g., babysitting and pamphlet delivery) and working for a family business or farm (e.g., sales worker, farm labourer). Nevertheless, the ABS analyses showed that of all children who worked in the previous year, 54% worked for an employer, 16% worked for themselves and 33% worked for a family business or farm. Some children worked for more than one employer type over the year.
We do not analyse these data further in this chapter but refer to these findings when discussing the results of the LSAC analysis in section 3.9.
Notes: Examples listed are the top-most occupations within the category for 15 year olds, identified using four-digit ASCO. Other occupations include not stated and inadequately described occupations, as well as managers and professionals, clerical and administrative workers, machine operators and drivers and labourers. Percentages may not total exactly 100.0% due to rounding.
Source: Australian 2011 Census of Population and Housing, Tablebuilder; Australian Bureau of Statistics (2007).
3.4 LSAC results: How common is it for teens to work at 15 years and younger?
According to parents’ reports of whether children worked in the previous 12 months:
- At age 12–13 years, 16% had worked. The percentage was similar for boys (17%) and girls (15%).
- At age 14–15 years, 39% had worked. The percentage was significantly higher for girls (42%) than for boys (36%).7
We do not know exactly how many were working at the time of the survey, as some teens had only worked a small number of weeks in the previous years. For simplicity, though, teens who were reported to have worked in the previous 12 months are often referred to in this chapter as “employed”. Those working for fewer weeks include teens having recently commenced work and those doing casual, intermittent or school holiday work.
- Among the employed 12–13 year olds, 44% had worked 1–6 weeks in the year, 16% had worked 7–12 weeks, 24% had worked 13–39 weeks and 16% had worked for 40 weeks or more.
- Among the employed 14–15 year olds, 33% had worked 1–6 weeks, 16% had worked 7–12 weeks, 13% had worked 13–39 weeks and 19% had worked 40 weeks or more.
Parents who reported that their teens had done some work in the past 12 months were asked who their child had worked for; that is, whether they had worked for an employer, a family business or farm, for themselves or someone else. According to additional information provided by parents, “someone else” was typically another relative, a family friend or neighbour. We have classified those who worked for a family business or farm, for themselves or for someone else as “informal” employment, which is consistent with the internationally-endorsed definition of informal employment.8
- At 12–13 years, 59% of the employed teens worked informally. This included 34% working for a family business or farm, 15% having worked for themselves and 11% having worked for someone else.
- At 14–15 years, 34% of the employed teens worked informally. This included 21% working for a family business or farm, 10% having worked for themselves and 5% having worked for someone else. Some reported more than one type of informal employment.
Teens could have worked for more than one employer type, but we found that only 4% of employed teens reported working informally and for an employer. We have therefore classified employment types such that “employer” includes the small percentage working informally and for an employer, and “informal” are those who only reported having undertaken informal employment.
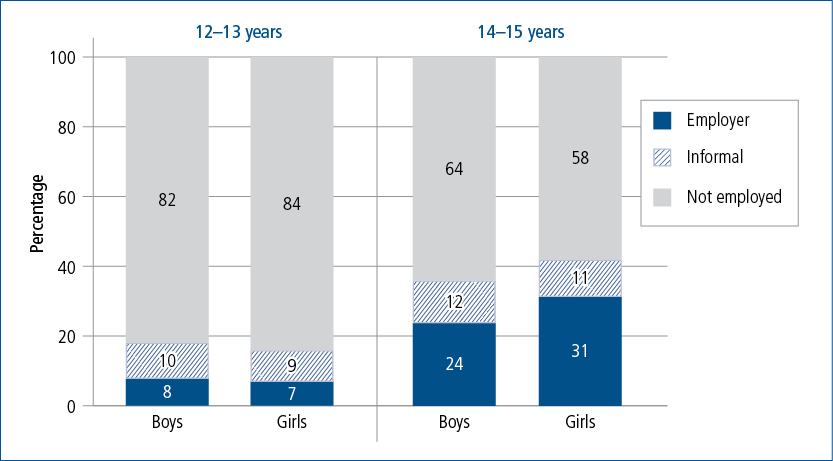
Figure 3.1 shows that teens at 14–15 years were more likely to be working for an employer than they were at 12–13 years. If we include non-employed teens in the calculations, the percentage working informally increased just a little from 12–13 years to 14–15 years, with gender differences in the proportion in informal work not apparent at either age. The percentage working for an employer increased significantly for boys and for girls, much more so for girls, such that at 14–15 years the higher percentage of girls employed reflected their being more likely to be working for an employer.
Figure 3.1: Employment type of teens at 12–13 and 14–15 years, by sex
Given these LSAC data are from the same children at different points in time, we can explore how their employment participation changed from 12–13 to 14–15 years. We do that by asking what the employment participation of teens was at 12–13 years, according to their employment status at 14–15 years.
- Overall, of those who were not employed at 14–15 years, most (92%) had not been employed at 12–13 years. If not employed at 14–15 years but employed at 12–13 years, some had previously been working informally (5%) and others had worked for an employer (3%).
- Of those who were employed at 14–15 years, 30% had been employed at 12–13 years and 70% had not been employed.
- Those in informal work at 14–15 years were most likely to have worked at 12–13 years, with 28% having been in informal work at 12–13 years and 8% having worked for an employer then.
- Among those working for an employer at 14–15 years, 12% had worked informally at 12–13 years and 16% had already worked for an employer at this time. The rest were not working at 12–13 years.
The change from 12–13 years to 14–15 years, especially in the proportion working for an employer, is not surprising since it is around the age of 15 years that restrictions on employment are lifted in most jurisdictions of Australia. Differences by age are explored further in section 3.6.
3.5 Working hours and times
Just as there is variation in how much of the year teens worked, there is likely to be considerable variation in the amount of work done by employed teens and when that work is done. To understand how employment fits around schooling, it is necessary to distinguish between employment that occurs only in school holidays, or only on weekends, from that which occurs on weekdays during school terms. Information about the times of day work is done adds further to this. This section explores these characteristics of teens’ employment.
Figure 3.2 shows that at both 12–13 years and 14–15 years most teens, if employed, worked during school terms, with the increased employment from 12–13 to 14–15 years reflected in more teens working during school terms. Increases were most apparent for the percentage working weekdays and weekends in school terms, although the patterns of weekend and weekday employment were quite varied at the older age. There was a doubling of the percentage working only in school holidays but this percentage remained considerably lower than the percentage doing some work during school terms.
Figure 3.2: School holiday and school term weekday and weekend employment among teens at 12–13 and 14–15 years
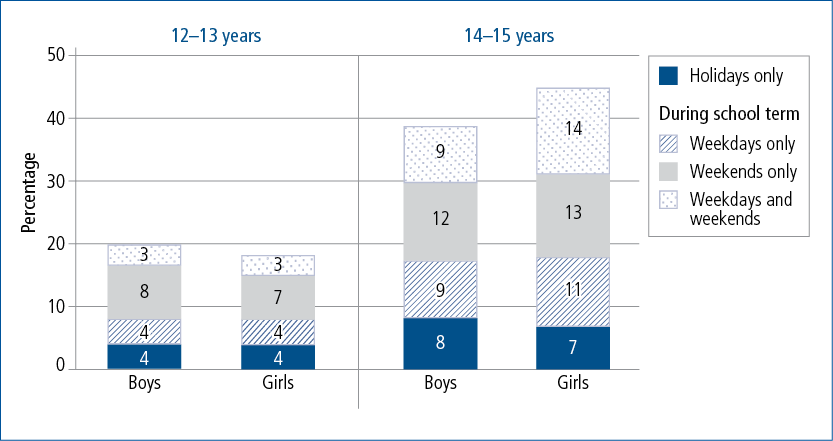
Note: Percentages add to the total employed at each age.
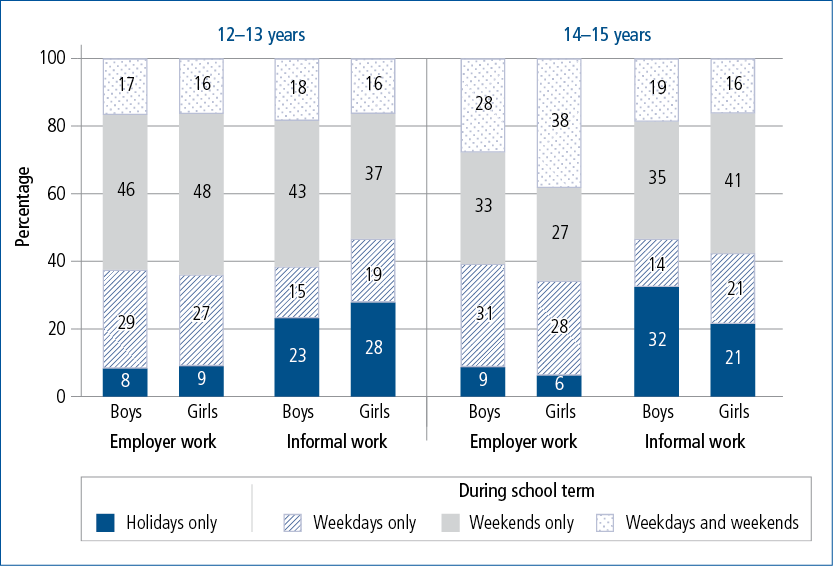
Figure 3.3 shows this information by gender and employment type but with percentages adding to the total employed in each employment type.
- At 12–13 years, these patterns of employment did not vary by gender for those working for an employer, but differences were apparent by employment status, with those working informally more often only working in school holidays.
- At 14–15 years it was again more likely that teens had worked only in school holidays if they worked informally rather than for an employer.
- At 14–15 years, boys’ informal work was more often only in holidays compared to girls’, while girls’ informal work was more commonly only on weekends during term time.
- Among those working for an employer, the nature of employment changed from 12–13 years to 14–15 years, being more often both on weekdays and weekends at the older age.
This can be further examined by looking at how many days per week teens worked. Focusing on those who worked during school terms:
- Among employed teens at 12–13 years, 52% worked only one day per week, 31% worked two days per week, 5% worked three days per week and 12% worked 4–7 days a week.
- Among employed teens at 14–15 years, 38% worked only one day per week, 36% worked two days per week, 14% worked three days per week and 12% worked 4–7 days a week.
Figure 3.3: School holiday and school term weekday and weekend employment among employed teens at 12–13 and 14–15 years, by employer type
Not surprisingly, the amount of time that teens worked per week was lower during term times compared to school holiday times.
- At 12–13 years, those working during the school term worked, on average, 2.9 hours per week during school terms. Those working during school holidays worked, on average, 5.7 hours per week in the holidays.
- At 14–15 years, those working during the school term worked, on average, 6.0 hours per week during school terms. Those working during school holidays worked, on average, 9.5 hours per week in the holidays.
- Of those who worked during school term time, just 3% of employed 12–13 year olds and 19% of employed 14–15 year olds worked 10 or more hours per week.
Differences by gender and employment type are shown in Figure 3.4.
- During school terms and school holidays, at 12–13 years the average work hours did not vary significantly by gender or by employment type.
- At 14–15 years, girls who worked for an employer worked, on average, longer than those working informally. This was the case for school terms and school holidays. While a similar trend was apparent for boys during school terms, the difference was not statistically significant.
To complete this discussion of teens’ work hours, we also explore the times of day that they were typically in employment. Figure 3.5 shows the percentage of 12–13 year olds and 14–15 year olds reported to be working across different segments of the day, on weekends or weekdays and in school terms or school holidays. This is presented as a percentage of all teens, not just those who were employed.
Figure 3.4: Average work hours in term time and school holidays of employed boys and girls at 12–13 and 14–15 years, by employment type
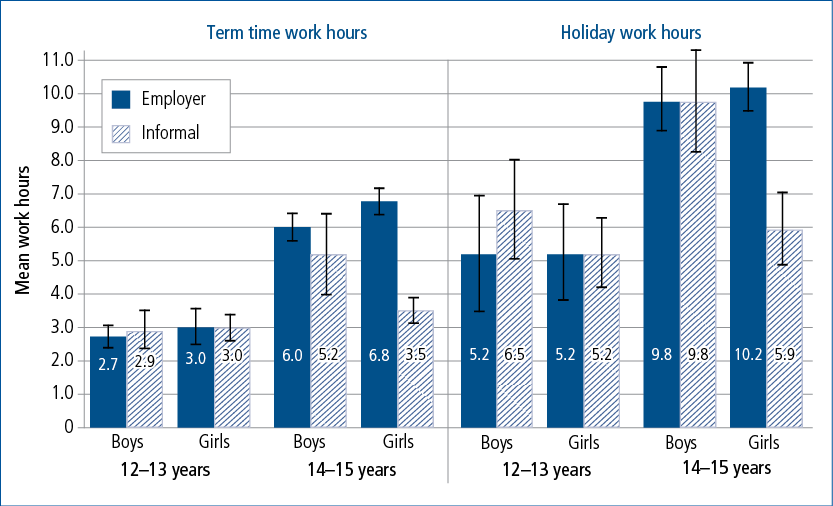
Note: Averages for term time are calculated over those with non-zero time spent working in term times, and averages in school holidays are calculated over those with non-zero time spent working in school holidays. The “I” bars represent 95% confidence intervals. “I” bars that do not overlap indicate there is a statistically significant difference between the groups.
Figure 3.5: Proportion of teens at 12–13 and 14–15 years working at different times of the day, in school term times and in holidays
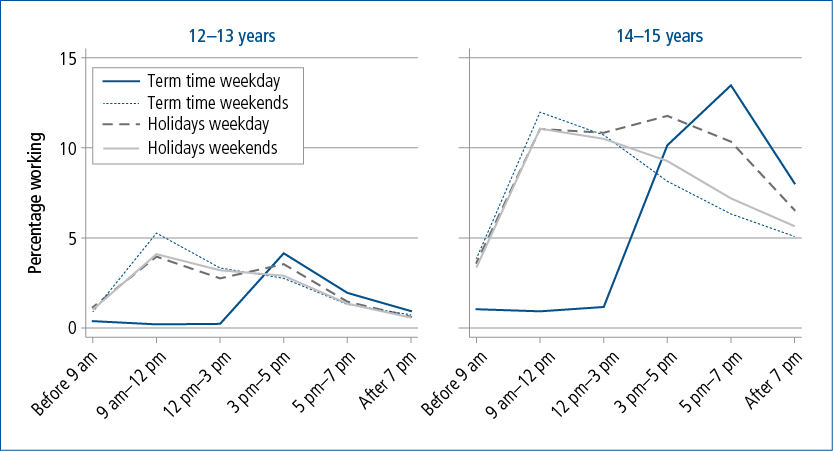
Note: Teens who were not employed at all or not working during term times were included in the denominator as zero (not working at any time).
- On weekdays of school terms there was very little employment of teens before (or, naturally, during) school hours. Other days were markedly different, with some employment of teens during 9am–12pm and 12–3pm on school-term weekends and school holiday weekends or weekdays. On these days, teens were also working in the afternoon and into the evening, but with much higher rates apparent for the 14–15 year olds, given their higher likelihood of being employed.
- On school term weekdays, for 12–13 year olds the peak in the proportion working was at 3–5pm, while for 14–15 year olds the peak was at 5–7pm, with many at this age also working between 3pm and 5pm and after 7pm.
Given the different employment rates of boys and girls at 14–15 years, were there differences in when these teens were working? We explore this just for term-time employment, also incorporating type of employment, in Figure 3.6, excluding all teens who were not working at all.
- The higher proportion of teens working in employer jobs, rather than informal jobs, at 14–15 years was especially apparent in their working in these jobs for employers in after-school hours on weekdays. Those working for an employer were also more likely than those working informally to be working at all times of day on weekends, with one exception, described below.
- Among teens working for an employer, girls were more likely than boys to be working within the commonly worked times of day. But among informal workers, boys were more likely to be working across most of the day, compared to girls. The exception was for informal work done in the late afternoon and evening. In particular, evening informal work was more often done by girls than by boys, especially on weekends.
This does not mean that employed teens worked these hours every day of course, as they represent typical working patterns on those days that teens worked.

Figure 3.6: Employed 14–15 year old boys’ and girls’ times of term-time work on weekdays and weekends by type of employment
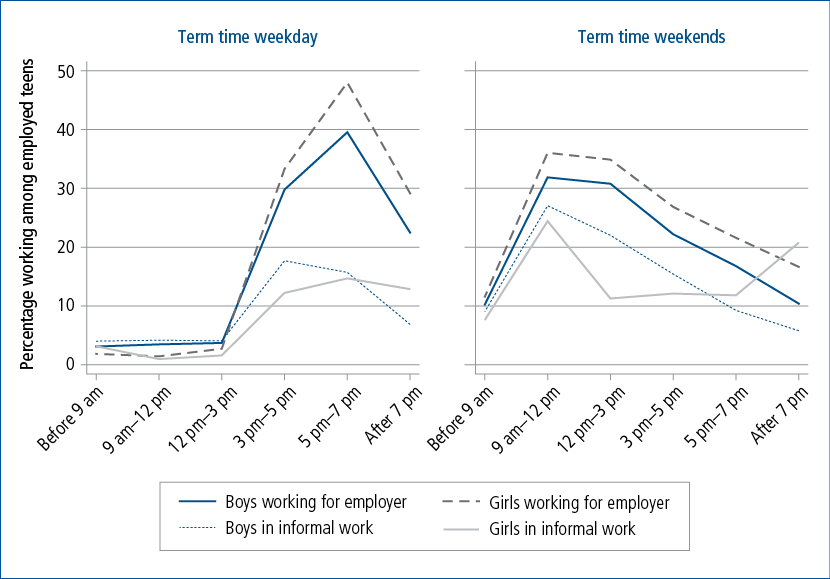
Note: Teens who were not employed at all or not during term times were not included in this figure.
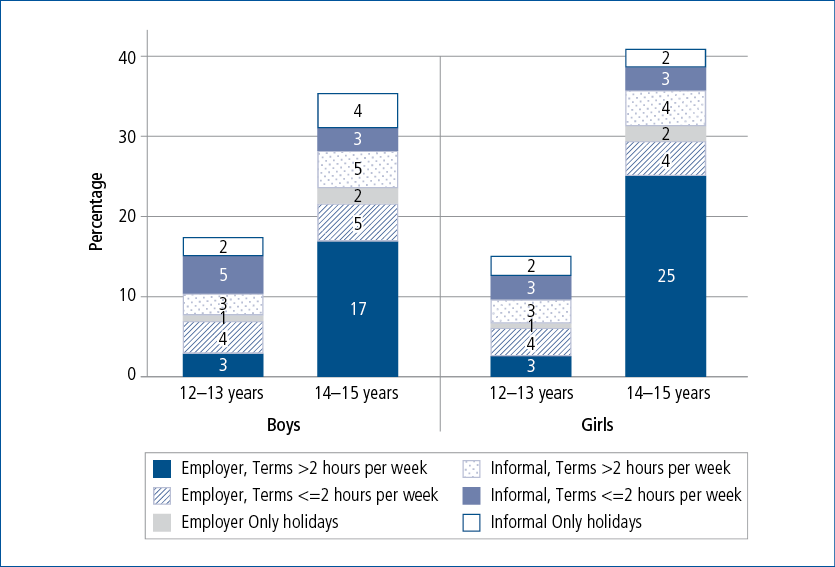
This section has highlighted that there is considerable diversity among teens in their working arrangements, with differences apparent by age, as teens moved into more formal employment at 14–15 years. There were also differences by gender. To summarise, we put together information on whether teens were employed by an employer or informally, whether they only worked in school holidays or sometimes in school terms, and whether they usually worked more than two hours per week. Together, this information is compared for boys and girls at 12–13 and 14–15 years in Figure 3.7.
- At 12–13 years there was a diverse range of work arrangements for both boys and girls who were employed. A small percentage worked more than two hours per week during term times. For boys and girls, 3% worked for an employer for more than two hours per week and 3% worked informally for more than two hours per week.
- The significant change by 14–15 years was the growth in teens working for an employer during term times for more than two hours per week, with this being the situation for 25% of girls and 17% of boys aged 14–15 years. For other employed 14–15 year olds, their work arrangements were diverse.
We will explore both age and gender differences further in subsequent sections, along with other characteristics of children and families, in relation to teens’ employment.

Figure 3.7: Summary of when, how much and what type of work teens do at 12–13 and 14–15 years
3.6 Which teens are working?
In this section we explore how teens’ employment varies with their and their family’s characteristics.
To begin, the age of teens is an important factor, in part because legislation concerning the employment of young people typically means restrictions in children’s employment are relaxed from the age of 15 years. The exact details vary across jurisdictions of Australia.
At 12–13 years, when explored by age (in months), no trends in employment participation rates were apparent for boys and girls (not shown). However, at 14–15 years, considerable differences by age were apparent. Figure 3.8 shows that among 14–15 year olds:
- The percentage who had worked increased significantly by age, from 30% for the youngest to 45% of the oldest.
- The increase with age was more apparent for 14–15 year old girls than boys, and the oldest girls were significantly more likely to have worked in the previous year compared to the oldest boys.
- The increased proportion employed reflected a trend in being employed by an employer. The proportion working in informal work did not increase with age.
Beyond these age and gender differences, there are likely to be demographic factors explaining variation in teens’ employment, as described in the Introduction. Multivariate analyses are used here, with five different models presented in Table 3.29
- Model 1 analyses whether teens are employed or not.
- Model 2 analyses whether teens work for an employer, versus working only informally or not at all.
- Model 3 analyses whether teens work informally, versus working for an employer or not at all.
- Model 4 focuses on those who are employed, analysing whether teens work for an employer versus working informally.
- Model 5 also focuses on those who are employed, analysing which teens work 10 hours or more per week.
We explore whether teen employment varies according to characteristics of the child and their family described in section 3.2. Each of the characteristics was included in the models, along with some interaction terms. One captured an interaction between gender and age, to reflect that girls’ employment participation increased with age more than boys’ (Figure 3.8). Another captured a finding that emerged concerning gender differences in how employment participation varied by the remoteness of areas (described below). Taking each of the variables in turn:
- Older teens were the most likely to be employed, and this was more so for older girls.
- Teens at 14 years were the most likely to be in informal work. This did not vary by gender.
- The probability of working for an employer increased with age, with older girls more likely than others to be working for an employer.
- Together, if focusing on just those in employment, being employed in informal work was most likely at 12–13 years, and least likely at 15 years.
- Among employed teens, the likelihood of working longer hours (10 or more per week during school terms) increases with age.
- Regional differences in teen employment were apparent, but boys in regional areas had different employment patterns compared to girls in regional areas:
- These regional differences reflected the likelihood of being employed in informal work, which was higher in outer or remote areas, especially for boys.
- In relation to working for an employer, gender differences were not significant, but teens were most often working for an employer (versus being not employed or only in informal work) in the outer regional areas, and least often doing so in the major city areas.
- Among those in employment, though, there was no general tendency for being employed in informal work versus working for an employer to vary across regions.
- Overall, teens in major city areas were the least likely to be employed. Those in outer or remote areas were the most likely to be employed, and this was most apparent for boys living in these regions.
Figure 3.8: Percentage of 14–15 year old boys and girls working in the previous 12 months, by age
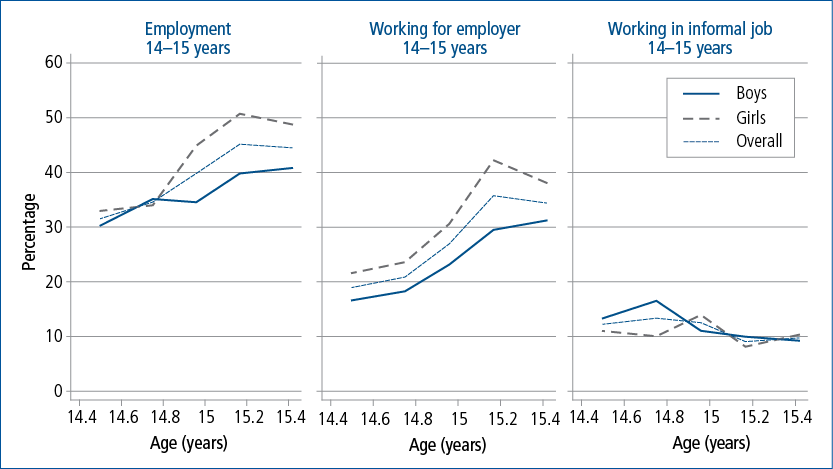
Notes: Ages of children were aggregated by creating quintiles of ages in months within each wave to ensure there was sufficient sample for each data point. The median of each quintile was used to label these data above. The smallest sample size was for girls in the quintile represented by a median age of 15.4 years (n = 253) and the largest sample size was for boys within the quintile with a median age of 14.4 years ( n = 460).
| Variable | Category | Whether worked (model 1) | Whether worked in informal employment (model 2) | Whether worked for an employer (model 3) | Of those employed, whether in informal work (model 4) | Of those employed, whether worked >=10 hours/ week (model 5) |
|---|---|---|---|---|---|---|
| Odds ratios | ||||||
| Gender and age | Girls (ref. = boys) | 1.16 | 1.04 | 1.28 | 0.75 | 1.18 |
| Age 14 years (ref. = 12–13 years) | 4.12*** | 1.73*** | 5.74*** | 0.33*** | 6.13*** | |
| Age 15 years (ref. = 12–13 years) | 4.72*** | 1.17 | 8.76*** | 0.15*** | 8.69*** | |
| Girls aged 14–15 years | 1.97*** | 1.39 | 1.70** | 1.12 | 1.43 | |
| Region (ref. = major city areas) | Inner | 1.16 | 0.89 | 1.26 | 0.65 | 1.00 |
| Outer or remote areas | 1.99*** | 1.49* | 1.97*** | 0.89 | 1.14 | |
| Boys in inner/outer/remote areas | 1.76** | 2.05*** | 1.32 | 1.60 | 1.51 | |
| Family socio-economic status (Ref. = 2nd & 3rd quartiles) | Lowest socio-economic status | 0.78* | 0.77 | 0.91 | 0.83 | 1.89** |
| Highest socio-economic status | 0.95 | 1.13 | 0.87 | 1.44* | 0.65 | |
| Culture and language | One or two Indigenous parents | 0.41** | 0.65 | 0.36** | 1.86 | 1.10 |
| One or two non-English speaking parents | 0.52*** | 0.68** | 0.49*** | 1.28 | 0.75 | |
| Parental employment | One or two employee parents | 1.13 | 0.71* | 1.68*** | 0.44*** | 1.22 |
| One or two self-employed parents | 2.65*** | 3.76*** | 1.40** | 3.66*** | 0.80 | |
| Constant | 0.07*** | 0.04*** | 0.02*** | 1.93* | 0.01*** | |
Notes: Based on random effects models, which allow for there being two observations per child. n = 6,837 observations for 3,506 families in models 1 to 3.
Models 4 and 5 only includes those employed – n = 2,013 observations for 1,590 families. *** p < .001; ** p < .01; * p < .05.
- Controlling for other characteristics, the family socio-economic status contributed little in explaining variation in teens’ employment, although:
- Teens were less likely to be employed in the lower socio-economic status families.
- If employed, teens in the lower socio-economic status families were the most likely to be working longer hours.
- Among employed teens, those from a higher socio-economic status family were more often employed in informal work, rather than employer work, compared to employed teens in families of moderate socio-economic status.
We also tested whether teens in single-parent families were more or less likely to be employed than those living in couple-parent families, once these other factors were taken into account. However, no significant differences emerged and this indicator was not retained in the final models.
- Significant differences were apparent according to the culture and language of parents.
- Teens were less likely to be employed if they had at least one Indigenous parent, or if they had at least one parent who mainly spoke a language other than English at home. This was most apparent in terms of teens from these families being less often employed by an employer compared to other teens. Also, teens with a non-English speaking parent were less likely than other teens to be employed in informal work.
- Finally, parental employment characteristics were explored.
- Findings were particularly marked for the indicator of having at least one parent in self-employment. These teens were more likely to be employed. The association was greatest in relation to teen’s employment in informal work but was apparent also in teens being employed by an employer. Among employed teens, those with a self-employed parent were more likely than other employed teens to be in informal work.
- Having a parent work as an employee was not in itself associated with the likelihood of teens’ employment but did increase the likelihood of these teens themselves working for an employer, and reduced their likelihood of working informally. Overall, among employed teens, those with an employee parent were less likely to be working informally than those without an employee parent.
We will return to some of these findings in the final section of this chapter.
3.7 Income and other reasons for teen employment
We expect that teens would largely be working in order to receive some income, for spending money or saving. However, given the significant amount of informal work undertaken by teens, it is worth exploring whether there are other factors contributing to teens’ reasons for employment.
First, we explore to what extent teens are paid for the work they do. Parents of employed teens were asked whether their teen received any income from wages or salaries at the time of the survey. Of all employed teens, 74% of 12–13 year olds and 85% of 14–15 year olds were said to receive some income from wages or salaries. Given that parents were asked specifically about wages and salaries, it is not surprising (as shown in Table 3.3) that this percentage was lower for those in informal work than those working for an employer. Those in informal work may not strictly speaking receive “wages or salary”, but instead be paid cash in hand, for example.
The average amount of weekly earnings is also shown in Table 3.3.10 This was $31 per week at 12–13 years, with the difference in incomes of those in informal employment and working for an employer not statistically significant. At 14–15 years, the average weekly earnings among employed teens was $77. Those working for an employer earned an average of $79 per week and those working informally earned an average of $66 per week. While it would be interesting to know the wage rate of employed teens, with these data it is not possible, since the work hours reported (usual work hours over the last 12 months) are not necessarily those that were worked in respect to the reported wages.
Notes: The average was calculated for those with an income greater than zero. Income is before income tax or anything else is taken out. Wave 5 income was adjusted by the CPI so that the estimates for ages 12–13 years and 14–15 years are in dollars as at 2014.
Notes: Financial also includes “to supplement family income”: numbers were not sufficient to show separately. # RSE > 25%.
If parents stated that their teen did not receive income from wages and salary, they were asked why this was. These reasons (captured as text responses) were grouped into categories.
- For some (19% of those not paid), non-receipt of wages reflected their no longer being employed.
- Another 25% of those not paid wages were said to receive casual incomes that were not considered to be wages or salary. This included being paid a token amount or paid cash in hand.
- Some parents said their teens’ employment reflected a contribution to a family business (24% of those not paid wages). Some noted that this was how teens earned parents’ financial contributions to specific costs, such as phone credits or special excursions.
- Another 13% were said to receive payment in kind.
- Some teens (11%) who did not receive wages were said to work for the experience, to help others or for the love of the work. For example, this included coaching work at a sports club.
Given that some teens actually do not receive income, or much income, for their employment, it may be that employment is sought for reasons other than income. Parents were asked why their teen had worked in the past 12 months. Table 3.4 shows:
- Across all employed teens, financial reasons were the reasons most often given for their employment (66% of employed 12–13 year olds and 80% of employed 14–15 year olds). Of those citing financial reasons, it was more often reported this was for spending money rather than saving up for something.
- Helping out in a family business was more commonly reported as a reason for working at 12–13 years compared to at 14–15 years.
- Working for friendship or to develop social skills was a reason for employment for girls at 12–13 years, but was less common for girls at 14–15 years or boys at either age.
At 14–15 years the teens themselves were asked their main reason for working. Their reasons are presented along with those of their parents in Table 3.5, tabulating responses according to whether teens were paid wages or salary for their employment.
- The distributions of reasons for working are quite similar for parents’ and teens’ reports.
- Not surprisingly, teens who were not paid wages or salary were less likely than those receiving some wages to cite financial reasons as their main reason for employment. Those not paid a wage or salary were more likely than those who were to say their main reason for working was to help in a family business.
- Around one in ten of those who were not paid wages or salary cited other reasons for working (according to parents’ or children’s reports). More detail was captured from those citing other reasons, and examination of this detail showed that teens’ work was often attributed to their enjoyment of the activity (e.g., enjoying walking the dog), their interest in gaining experience or acquiring certain skills (e.g., umpiring a sport), or their contribution to helping family or others (e.g., caring for siblings, helping friends, grandparents or neighbours).
Notes: Financial also includes “to supplement family income”: numbers were not sufficient to show separately. # RSE > 25%.
We explored whether teens’ income varied according to the reasons they gave for working. No significant differences were found at either of the ages.
Multivariate analyses were used to explore the above income data and reasons for working, to see whether financial reasons for employment were more common in certain families or among certain teens. We used the same set of variables as was used in analysing teens’ employment participation but omitted the interaction terms (between age and gender, and between remoteness and gender) as these were not statistically significant.
In Table 3.6, the analysis of which teens receive wages or salary is presented, along with analyses of which teens say they are working either for financial reasons, for contribution to a family business, or for other reasons.11 Some key findings are:
- Consistent with Table 3.4, receipt of wages or salary was more common for teens who worked for an employer, rather than working informally. Also, these teens were more likely than others to say their main reason for working was financial and less likely to give other reasons.
- Consistent with Table 3.5, those who received wages or salary were more likely than those who did not to report working for financial reasons.
- There were no differences by gender, but the oldest teens (aged 15 years) were the most likely to receive wages or salary. The teens at 14–15 years were more likely than at 12–13 years to cite financial reasons for working, and significantly less likely to cite other reasons. Working to contribute to a family business did not vary by age.
Notes: Based on random effects models, which allow for there being up to two observations per child. n = 2,013 observations from 1,590 families. Only employed teens are included. Reasons for employment are taken from parents’ reports. *** p < .001; ** p < .01; * p < .05.
- Teens living in major city areas were the most likely to be receiving wages and salary and to be working for financial reasons. Teens in inner or outer regional areas were significantly more likely than those in major city areas to be working to contribute to a family business. Teens in inner or outer regional areas were also significantly more likely than those in major city areas to select “other reasons”.
- Significant differences were not apparent for family socio-economic status or for family culture and language indicators.
- With respect to parental employment, the only significant finding was that when at least one parent was self-employed, the teen was more likely to report working to contribute to a family business.
3.8 Social emotional wellbeing and academic achievement of children according to employment at 14–15 years
The sections above have focused on how teen employment patterns vary according to some key socio-economic and demographic characteristics of families. It is likely, however, that other characteristics of the children themselves may lead to their decision to take up some employment. This has received some attention in research in the context of trying to disentangle how children’s employment is associated with different child outcomes, given the possibility of certain children selecting into employment. For example, this has been explored in relation to problem behaviours (e.g., delinquency, substance use and smoking) and to academic outcomes (e.g., early school drop-out). It is generally acknowledged that to capture whether teen employment causes such outcomes, the characteristics of children prior to the commencement of work need to be taken into account. The more rigorous studies therefore include, using a range of statistical techniques, some attention to this selection into employment, incorporating factors such as early involvement in delinquent activities and substance use, poor relationships with parents and low school engagement (Lee & Staff, 2007; Monahan et al., 2011; Paternoster et al., 2003).
It is beyond the scope of this chapter to explore how teen employment is associated with either problem behaviours or academic outcomes. However, the longitudinal nature of these LSAC data provides an opportunity to highlight some aspects of selection into employment by analysing some characteristics of children at younger ages according to their work status at 14–15 years. This is done here by looking at social-emotional wellbeing using the Strengths and Difficulties Questionnaire (SDQ) and academic achievement using NAPLAN test scores.
Figure 3.9: SDQ total difficulties and prosocial skills, boys and girls at 10–11 years, 12–13 years and 14–15 years according to work status at 14–15 years
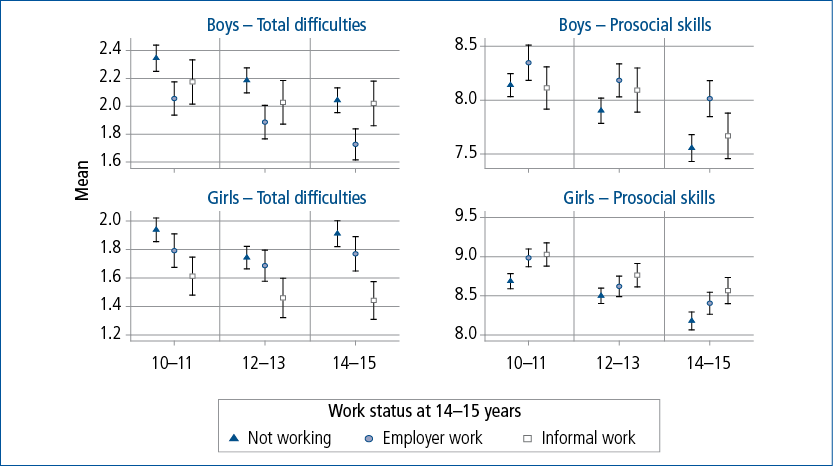
Note: The “I” bars represent 95% confidence intervals. “I” bars that do not overlap indicate there is a statistically significant difference between the groups.
The SDQ has been captured for children across multiple waves of LSAC, and here the responses of the child’s primary carer (usually the mother) are used, drawing on the responses captured at ages 10–11 years, 12–13 years and 14–15 years. The means of the total difficulties scale and the prosocial scale were compared for boys and girls at each age, according to whether teens were working for an employer, in informal work or not working at 14–15 years. Figure 3.9 shows that there are very different associations between work status and these SDQ means for girls and boys.
- For boys at all ages, the average total difficulties score was significantly lower for those working for an employer at 14–15 years compared to those who were not working at this age. The average total difficulties score for those in informal work at 14–15 years fell in between these two groups at 10–11 and 12–13 years. At 14–15 years, boys working for an employer had significantly lower total difficulties score, on average, compared to those who were not working at all or who were working informally.
- Also, boys working for an employer at 14–15 years had, on average, better prosocial skills compared to those not working at 14–15 years, although this was not statistically significant at 10–11 years. The average prosocial skills score did not differ statistically when comparing boys who were working in informal work at 14–15 years to those who were not working at this age.
- For girls, the average total difficulties score was lowest at all ages for those who were in informal work at 14–15 years, being statistically significant from the other groups at 12–13 and 14–15 years. The total difficulties score was highest, on average, for those who were not working at 14–15 years, but this was not significantly different from those working for an employer at 14–15 years.
- Findings for prosocial skills indicated that at 10–11, 12–13 and 14–15 years, girls who were not working at 14–15 years had the least developed prosocial skills, and those working informally the most developed. At 10–11 years, the mean prosocial score of those working for an employer at 14–15 years was similar to those in informal work at this age, while at older ages the mean prosocial skills score for this group tended to fall between those who were not working and those who were working informally.
The relatively high total difficulties scores and relatively low prosocial skills among the teens who were not working at 14–15 years may indicate that the boys and girls who are less socially adept may not be motivated to take up employment at this age.
The divergent findings for boys and girls and informal work could reflect that boys’ and girls’ informal work is different in nature, perhaps requiring different sets of social emotional skills. For example, this may be true if girls’ informal work is more people-focused (babysitting or coaching, for example) and boys’ work more focused on labouring or farm work. As occupation data is not available in LSAC, this could not be explored.
It is also possible that selection into informal jobs may arise through social connections or a family business. This might affect girls and boys in different ways, possibly leading to boys but not girls taking up labouring and farm work. Working for an employer, on the other hand, may more often reflect the choice of the boys and girls to take up a particular job.
Figure 3.10: Year 5, Year 7 and Year 9 NAPLAN results for boys and girls at 10–11 years, 12–13 years and 14–15 years according to work status at 14–15 years
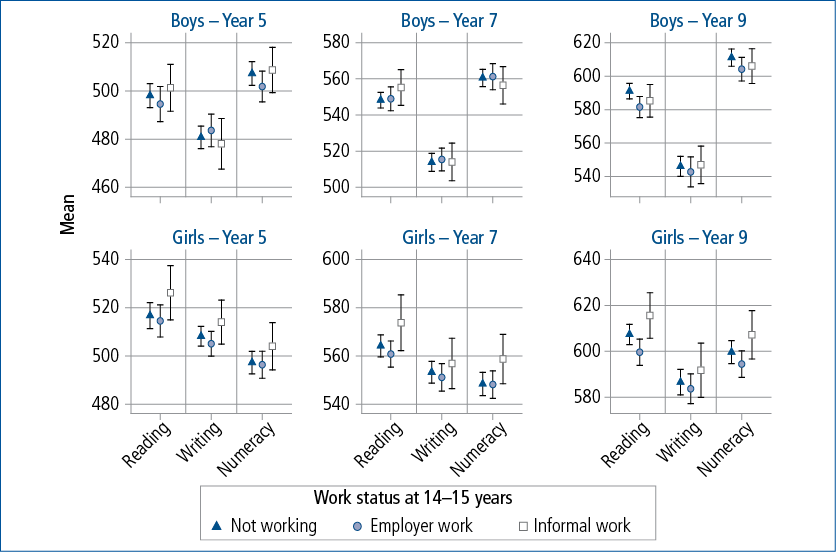
Note: The “I” bars represent 95% confidence intervals. “I” bars that do not overlap indicate there is a statistically significant difference between the groups.
Turning to information about academic achievement, Figure 3.10 shows children’s NAPLAN scores in reading, writing and numeracy at Years 5, 7 and 9 according to children’s work status at 14–15 years.12 The findings are presented separately for each year level, to allow the rescaling of the axis across years, given that the average test scores are higher at each year level. These findings actually show that academic results at earlier time points (Years 5 and 7) and at Year 9 were not significantly related to teens’ work status at 14–15 years. That is, there is no evidence from these data that being employed at 14–15 years, whether working in informal jobs or working for an employer, was associated with weaker or stronger academic skills. This suggests that it is factors other than academic ones that are related to teens’ employment at this age.
3.9 Summary and discussion
This chapter has explored the employment of teens at ages 12–13 years and 14–15 years, adding to existing research on student’s part-time employment in particular through the inclusion of information about employment among teens aged under 15 years. Below we summarise our key findings against each of the research questions, relating the findings also to the Australian (and some international) literature about teens’ employment.
How common is it for teens to work at 15 years and younger?
Overall, we found that 16% of teens at 12–13 years old and 39% at 14–15 years had worked at some time in the previous year. Given this broad reference period, it is not surprising that these estimates are higher than estimates for 15 year olds that refer to a more narrowly defined reference period, as in the ABS Census and Labour Force Survey. The figure for 14–15 year olds is similar to that derived from the 2009 LSAY cohort in year 9 (41%). Further, the estimate for 12–13 year olds appears consistent with the findings from the ABS Child Employment Survey, in which 11% of 10–14 year olds were said to have worked in the previous year.
We note that in defining “employed” teens as those who worked at some time in the past year, we have quite a diverse group, with some having worked very little of the past year, and some having worked for a majority of the time. Further, some worked very short hours in informal work, while others worked several days a week for wages. We focused much of the analyses on comparing teens in informal work to those working for an employer, in part because informal work is perhaps the type of employment that goes undetected in standard collections of labour force participation.
As we saw here, it is especially common among the younger teens to work in informal employment. As teens grow, and especially after they reach 15 years of age, it becomes more likely that employment will be for an employer rather than informal employment. In looking at which teens were employed, a significant factor was age, as it became more likely for teens to be employed as they grew older, with differences apparent even within the 14–15 year olds, with higher rates of employment among those aged 15 years.
Gender differences also reflected those observed in the ABS labour force and Census data, with higher rates of participation in employment by girls. This was especially apparent for the older girls and for participation in work for an employer. Biddle (2007), in commenting on the higher employment rate of teen girls compared to boys, suggested one reason for this could be a supply effect, with part-time jobs for students being common in those industries that employ more females than males. This remains untested though. Other differences between girls and boys, for example in their preferred patterns of time use or levels of social skills, may contribute to these differences in employment.
The ABS occupation data presented in section 3.3 showed that at 15 years many of the teens worked in sales jobs, in labouring work including kitchenhands and fast food cooks, and in service work including as waiters. Work that is perhaps more informal, or family-based, included child care (babysitting), as a sports coach or instructor, and as farm workers. There were gendered patterns, with girls more often in the sales jobs and child care and less often in the labouring jobs, compared to boys. Similar findings were observed in the occupations of children aged 5–14 years in the 2006 ABS survey, but fewer worked in sales and a greater proportion worked in a range of labouring jobs. Interestingly, in 2006, the most common of the labouring jobs for children was newspaper or pamphlet delivery.
We do not have more recent data on occupations to know how this has changed since 2006, but it may be that since then a new range of occupations has emerged for children to replace or supplement these occupations.
What are the work patterns of employed teens?
We looked at the question of when teens work from a number of perspectives, looking at work in term time and/or school holidays; work on weekends versus weekdays; times of day and the number of days and hours they work per week. There was variation in the findings by gender, by age and by employment type. Overall, teens at 14–15 years were considerably more likely than at 12–13 years to be working for an employer during term time for more than two hours per week.
At both ages, most teens did not spend a great deal of time during the week in employment. Employed teens worked an average of 2.9 hours per week at 12–13 years and 6.0 hours per week at 14–15 years, if we focus just on those who reported spending some time in work during the week in term times. Of those who worked during term time, just 3% of employed 12–13 year olds and 19% of employed 14–15 year olds worked 10 or more hours per week. The averages were higher for school holidays, at 6.7 hours at 12–13 years and 9.5 hours at 14–15 years. These averages were a little lower than those reported elsewhere (Anlezark & Lim, 2011), which may reflect that the LSAC estimates capture work over the last 12 months, rather than just around the time of the study.
Information about teens’ work days also suggested that for most, their time commitment to work is not very high during term times, with it being most common for teens to work one or two days per week, often involving a weekend day.
Teens who worked for an employer had different patterns of work compared to those working informally. Work for an employer more often involved school terms as well as school holidays, and more often involved weekdays during school terms. Among those working for an employer on weekdays of school terms, teens at 12–13 years most often worked straight after school hours, while at 14–15 years they worked over a greater spread of hours, with the peak being at 5–7pm. Informal work did not have the same peak at 5–7pm. The peak of work in the after-school hours was also observed in the ABS study of child employment.
Which teens are working?
In exploring this question, we also asked which teens were doing work for an employer, and which were working informally. Also, we analysed which teens were working 10 hours or more per term-time week.
According to these analyses, teens in outer regional or remote parts of Australia were more likely to be employed than those in major city areas. This reflected a higher incidence of employment in informal work as well as employer work, as was reported to be the case in the study set in NSW and SA, reported by Smith and Wilson (2002). We also found that boys in these outer and remote regional areas were more likely to be employed, and more likely to be employed in informal work, compared to girls in those regions. This may reflect the availability of certain types of informal work in those regions that better suits the interests or skills of boys than girls. For example, this might reflect boys’ participation in farming or labouring work.
We did not find strong differences in employment participation according to family socio-economic status but did find lower rates of employment in the lowest socio-economic status families, suggesting that teens were not necessarily taking up employment to help with costs of living. However, when those teens from lower socio-economic status families were employed, they were the most likely to be working 10 or more hours per week. We also found that among the employed teens, there was a higher likelihood of their being employed in informal work in the higher socio-economic status families, a finding that was similarly reported by Smith and Wilson (2002).
The findings concerning culture and language are consistent with those reported elsewhere (Biddle, 2007; Robinson, 1996; Smith & Wilson, 2002; Vickers et al., 2003), with lower rates of teen employment among teens of Indigenous parents or of parents who mainly speak a language other than English. These differences were most apparent in relation to the likelihood of working for an employer but there were significant findings also in relation to informal employment among teens whose parents speak a language other than English.
Not surprisingly, when either parent was self-employed, the teens were more likely to have worked in the previous year. This actually predicted higher rates of employment in informal as well as employer employment, but the association was stronger for informal work, such that among employed teens, those with a self-employed parent were more likely to be in informal work rather than working for an employer. If teens had a parent who was an employee, their probability of working for an employer was increased. In Biddle’s (2007) analysis of the census data, he found that teens were less often employed if they were from a jobless household, which he surmised might in part reflect these teens having more limited access to contacts who might help them to find a job. This was consistent with Smith and Wilson (2002)’s analysis of teens’ job search methods, which very often involved getting a job through a family member. Such an effect may apply here, given that those without a self-employed parent and without an employee parent are the least likely to be working.
Most of the demographic variables examined had the same association with teen employment, regardless of whether examining formal or informal work, but some variables had a stronger (or weaker) effect on one type of employment than the other, most notably age, gender and parents’ self-employment. The indicator of parents being an employee was the only variable in the analyses that predicted a higher rate of work for an employer but a lower rate of informal work.
Why are teens working? What are the financial gains to their employment?
To analyse why teens were working we first examined to what extent teens were paid for their work, as we were not certain that all informal work would involve wages in the way that would be the case for those working for an employer. This proved to be true, but also, as the employment information referred to work in the past year, some of the teens working for an employer also reported no earnings from that work, given that the job was no longer current, or because of the casual or sporadic nature of that employment.
Overall, 74% of the employed teens at 12–13 years and 85% at 14–15 years were said to receive a wage or salary. At both ages the percentage was lower (about 65%) for those in informal work. There were teens who reported to work for gains other than wages and salary, including those who were paid in kind, who worked for a family business for no direct payment (but parents sometimes said their work was their way of earning parents’ payment of child-related expenses), or who worked for the experience or the love of the activity.
We examined which employed teens were likely to have wages or salary from their employment, and the main factors were teens’ age (being 15 years old) and working for an employer (versus working informally). There was also a slightly lower probability of receiving wages among teens who lived in outer or remote regional areas, compared to major cities.
When we looked at reasons for teens’ employment, then, consistent with other research (ABS, 2007; Robinson, 1999), financial reasons were the predominant reasons for teens to be employed, according to their parents and themselves. Teens who were reported to earn wages or salary, or who worked for an employer, were the most likely to be working for financial reasons. Also, teens at 14–15 years were more often working for financial reasons compared to teens at 12–13 years. The only other demographic factor predicting that teens would be working for financial reasons was region of residence, with this being most likely in major city areas, and less likely in inner or outer regional and remote areas.
Another reason some teens gave for working was that they were contributing to a family business. This was significantly more likely in the inner and outer regional and remote areas. It was especially likely when teens worked informally, and in families in which there was at least one self-employed parent.
Other reasons nominated by teens included working for friendship or to develop social skills, to improve career prospects or other reasons, which captured such things as enjoyment of the activity, interest in acquiring skills or helping others. This was most often given by those who did not receive a wage or salary, who worked informally, and for teens at 12–13 years. Further, it was most likely for teens living in inner and outer regional and remote areas.
The average amount that employed teens receive for their employment was $31 per week at 12–13 years and $77 per week at 14–15 years. Incomes were higher at 14–15 years, compared to at 12–13 years, for those doing employer work as well as those doing informal work.
How does social emotional wellbeing and academic achievement vary according to teens’ employment at 14–15 years?
A significant challenge for research exploring links between teens’ employment and academic or behavioural outcomes is that employed teens may have pre-existing characteristics or traits that lead them to select into employment, such that the “outcomes” of teen employment may be a factor of those pre-existing factors rather than the employment itself. Using the LSAC data from previous waves we explored here whether such selection effects were apparent according to children’s work status at 14–15 years, focusing on social emotional wellbeing and academic results.
There were some interesting differences for aspects of children’s social emotional wellbeing, in which we found that boys and girls who were not working at 14–15 years already had more symptoms of social emotional difficulties at younger ages. This suggests that children with those characteristics may select out of employment at 14–15 years. There were different findings, however, for boys and girls when looking at the characteristics of teens employed in informal work, which we suggest may be related to informal work being different for boys and for girls. For example, girls in informal work tended to have the lowest total difficulties score. This work may involve jobs such as babysitting and coaching, which might attract girls who are more confident and have better-developed social skills. For boys, the lowest scores on these scales were for boys working for an employer, not those working informally, suggesting different selection effects were in operation. However, as we do not have information on the occupations of these employed teens, it is difficult to interpret these gendered patterns.
The equivalent analysis of children’s academic results according to employment at 14–15 years found no significant differences. This indicated that factors other than academic ones are more prevalent in explaining the selection into employment at this age.
These findings suggest some selection effects may be operating, and it will be interesting to test this further once the teens are 16–17 years, when more are expected to be working.
Concluding comments
Overall, these LSAC data have provided a picture of employment among teens at 12–13 years and 14–15 years. The availability of information for the teens at the younger age was especially valuable given that employment information is typically only collected for 15 years and older. Following these teens’ employment pathways into the future will be an important focus with these LSAC data.
Much research on teens’ employment has concentrated on the possible consequences of their work on their later school and employment outcomes. As discussed, this research is fraught with methodological challenges given that the selection into employment by children of different characteristics needs to be taken into account. Exploring these associations using the longitudinal nature of LSAC will be an important focus of later research with these data. As well as taking account of selection effects, it will be important to take account of the nature of the work that teens do at different points in their school life. Clearly there were large changes from 12–13 years to 14–15 years in the types and amount of work done. Even among those working for an employer at 14–15 years, teens usually did not spend a very large amount of time in their employment.
With the existing LSAC data the multivariate analysis could be extended to consider whether teens with certain personal characteristics (such as those with different levels of academic motivation, differences in social emotional wellbeing, or physical health) are more or less likely to be employed. More information about teens’ location could be incorporated, as local area characteristics may contribute to the degree to which teens have opportunities to work in different jobs. Given the differences in employment of boys and girls observed here, considering whether personal, family or regional factors affect employment participation in the same way for each sex would be worth exploring.
We could not answer all questions about teens’ employment with these LSAC data, but it is clearly an important area of research, given that a significant proportion of school students in the later years of secondary school are undertaking some employment. This work may provide financial benefits and useful opportunities for development of social and other skills, as well as providing insights on being in employment. However, for those working a greater number of hours, it may pose challenges for their education. Continuing to build the evidence base on how employers and families can support teens to ensure their work experience is a positive one continues to be important.
3.10 References
Anlezark, A., & Lim, P. (2011). Does combining school and work affect school and post-school outcomes? Longitudinal surveys of Australian youth. Adelaide: National Centre for Vocational Education Research.
Australian Bureau of Statistics. (2007). Child employment, June 2006 (No. 6211.0). Canberra: ABS.
Biddle, N. (2007). The labour market status of Australian students: Who is unemployed, who is working and for how many hours? Journal of Education and Work, 20(3), 179–209.
Hussmanns, R. (2004). Statistical definition of informal employment: Guidelines endorsed by the seventeenth international conference of labour statisticians (2003). Paper presented at the 7th Meeting of the Expert Group on Informal Sector Statistics (Delhi Group).
Lee, J. C., & Staff, J. (2007). When work matters: The varying impact of work intensity on high school dropout. Sociology of Education, 80(2), 158–178.
Marsh, H. W. (1991). Employment during high school: Character building or a subversion of academic goals? Sociology of Education, 172–189.
Marsh, H. W., & Kleitman, S. (2005). Consequences of employment during high school: Character building, subversion of academic goals, or a threshold? American Educational Research Journal, 42(2), 331–369.
Monahan, K. C., Lee, J. M., & Steinberg, L. (2011). Revisiting the impact of part-time work on adolescent adjustment: Distinguishing between selection and socialization using propensity score matching. Child development, 82(1), 96–112.
Paternoster, R., Bushway, S., Apel, R., & Brame, R. (2003). The effect of teenage employment on delinquency and problem behaviors. Social forces, 82(1), 297–335.
Robinson, L. (1996). School students and part-time work. (LSAY Research Reports, Longitudinal surveys of Australian youth research report no. 2). Melbourne: ACER.
Robinson, L. (1999). The effects of part-time work on school students. (LSAY Research Reports,Longitudinal surveys of Australian youth. Research report no. 9). Melbourne: ACER..
Schoenhals, M., Tienda, M., & Schneider, B. (1998). The educational and personal consequences of adolescent employment. Social forces, 77(2), 723–761.
Smith, E., & Wilson, L. (2002). The new child labour? The part-time student workforce in Australia. Australian Bulletin of Labour, 28(2), 120–137.
Stern, D., & Briggs, D. (2001). Does paid employment help or hinder performance in secondary school? Insights from us high school students. Journal of Education and Work, 14(3), 355–372.
Vickers, M., Lamb, S., & Hinkley, J. (2003). Student workers in high school and beyond: The effects of part-time employment on participation in education, training and work (LSAY Research Reports, Longitudinal surveys of Australian youth research report no. 30). Melbourne: ACER.
1 See <workplaceinfo.com.au/resources/employment-topics-a-z/child-employment-laws>.
2 See <www.lsay.edu.au/popups/cohort_table.php?info=2009_3_1&filter1=0&filter2=0>. Overall, 17% had not stated their labour force status. They are excluded from the calculation.
3 ABS (2016). Labour Force, Australia (Catalogue 6202.0). Table 15. Labour force status for 15–24 year olds by Educational attendance (full-time) and Sex. Downloaded 11 May 2016. Data for single year ages is not published from the labour force survey.
4 Derived from the ABS 2011 Census one per cent Confidentialised Unit Record file.
5 See reference cited in footnote 1.
6 The definition of informal employment that is endorsed by international agencies encompasses the types of work these teens are likely to be doing in their employment for someone other than an employer. The accepted definition includes, for example, “own-account workers and employers employed in their own informal sector enterprises” and “contributing family workers” (Hussmanns, 2004). In the paper by Smith and Wilson (2002), informal work included children working for themselves or “other paid work”, not including paid work for an employer.
7 At 14–15 years the children were asked if they had worked in the previous 12 months, and their reports were largely consistent with those of the parents. According to the child-reported data at age 14–15 years, 40% had worked, with a significantly higher percentage for girls (43%) than boys (38%).
8 According to the internationally-agreed definition of informal employment (see Hussmanns, 2004), some of the teens working for an employer may also be working informally, for example if they are receiving goods or services in kind, rather than being paid wages. This is not taken into account here, but the receipt of wages is analysed in section 3.7.
9 Models 2, 3 and 4 explore differences in predictors of working for an employer, informally or not working. A multinomial logistic regression model could also be used for this, but the coefficients are difficult to interpret, and so we presented a series of logistic models instead. Odds ratios are reported, so that values above 1 represent a positive influence and values below 1 represent a negative influence.
10 When children were aged 12–13 years about 89% of parents reported an income for those who were said to have a wage or salary. At 14–15 years, the percentage was lower at 77%. Calculations of mean incomes exclude those with missing income data who were said to receive wages or salary. Wave 5 income was adjusted by the CPI so that the estimates for age 12–13 years and 14–15 years are in dollars as at 2014.
11 Random effects logistic regression models were estimated. The first model is for a binary variable of whether teens receive income (wages or salary) from their employment. The other three are also models for binary variables, which capture whether or not teens selected a particular main reason for working. While this is better modeled with multinomial logistic regression, to capture that three response category groups are possible, three separate logistic regression models is a simpler way to present the associations.
12 For most children, the Year 9 tests were undertaken in the months after the Wave 6 interviews.
Share


