9. Kids' care and activities before and after school
9. Kids' care and activities before and after school

Working parents often have to juggle family and work responsibilities, including organising different types of care for their children while they are at work. Once children reach school age, care before or after school hours is an important resource for families. The availability of care for school-aged children outside-school-hours has had a significant impact on labour market outcomes of parents over time (Malcolm, Wilson, & Davidson, 2002), and many parents state they would not be able to work if these services were not available (Winefield et al., 2011). Characteristics of the school may also play an important role, as different types of schools may provide different services to parents.
This chapter explores parents' use of formal and informal care before or after school and how this varies according to children's age and family and school characteristics. We also explore children's participation in extracurricular activities provided by the school and other organisations. For some families these may be a substitute for outside-school-hours care.
9.1 What types of formal and informal care are parents using?
Box 9.1 Formal and informal care
In this chapter, we focus on children in the B cohort of LSAC, who were still in primary school in Wave 6 (in 2014). In Waves 4-6 of LSAC, when the B cohort children were aged 6-7, 8-9 and 10-11, the study child's primary carer was asked detailed questions about the types of child care and extracurricular activities their child attended.
In terms of outside-school-hours care, parents were asked, 'Who currently provides care for the study child before school?' A number of formal and informal types of care were listed (see Table 9.1) and parents could select multiple answers. A similar question was asked about after-school care arrangements.
Formal care is regulated care away from the child's home (Australian Bureau of Statistics [ABS], 2017). The main types of formal care are long day care, before and after school care, family day care and occasional care.
Informal care is non-regulated care either in the child's home or elsewhere. It includes paid or unpaid care by siblings, grandparents, other relatives, friends, neighbours, nannies or babysitters and other organisations such as crèche services at gyms and health centres (ABS, 2017).
Previous Australian research has shown that, for school-aged children:
- Informal before- and after-school-hours care is more commonly used than formal care (ABS, 2017).
- Formal outside-school-hours care programs are more frequently attended by children in the early years of primary school, compared to children aged 10 and older (ABS, 2010; Capizzano, Tout, & Adams, 2000).
- Grandparents are the most commonly used source of informal before- and after-school-hours care (ABS, 2014; Cassells & McNamara, 2006).
The LSAC data confirm that informal outside-school-hours care was more frequently used than formal care, with almost one in four children in informal care either before or after school; and the percentage of children attending formal care decreasing from 18% at age 6-7 to 11% at age 10-11 (Table 9.1).1 Still, from age 6-7 to age 10-11, around two-thirds of children did not attend any formal or informal outside-school-hours care. This suggests that many parents arranged their work commitments so that their children did not require regular outside-school-hours care.
Across all ages, grandparents were the most common providers of informal before or after school care, with 13-14% of children being cared for by their grandparents. A smaller proportion of children were cared for by people other than their grandparents. There were some differences in the percentages of children receiving particular types of informal care, according to their age. For example, around 5% of 10-11 year olds, but less than 2% of 6-7 year olds, were cared for by a sibling under the age of 18.
Note: As some families use more than one type of formal and/or informal care arrangement, the percentage who used each specific type of care does not sum to the percentage who used any formal/informal care.
Source: LSAC Waves 4-6, B cohort, weighted
9.2 Outside-school-hours care, by family structure and parents' employment arrangements
Family characteristics, particularly family structure and parents' working hours, are important determinants of children's care arrangements (e.g. Capizzano et al., 2000). However, for some families, the availability of suitable formal care and the child's willingness to attend care can influence parents' work arrangements. Previous research has shown that mothers of school-aged children generally have more responsibility for the care of the children than fathers do (De Vaus, 2004); and that mothers often stay out of the labour force or alter their working hours to care for their children (Hand & Baxter, 2013). It has also been found that children are more likely to be in care when both parents work full-time or a single parent works full-time (Capizzano et al., 2000).
Most LSAC study children live with two parents (Table 9.2). Among children in couple households, the most common parental employment arrangement was one in which the father worked full-time and the mother worked part-time. The next most common arrangement was that of a father working and the mother not in paid employment, although this became less common as children got older, with 27% of parents having this arrangement when the study child was aged 6-7, compared to 19% when the study child was aged 10-11.
Around 15% of 6-7 and 8-9 year olds and 17% of 10-11 year olds lived in single-mother households. At least half of the children in single-mother households had a mother who was in paid employment, with around one-third of single mothers working part-time, and the percentage of single mothers in full-time work increasing from 16% of mothers when their children were 6-7 years old, to 27% when their children were aged 10-11.
Across all age groups, around 1% of LSAC children were living in single-father households; and among those in single-father households, most had a father who was employed.
Children living with a single mother working full-time were the most likely to be in either formal or informal before or after school care (Figure 9.1). Almost 90% of 6-7 year olds in single-mother households where their mother worked full-time were in some type of outside-school-hours care. With 56% going to informal care and 47% attending formal care, it seems many children in single-parent households attend both formal and informal care. At age 10-11, around 60% of children in single-mother families where their mother worked full-time were in informal outside-of-school-hours care and only around 20% were in formal care.
Notes: Employed mothers who are on leave or otherwise absent from work are classified as 'not working'. Categories based on hours worked (full-time = 35+ hours). 'Father working less than full-time' includes fathers not working. Over 90% of fathers in the 'father working any hours, mother not working' group work full-time. The number of observations of children in single-father households was too small for reliable estimates of fathers' employment status.
Source: LSAC Waves 4-6, B cohort, weighted
Among children in single-mother households where their mother worked part-time, 58% of 6-7 year olds (in 2010) attended some type of before or after school care, with 36% in informal care and 34% attending formal care. At age 10-11, 45% of children in single-mother households where their mother worked part-time attended some type of outside-school-hours care, with 33% in informal care and 20% in formal care.
Compared to children in couple families where one or both parents did not work full-time, children in couple families where both parents were in full-time employment more commonly attended outside-school-hours care. Among children with two parents working full-time, 68% of 6-7 year olds, around 60% of 8-9 year olds and over half of 10-11 year olds attended some type of before- or after-school-hours care.
These figures suggest that a considerable percentage of families (30-40%) where parents worked full-time were able to balance work and family responsibilities without the use of regular formal or informal child care. In some families, this is likely to have been achieved through flexible work arrangements, shift work, self-employment or a combination of these job characteristics.
Across all age groups, around 40% of children in two-parent households where both parents worked full-time received informal outside-school-hours care. The percentage of children with two parents working full-time who attended formal before or after school care declined as children got older - from 37% of 6-7 year olds to 22% of 10-11 year olds.
Compared to children in couple households where both parents worked full-time, and children in households with a working single mother, children in all other family types were less likely to be in outside-school-hours care. For example, across all age groups, less than 5% of children in couple households where their father was in paid employment (but their mother was not) attended formal outside-school-hours care.
Figure 9.1: Formal and informal outside-school-hours care, by household structure and parents' employment arrangements
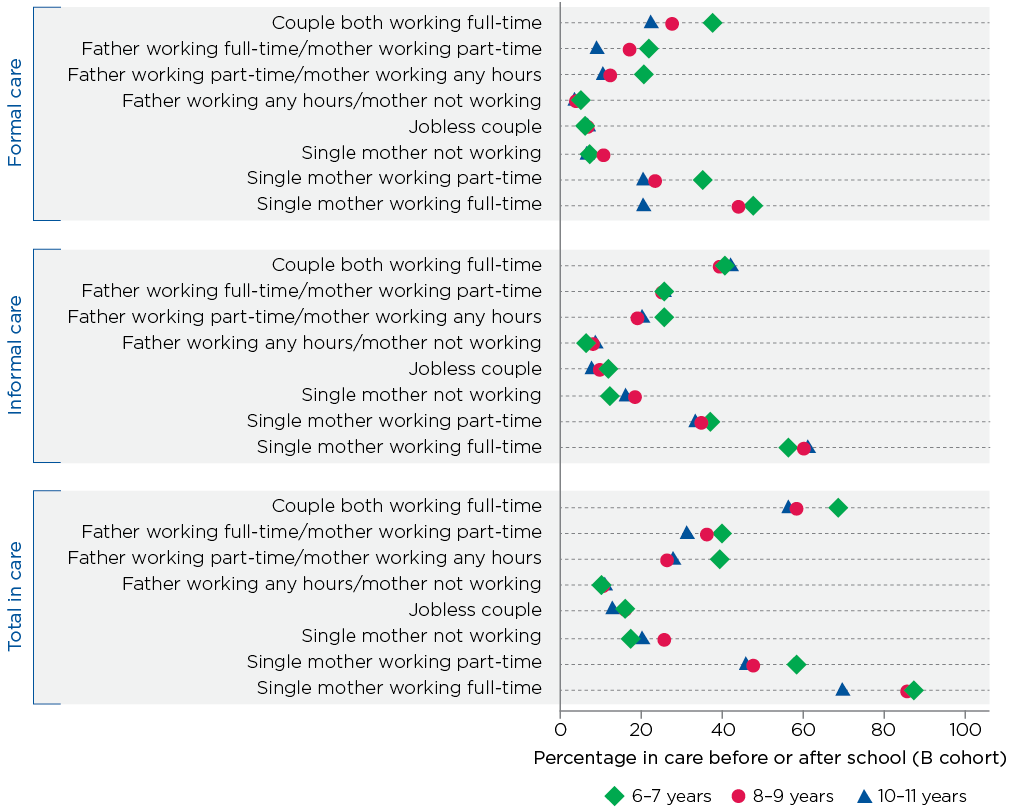
Notes: Employed mothers who are on leave or otherwise absent from work are classified as 'not working'. Categories based on hours worked (full-time = 35+ hours). 'Father working less than full-time' includes fathers who are not employed. Care arrangements for single-father households and 'other' household types are not presented due to the small number of observations.
Source: LSAC Waves 4-6, B cohort, weighted
9.3 Factors associated with attendance at outside-school-hours care
Aside from household structure and parents' employment arrangements, a number of other family and school characteristics, such as household income and school sector, are associated with children's participation in school-based outside-school-hours care. For example, some schools may provide more options in terms of before or after school care and extracurricular activities than others; and higher income households are likely to have a wider range of choices in terms of the type of school their children attend, outside-school-hours care and extracurricular activities.
Note: Random effects logistic regression. * p < .05; ** p < .01; *** p < .001.
Source: LSAC Waves 4-6, B cohort, unweighted
The LSAC data show that, after accounting for a range of school and family characteristics, there are significant differences in the odds of a child attending formal outside-school-hours care, depending on their family structure and their parents' employment arrangements (Table 9.3). For example, compared to children in two-parent households where both parents work full-time, the odds of a child attending formal before- or after-school-hours care are:
- more than doubled among children in single-mother households where their mother works either full-time or part-time
- reduced by more than 60 percentage points for children in couple households where the father works full-time and the mother works part-time, and in couple households where the mother is in paid employment (either full- or part-time) and the father does not work full-time
- reduced by over 90 percentage points among children in couple households where the father is employed and the mother is not in paid work
- reduced by 81 percentage points for children in couple households where neither parent is in paid employment.
Household income was also an important factor associated with attendance at formal outside-school-hours care. After accounting for other characteristics of the household, including household structure and parents' work arrangements, compared to children living in households in the lowest third of the equivalised household income distribution, the odds of attending formal outside-school-hours care were tripled among children living in households in the middle third, and 7.4 times higher for children in households with the highest equivalised incomes.
There were also significant differences in attendance at outside-school-hours care according to the type of school the child was attending and aspects of the child's household, including whether they lived in a regional or metropolitan area, the age of the study child, and whether they had older or younger siblings:
- Compared to children attending a government school, the odds of attending formal outside-school-hours care were halved for those attending an independent school.
- Compared to children living in metropolitan areas, the odds of attending formal outside-school-hours care were 68 percentage points lower among those living in non-metropolitan areas.
- Compared to children without older siblings, the odds of attending formal before- or after-school-hours care were reduced by almost 70 percentage points for those who did have an older brother or sister; and compared to children who had no younger siblings, the odds of attending formal outside-school-hours care were reduced by 23 percentage points for those with a younger brother or sister.
- The odds of attending formal outside-school-hours care were significantly lower for older children compared to younger children. Compared to when the study children were aged 6-7 (in 2010), the odds of attending formal outside-school-hours care were halved for 8-9 year olds and reduced by almost 80 percentage points for children aged 10-11.
Matched school ICSEA data were only available for B cohort children at ages 6-7 and 8-9.2 When the model was run for this subgroup with the ICSEA measure included, the estimates of the association between parental employment and participation in formal outside-school-hours care were similar to those in Table 9.3. The level of educational advantage of the child's school was also an important predictor. Compared to children attending a school in the lowest third of the national ICSEA distribution, the odds of attending formal outside-school-hours care were tripled for children who went to a school in the middle third of the ICSEA distribution, and 4.8 times higher for those in the highest third.
9.4 Participation in extracurricular activities
Most children aged 6-11 years old participated in some type of extracurricular activity (Table 9.4). Participation in extracurricular activities was slightly less common among younger children, with 83% of 6-7 year olds (in 2010) participating in at least one extracurricular activity, compared to around 90% of 8-9 and 10-11 year olds.
Participation in extracurricular activities provided by the school was also more common among older children, with 22% of 6-7 year olds in 2010 attending these activities, compared with 42% of 8-9 year olds in 2012 and 46% of 10-11 year olds in 2014. Overall, the most common school-provided extracurricular activities were art, music or performance classes and team sports.
In terms of extracurricular activities provided by organisations other than the child's school, individual sports were most popular, followed by team sports and then art, music or performance classes. While participation in school-provided team sports increased considerably as children got older, the percentage of children participating in outside-school team sports remained quite steady, at around 34-39% between the ages of 6-7 and 10-11. However, the percentage of children participating in outside-school individual sports was higher among younger children, with 47% of 6-7 year olds in 2010 participating in an individual sport activity that was not provided by the school, compared to 39% of 10-11 year olds in 2014.
Box 9.2: Extracurricular activities
Parents were asked, 'In the last 12 months, has the study child regularly participated in any of the following activities?':
- community group or club (e.g. scouts, guides or cultural group)
- team sport (e.g. football, cricket or netball)
- individual sport, coached or lessons (e.g. swimming, tennis, karate or gymnastics)
- art, music or performance lessons (e.g. piano, dance, choir or drama)
- classes to improve academic skills (e.g. remedial reading or extra tutoring)
- classes to learn new skills (e.g. computing or learning another language)
- religious services or classes
- other activities.
In Waves 3, 4 and 6, the following definition of 'regular' was provided: 'Regular means at least once a week, for three months or more; for example, a sports season.'
In Waves 3 and 4, parents were told to exclude activities done as part of the child's normal outside-school-hours care.
Parents were also asked whether the activity was provided by the child's school.
The percentage of children participating in outside-school religious classes remained steady as children got older, with 12% of 6-7 year olds, and 11% of 8-9 and 10-11 year olds attending these classes. On the other hand, participation in outside-school academic classes increased from 3% of 6-7 year olds to almost 10% of 10-11 year olds; and involvement in community groups increased from 6% of 6-7 year olds to 12% of 10-11 year olds.
Note: As some children participate in more than one extracurricular activity, the percentage who participated in each specific activity does not sum to the percentage who engaged in any extracurricular activity.
Source: LSAC Waves 4-6, B cohort, weighted
9.5 Extracurricular activities, by household structure and parents' employment arrangements
Across all age groups a higher percentage of children in couple families with a working mother and a father employed full-time participated in extracurricular activities (over 90%) compared with children in families with other household structures and parental working arrangements (Figure 9.2).
Children with single mothers who were not in paid employment and children in jobless couple families were the least likely to attend extracurricular activities provided by either the school or by other organisations. At age 6-7, the gap in participation between children living in jobless households and children whose parents were employed was larger for activities provided by other organisations than for activities provided by the school. For example, 24% of 6-7 year olds in couple households where both parents worked full-time attended a school provided extracurricular activity, as did 24% of children in couple households where neither parent was in paid employment, and 19% of children in single-mother households where the mother was not employed.
However, 83% of 6-7 year olds in couple households where both parents worked full-time attended a non-school provided extracurricular activity, compared to 61% of those in couple households where neither parent was employed and 54% of 6-7 year olds in a single-mother household where their mother was not in paid employment.
Figure 9.2: Extracurricular activities, by household structure and parents' employment arrangements
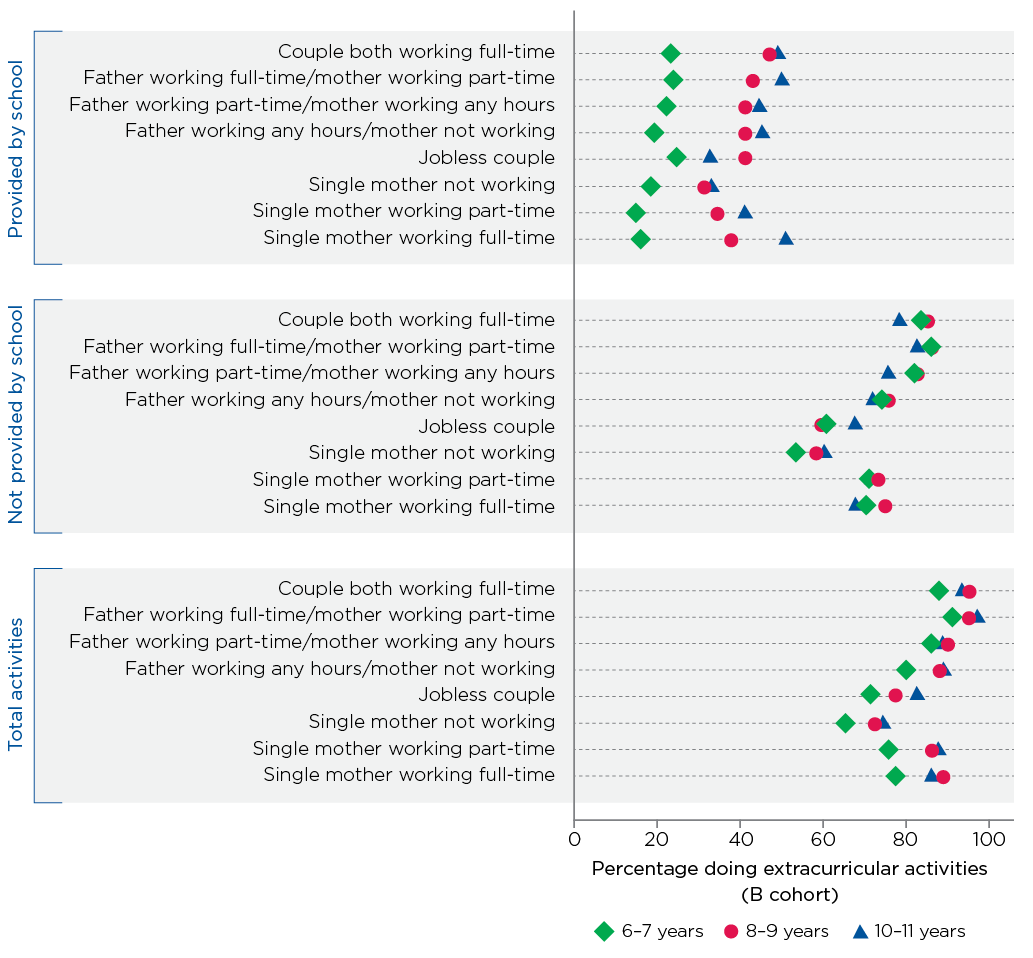
Notes: Employed mothers who are on leave or otherwise absent from work are classified as 'not working'. Categories based on hours worked (full-time = 35+ hours). 'Father working less than full-time' includes fathers who are not employed. Extracurricular activities for single-father households and 'other' household types are not presented due to the small number of observations.
Source: LSAC Waves 4-6, B cohort, weighted
9.6 Characteristics associated with participation in extracurricular activities
While household structure and parents' employment arrangements are the main predictors of children's attendance at school-based outside-school-hours care, there are likely to be other characteristics of the child, their family and the school they attend that are associated with whether or not they participate in extracurricular activities provided either by their school or by other organisations.
After accounting for the age of the study child, as well as characteristics of their household and the school that they attended, there were no significant differences in the odds of a child attending school-provided extracurricular activities according to their household structure or parents' work arrangements (Table 9.5).
Note: * p < .05; ** p < .01; *** p < .001.
Source: LSAC Waves 4-6, B cohort, unweighted
However, compared to children in two-parent households where both parents work full-time, the odds of a child participating in an extracurricular activity that is not provided by the school were:
- 1.3 times higher for children in two-parent households where the father worked full-time and the mother worked part-time
- almost halved for children in single-mother households in which the mother was not in paid employment and reduced by almost 40 percentage points for children in two-parent households where neither parent was in paid work
- reduced by 28 percentage points for children in single-mother households where their mother worked full-time
- reduced by almost 70 percentage points for children in single-father families.
While the odds of attending outside-school-hours care were significantly lower for older children compared to younger children, the odds of participating in a school-provided extracurricular activity increased considerably as children got older. Compared to when the study children were aged 6-7, the odds of participating in a school-based extracurricular activity were almost tripled when they were aged 8-9; and 3.8 times higher for 10-11 year olds. However, the opposite is true for non-school provided extracurricular activities, compared to when the study children were aged 6-7, the odds of participating in a non-school-based extracurricular activity were reduced by 30 percentage points at age 10-11.
As was the case with formal outside-school-hours care, household income was an important factor related to participation in extracurricular activities. Compared to children living in households in the lowest third of the equivalised household income distribution, the odds of participating in a school-provided extracurricular activity were 1.5 times higher, and the odds of participating in a non-school-provided activity were 3.2 times higher among children living in households in the highest third of the equivalised income distribution.
Compared to children who attended a government school, the odds of participating in a school-provided extracurricular activity were doubled for children who went to a Catholic school and almost 3 times higher for children who went to an independent school. On the other hand, while the odds of participating in a non-school-provided extracurricular activity were 1.7 times higher among children who attended a Catholic school, compared to those who attended a government school, children who went to an independent school were less likely to participate in non-school-provided extracurricular activities. This may be because independent schools generally provide a wider range of extracurricular activities than government and Catholic schools do, so parents with children in independent schools are less likely to substitute school-provided extracurricular activities for formal outside-school-hours care and non-school-provided activities.
Availability of activities is also a factor for children living in non-metropolitan areas, with the odds of attending a school-provided extracurricular activity 16 percentage points lower for children who lived in a non-metropolitan area, compared to those in metropolitan areas.3
Summary
This chapter provides new insights on school-aged children's before- and after-school care arrangements and extracurricular activities. Overall, informal care was more frequently used than formal care. While formal arrangements were more frequent among younger children, a higher proportion of older children (aged 10-11) were in informal care. Grandparents were the most common type of informal care for 6-11 year olds, while school-based programs were the most common formal care arrangement.
Most LSAC children aged 6-11 years participated in extracurricular activities, either provided by the school or provided by other organisations. The most popular school-provided activities were team sports and art, music or performance classes; while the most popular activities provided by other organisations were individual sports and team sports.
Family structure and parents' working arrangements were important factors associated with attendance at before- or after-school-hours care, with families where parents worked more hours (a single mother working full-time or couple both working full-time) making the most use of formal or informal before- or after-school care. Children in working couple families were the most likely to participate in extracurricular activities; and the lowest participation rates were among children with parents who were not in paid employment.
Participation in extracurricular activities was much more common than attendance at informal or formal outside-school-hours care. This finding suggests that for most children, extracurricular activities are done for enjoyment, to keep fit and healthy or, in the case of academic classes, to improve the child's school outcomes.
The economic resources of the family were also relevant to children's participation in outside-school-hours care and extracurricular activities, with children in higher income families being more likely to participate in formal care and extracurricular activities.
Children attending government schools were more likely to attend outside-school-hours care programs and less likely to participate in extracurricular activities provided by the school, compared with children attending independent schools. On the other hand, compared to children in government schools, children attending independent schools were less likely to participate in extracurricular activities that were not provided by the school. It is possible that, on average, independent schools offer more opportunities for extracurricular activities than government schools.
The level of educational advantage of schools (ICSEA) was also relevant, with children in schools with lower educational advantage being less likely to attend outside-school-hours care and also less likely to participate in extracurricular activities (provided either by the school or other organisations), even after accounting for their family's economic resources. This suggests that school resources matter when it comes to programs offered to families. The increased availability of affordable extracurricular activities (either at school or outside of school) for children in disadvantaged communities may help close the gap between the experiences of children living in disadvantaged communities and those who are not.
References
Australian Bureau of Statistics (ABS). (2017). Australian social trends. Canberra: ABS.
ABS. (2017). Childhood education and care. Cat. No. 4402.0. Canberra: ABS.
Australian Curriculum, Assessment and Reporting Authority (ACARA). (2012). Guide to Understanding ICSEA. Sydney: ACARA. www.acara.edu.au/verve/_resources/guide_to_understanding_icsea.pdf
Capizzano, J., Tout, K., & Adams, G. (2000). Child care patterns of school-age children with employed mothers (41). Washington DC: Urban Institute.
Cassells, R., & McNamara, J. (2006). Before and after school care: Costs and usage of formal child care services for school age children, 1999 and 2002. Paper presented at the International Women and Leadership Conference: Changes, challenges and choices, Fremantle.
Cassells, R., & Miranti, R. (2012). Outside school hours care: Social gradients and patterns of use. Sydney: UnitingCare.
De Vaus, D. (2004). Diversity and change in Australian families: Statistical profiles. Melbourne: Australian Institute of Family Studies.
Hand, K., & Baxter, J. (2013). Maternal employment and the care of school-aged children. Australian Journal of Labour Economics, 16(3), 329-349.
Malcolm, H., Wilson, V., & Davidson, J. (2002). Out of school care: A brief review of the literature. Edinburgh: Scottish Council for Research in Education.
Winefield, H., Piteo, A., Kettler, L., Roberts, R., Taylor, A., Tuckey, M. et al. (2011). Australian parents' needs and expectations regarding out of school hours care: A pilot study. Journal of Early Childhood Research, 9(3), 196-206.
1 The analysis presented here combines before and after school care, as the number of children in care before school was relatively small. Overall, 12% of all LSAC study children aged 6-11 had a non-parental care arrangement before school, with 8% in informal care and 4% in formal care. In contrast, 30% of children were in non-parental care after school.
2 Index of Community Socio-Educational Advantage (ICSEA) scores represent the level of educational advantage of each school, based on information relating to parents' occupation, education and language background. This information is obtained from student enrolment records (direct data) and ABS census data (indirect data) (ACARA, 2012). ICSEA values range from around 500 (representing the most educationally disadvantaged backgrounds) to about 1,300 (representing the most educationally advantaged backgrounds) (ACARA, 2012).
3 Matched school ICSEA data was only available for B cohort children at ages 6-7 and 8-9. When the model was run for this subgroup with the ICSEA measure included, the estimates of the association between parental employment and participation in extracurricular activities were similar to those in Table 9.5. In terms of school educational advantage, participation in extracurricular activities was more common among children who went to more advantaged schools. Compared to children in the lower third of the national ICSEA distribution, the odds of participation in school-provided extracurricular activities were 1.6 times higher for children in schools in the top third of the ICSEA distribution. The odds of participating in an extracurricular activity that was not provided by the school were also higher among children who attended more advantaged schools (doubled for children in schools in the middle third of the ICSEA distribution and tripled for those in the top third). This may reflect the availability of school-provided activities, and also differences in the availability of extracurricular activities in the local area.
Acknowledgements
Featured image: GettyImages/davidf
Publication details
Download Publication
Share


