10. Use of technology in the classroom
10. Use of technology in the classroom
The use of information and communication technology (ICT) in schools has increased dramatically in recent years (Orlando, 2014). This has been driven by the recognition that students need to be skilled in the use of these technologies in order to participate effectively in an increasingly digital world (Buabeng-Andoh, 2012; De Bortoli, Buckley, Underwood, O'Grady & Gebhardt, 2013); as well as a growing awareness of the benefits of digital technology for learning (Dwyer, 2007); and policies and programs aimed at increasing students' access to and use of ICT (Dandolo Partners, 2013; Moyle, 2010), such as the government-funded Digital Education Revolution (DER) reform package (2008–13) and school 'Bring Your Own Device (BYOD) programs'.1
Using data collected between 2006 and 2014, this chapter provides a description of the types of activities that educational technology is used for in primary and secondary school classrooms, and how often ICT is used. Teachers' views about technology use in the classroom, and the extent to which teachers' views and use of technology differ according to teacher and school characteristics are also explored.
10.1 Use of computers in primary school classrooms
In primary school classrooms, computers were most commonly used to assist students to develop specific skills in academic areas (Figure 10.1 and Figure 10.2). For both cohorts of LSAC study children, use of computers for this purpose became more frequent as children got older. However, it is difficult to know how much of this increase was due to age-related factors, such as differing curriculum requirements for ICT use in different year levels; how much was due to policy changes such as the DER package; and how much was simply a time-related effect, due to technological advances and increased availability of education technology (e.g. education apps) over this time period.
Box 10.1: Teachers' reports of technology use in the classroom
As part of the LSAC study, teachers of the study children were asked to complete a questionnaire, providing information about the study child, such as their personality and behaviour, as well as aspects of school life. They were also asked about their qualifications and teaching experience:
- For primary students, their main classroom teacher completed a questionnaire.
- For secondary students, it was their English teacher who provided this information.
Across all age groups, around 50% of teachers of children in the K cohort reported using computers for developing specific skills once or twice a week; and the percentage who reported doing this at least three times a week increased from 15% when the children were aged 6–7 to 31% when children were aged 10–11 (Figure 10.1).
Compared to teachers of the K cohort children, teachers of B cohort children reported using computers for developing specific skils more frequently - around 50% of teachers of 6–7 and 8-9 year olds reported doing so once or twice a week, while the percentage who reported using computers for this purpose at least three times a week increased from 26% for teachers of 6–7 year olds in 2010 to 43% of teachers of 10–11 year olds in 2014 (Figure 10.2).
Box 10.2: Use of computers in primary school classrooms
Teachers of primary school children were asked how often children in their class used computers for the following purposes:
- to develop specific skills in academic areas (e.g. literacy, mathematics or science activities)
- to learn keyboarding skills
- for creative activities (e.g. design in visual arts, composing music, animation)
- for enjoyment (e.g. games)
- to access information (e.g. using the internet to look for information).
Teachers could choose from the following options: 'Daily', 'Three or four times a week', 'Once or twice a week', 'Two or three times a month', 'Once a month or less' and 'No computer facilities available'.
Classroom use of computers to access information was more frequent for older children than younger children. The frequency of engagement in this activity, by age group, was quite similar for both cohorts. For example, 28% of 6–7 year olds in 2006 and 38% of 6–7 year olds in 2010 used computers to access information at least once a week; compared to 84% of 10–11 year olds in 2010 and 86% of 10–11 year olds in 2014. This suggests that age-related differences are primarily a reflection of the age-appropriateness of the activity, rather than other factors, such as policy changes or technological advances over time.
The use of computers for other purposes (i.e. to learn keyboarding skills, for creative activities and for enjoyment) was relatively less common, with similar patterns of classroom use, by age group, for children in both LSAC cohorts. For example, the use of computers for keyboarding and for enjoyment became less frequent as children got older. In both cohorts, around 50% of teachers of 6–7 year olds reported using computers for keyboarding skills at least once a week, compared to around 40% of teachers of 10–11 year olds.
Figure 10.1: Use of computers in primary school, by purpose, students aged 6–7 (2006) to 10–11 (2010)
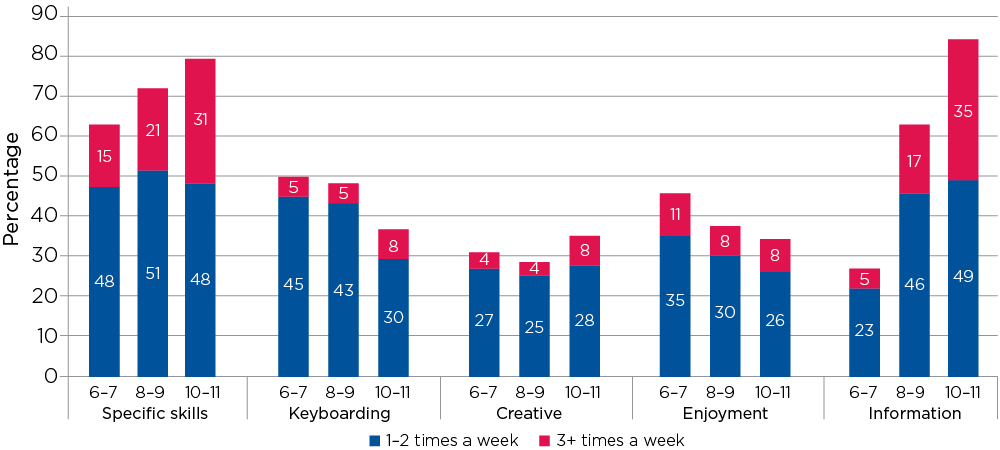
Notes: Sample restricted to teachers who gave valid responses for all five uses of technology. n = 2,834 (Wave 2), 3,322 (Wave 3) and 3,233 (Wave 4).
Source: LSAC Waves 2–4, K cohort (teacher reports), weighted
Figure 10.2: Use of computers in primary school, by purpose, students aged 6–7 (2010) to 10–11 (2014)
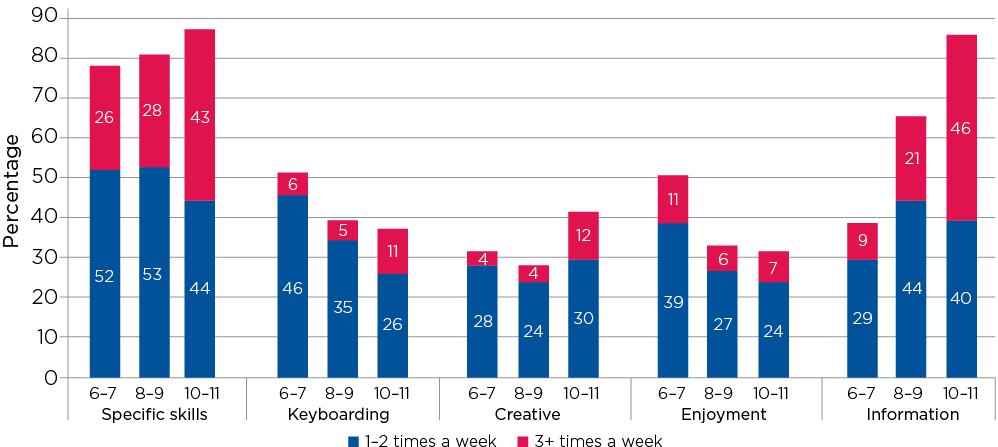
Notes: Sample restricted to teachers who gave valid responses for all five uses of technology. n = 3,188 (Wave 4), 3,345 (Wave 5) and 2,909 (Wave 6).
Source: LSAC Waves 4 to 6, B cohort (teacher reports), weighted
The most likely reason for this finding is that, presumably, by the age of 10–11 most children have developed adequate keyboarding skills, and therefore less classroom time is spent on this activity. However, it is also possible that technological advances may have contributed to this decrease with age, with the use of touch screen devices becoming more common over time.
Use of computers for enjoyment during class time also became less frequent as children progressed through primary school. Around 50% of teachers in both cohorts reported that their students used computers for enjoyment at least once a week at age 6–7, compared to around one-third of teachers 10–11 year olds. It is likely that as children get older, the amount of class time available to use computers for entertainment is reduced substantially, as the intensity of academic activities increases.
10.2 Teachers' use of educational techology in secondary school English classes
In secondary school English classrooms, educational technology was most frequently used to learn or practise basic skills such as reading, prepare written text, correspond with others and conduct research.
Box 10.3: Use of educational technology in secondary schools
When study children in the K cohort were aged 12–13 and 14–15 (Waves 5 and 6), their English teachers were asked, 'In the class in which you teach this student English, how frequently do your students perform the following activities using educational technology?
- prepare written text (e.g. word processing, desktop publishing)
- create or use graphics or visual displays (e.g. graphs, diagrams, pictures, maps)
- learn or practise basic skills (e.g. reading)
- conduct research (e.g. internet searching)
- correspond with others (e.g. students, teachers, experts) via email, network, or internet
- contribute to blogs or wikis
- use social networking websites
- develop and present multimedia presentations
- create art, music, movies or webcasts.
As these questions were asked only about activities in English classes, it is important to note that these responses may not reflect the use of technology in other classes, in particular, for subjects such as science, technology, mathematics or visual arts.
Use of educational technology in English classes was more frequent when study children were aged 14-15, compared to when they were 12–13. This is likely to be partly due to time-related effects such as an increase in the availability of educational technology, as well as differing curriculum requirements for ICT use in different year levels. It may also be a result of schools starting to implement BYOD policies (Thomson, 2015).
About a third (34%) of English teachers said that their students used educational technology to prepare written text at least three times a week at age 14-15 (in 2014), compared to 20% of teachers when students were aged 12–13 (in 2012) (Figure 10.3). Similarly, a higher percentage of teachers of 14–15 year olds (38%) said their students used educational technology at least three times a week to learn or practise basic skills compared to 27% of teachers of 12–13 year olds. The use of educational technology for correspondence was also notably higher at age 14-15 (29%) than at 12–13 (17%).
Less than 10% of English teachers said that their students used educational technology at least three times a week for other purposes (e.g. to create graphics, to contribute to blogs or wikis, for social networking, to develop or present multimedia presentations or to create art, music, etc.). This is, perhaps, not surprising, considering that some of these activities may not be particularly relevant to the English curriculum (Figure 10.4).
Figure 10.3: Use of educational technology to prepare written text by age group
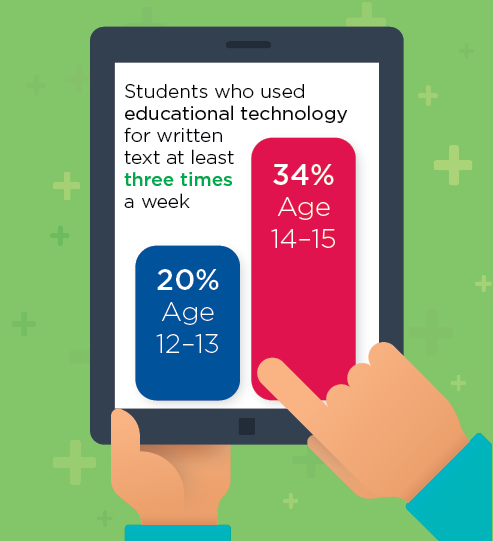
Figure 10.4: Use of educational technology in secondary school English classes, by activity type and student age (teacher reports)
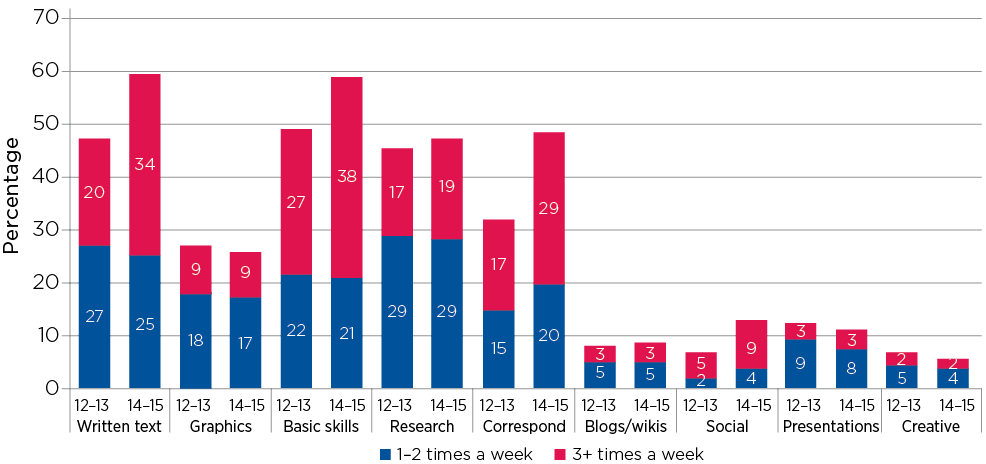
Notes: Sample restricted to teachers who gave valid responses for all nine uses of technology. n = 2,819 (Wave 5) and n = 2,376 (Wave 6).
Source: LSAC Waves 5 and 6, K cohort (English teacher reports), weighted
10.3 Factors associated with classroom technology use
A range of factors may influence teachers' use of technology in the classroom. For example, student grade level is likely to influence the types of activities and the frequency with which teachers use educational technology with their students (Dwyer, 2007). Teacher experience may affect a teacher's willingness and ability to integrate technology use into their everyday teaching (Lau & Sim, 2008; Russell, Bebell, O'Dwyer & O'Connor, 2003; Smerdon, Cronen, Lanahan, Anderson, Iannotti & Angeles, 2000), while geographic location and school educational advantage may influence school resources (Organisation for Economic Cooperation and Development [OECD], 2013; Thomson, 2015). Use of technology may also differ depending on the school sector, as a result of differences in the amount and sources of funding they receive, which may result in differences in levels of ICT resources available. There may also be sector differences in school policies regarding ICT use.
Factors related to computer use in primary school classrooms
Even after factors such as school sector and teacher experience were taken into account, teachers of older primary school students were much more likely to report that their students used computers at least once a week to access information and, to a lesser extent, to develop specific skills and for creative activities (Table 10.1). Compared to teachers of 6–7 year olds:
- The odds of teachers of 8–9 year olds using computers to access information in the classroom were more than 4 times higher, and for teachers of 10–11 year olds, the odds were 15 times higher.
- The odds of teachers using computers to develop specific skills were 1.4 times higher when students were aged 8-9; and doubled if students were aged 10–11.
However, teachers of younger students (age 6–7) were more likely to use computers for enjoyment and to practise keyboarding skills, than teachers of 8-9 and 10–11 year olds.
There were significant associations between school sector and teachers' reports of use of technology for specific activities. Compared to teachers in government schools:
- The odds of teachers in Catholic schools using computers for teaching specific skills, creative activities and for accessing information were 1.2, 1.1 and 1.4 times higher, respectively.
- The odds of teachers in independent schools using computers for teaching specific skills were 15 percentage points lower; and the odds of using computers in the classrooms for enjoyment (games) were 22 percentage points lower.
For all activity types, the odds of using computers in the classroom at least once a week differed according to the teacher's experience level. Generally speaking, teachers with more than five years of teaching experience used computers in class more often than those who had been teaching for less than five years. This finding is consistent with other studies that have found that more experienced teachers tend to be better at integrating technology use into their classroom teaching, and therefore use educational technology more often (Lau & Sim, 2008; Russell et al., 2003).
There were also some differences depending on whether the study child lived in a major city or a regional or remote area.2 Compared to teachers in schools in major cities:
- The odds of using computers to teach specific activities were 16 percentage points lower for teachers in outer regional or remote areas.
- The odds of using computers to access information were 16 percentage points lower among those in inner regional areas, and 24 percentage points lower among those in outer regional or remote areas.
- However, the odds of using computers in the classroom for games (enjoyment) were 1.1 times higher for teachers in inner regional areas and slightly higher again (1.15 times) among teachers in outer regional and remote areas.
After accounting for the age of students, school sector, teacher experience and regional differences, significant differences in classroom computer use remained between teachers of the B and K cohort children - teachers of B cohort children had increased odds of classroom computer use to develop specific skills, to access information and for creative activities, but reduced odds of using computers for keyboarding skills and enjoyment.
It is likely that much of this difference between teachers of the B and K cohort children is a time-related effect, due to technological advances and increased availability of education technology (e.g. education apps). These differences may also be partly due to policy changes such as the BYOD program and DER package that came into effect during this time.
Notes: Random effects logistic regression models, odds ratios reported. * p < .05; ** p < .01; *** p < .001.
Source: LSAC Waves 4-6, B cohort and Waves 2–4, K cohort (pooled data), unweighted
Factors related to technology use in secondary school English classrooms
In this section, we examine the factors related to English teachers' use of technology in the classroom for 12–13 year olds in 2012. In addition to teacher-reported information, we look at matched data about school NAPLAN performance levels (Box 10.4) and the level of educational advantage of the school (measured by the Index of Community Socio-Educational Advantage, ICSEA), which are also available for this group (Box 10.5).
Box 10.4: School NAPLAN performance
A measure of school performance was created, based on matched school-level NAPLAN data. For each year level where NAPLAN data were available for the school, school performance for each of the five domains (Reading, Numeracy, Spelling, Writing and Language conventions) was rated on a five-point scale with 1 meaning 'Well below average' and 5 meaning 'Well above average'. The school's rating for each domain was averaged and three categories were created, representing overall school NAPLAN performance of 'Below average', 'Average' and 'Above average'.
Note that matched school-level NAPLAN data were only available for 2008, 2010 and 2012.
After accounting for a range of characteristics of the school and the English teachers' experience level, Table 10.2 shows that the odds of using technology during English classes differed considerably depending on school sector.
Box 10.5: Index of Community Socio-Educational Advantage (ICSEA)
The Index of Community Socio-Educational Advantage (ICSEA) scores represent the level of educational advantage of each school, based on information relating to parents' occupation, education and language background. This information is obtained from student enrolment records (direct data); and the Australian Bureau of Statistics (ABS) census data (indirect data) (Australian Curriculum, Assessment and Reporting Authority [ACARA], 2012).
ICSEA values range from around 500 (representing extremely educationally disadvantaged backgrounds) to about 1,300 (representing schools with students with very educationally advantaged backgrounds) (ACARA, 2012). In this chapter, school ICSEA scores are divided into quartiles, with quartile 1 representing the most disadvantaged 25% of schools and quartile 4 representing the most advantaged schools.
Matched ICSEA scores were only available from 2008 to 2012. Therefore, we only have school ICSEA values for LSAC K cohort children from ages 8-9 to 12–13 and B cohort children at ages 6–7 and 8-9.
English teachers in Catholic and independent schools had significantly higher odds of using technology in the classroom (for a variety of purposes) than English teachers in government schools. These ranged from 1.5 times higher for the use of technology for research and the preparation of graphics and visual displays in independent schools to 3.3 times higher for the use of technology for corresponding with others in Catholic schools. The only exception was using technology for creating art, music, movies or webcasts. For these activities, which are relatively infrequent in secondary school English classes, there was no significant difference depending on school sector.
In terms of school NAPLAN performance, the only activity for which there was a significant difference, after accounting for other characteristics of the school and teachers' experience, was corresponding with others. Compared to English teachers in schools with below average NAPLAN performance, the odds of classes using technology to correspond with others were 1.7 times higher among teachers in schools with average NAPLAN results, and 2.7 times higher for teachers in schools with above average performance in NAPLAN.
Notes: Logistic regression models, odds ratios reported. * p < .05; ** p < .01; *** p < .001.
Source: LSAC Wave 5, K cohort (teacher reports), weighted
Teaching experience was also related to how often technology was used in English classes for particular activities. As was the case for primary school teachers, secondary school English teachers with more than five years of experience used educational technology more often than those who had been teaching for less than five years. After accounting for a variety of school characteristics, compared to English teachers with less than five years of teaching experience:
- The odds of using technology to prepare written text at least once a week were almost doubled among teachers with over 20 years' experience.
- The odds of weekly use of technology to create graphics or visual displays were 1.4 times higher among teachers with 10–20 years' experience, and 1.5 times higher among teachers who had been teaching for at least 20 years.
- The odds of using technology to teach basic skills, such as reading, were around 1.3 times higher for teachers with at least five years' experience.
- The odds of using educational technology in English classes to contribute to blogs and wikis at least once a week were 1.7 times higher for teachers with 5–10 years of experience, and 1.6 times higher for those with 10–20 years of experience.
- The odds of using technology for research during English classes were almost doubled for teachers who had been teaching for 20 years or more.
For some classroom activities, there were differences in the odds of weekly use of technology, according to whether the school was in a major city or a regional or remote area. Compared to teachers in major cities:
- The odds of weekly classroom use of educational technology to create blogs or wikis were 40 percentage points lower, and the odds of using technology for social networking were halved for teachers in inner regional areas.
- The odds of weekly use of technology for multimedia presentations were reduced by almost 60 percentage points, and the odds of using technology in the classroom for activities such as creating art, music, movies or webcasts were reduced by over 90 percentage points for teachers of students who live in remote areas.
After controlling for other factors, there was no significant association between the level of school educational advantage (ICSEA) and secondary school teachers' technology use in English classes. This lack of statistical significance is likely to be due to the high level of correlation between school sector, school performance and school ICSEA. For example, compared to government schools, independent schools are more likely to be in the highest ICSEA quartile; and it is likely that many high ISCEA schools are also high-performing schools in terms of NAPLAN outcomes.
10.4 Teachers' views about the use of technology at school
Research suggests that if teachers feel confident using educational technology, can see the value in the use of ICT in the classroom, have access to adequate equipment and feel supported in the use of educational technology, they are more likely to integrate educational technology into their teaching (Buabeng-Andoh, 2012; Gilakjani, 2013).
Teachers' responses to the LSAC questions about their views of the use of educational technology in the teaching program at their school were generally positive; and, overall, the responses of teachers of 12–13 year olds in 2012 and teachers of 14–15 year olds in 2014 were very similar. Over 90% of secondary school English teachers agreed that the teachers at their school were interested in using technology in classroom instruction; about 85% reported that technology use was a priority of the school administration, and a similar proportion agreed that students used a range of educational technology in the classroom (Figure 10.5).
Views about their training in the use of technology were also quite favourable, with close to 80% of teachers agreeing that training was sufficient. At least three quarters also believed that funding for educational technology was being spent appropriately at their school. However, 30% of teachers said that the technology infrastructure at their school was inadequate; and more than a quarter said that technical support for educational technology was inadequate, as was teacher training on integrating technology use into classroom instruction.
Teachers' views about technology use at their school varied depending on a variety of factors, including their teaching experience and some of the characteristics of the school. Table 10.3 shows that, among English teachers of 12–13 year olds in 2012, views about the use of technology at school differed considerably depending on whether they were teaching at a government, Catholic or independent school.3
Box 10.6: Teachers' views on educational technology
In Waves 5 and 6 of LSAC (2012 and 2014), English teachers of children in the K cohort were asked to indicate their level of agreement with the following statements about the use of technology in the educational program at their school:
- Teachers are sufficiently trained in technology usage.
- Teachers are sufficiently trained to integrate technology into classroom instruction.
- Teachers are interested in using technology in classroom instruction.
- Teachers conduct lessons in which students use a range of educational technologies.
- Technology is a priority of the school administration.
- Technology infrastructure is adequate (e.g. adequate internet speeds).
- Technical support for educational technology is adequate.
- Funding for educational technology is being spent in the most appropriate ways.
Possible responses to these statements were 'Strongly agree', 'Somewhat agree', 'Somewhat disagree' and 'Strongly disagree'. For each statement, the categories 'Strongly agree' and 'Somewhat agree' were combined to create a measure of teachers' general agreement.
Figure 10.5: Percentage of teachers who agreed with statements about school technology use, by students 12–13 years (2012) and 14-15 years (2014)
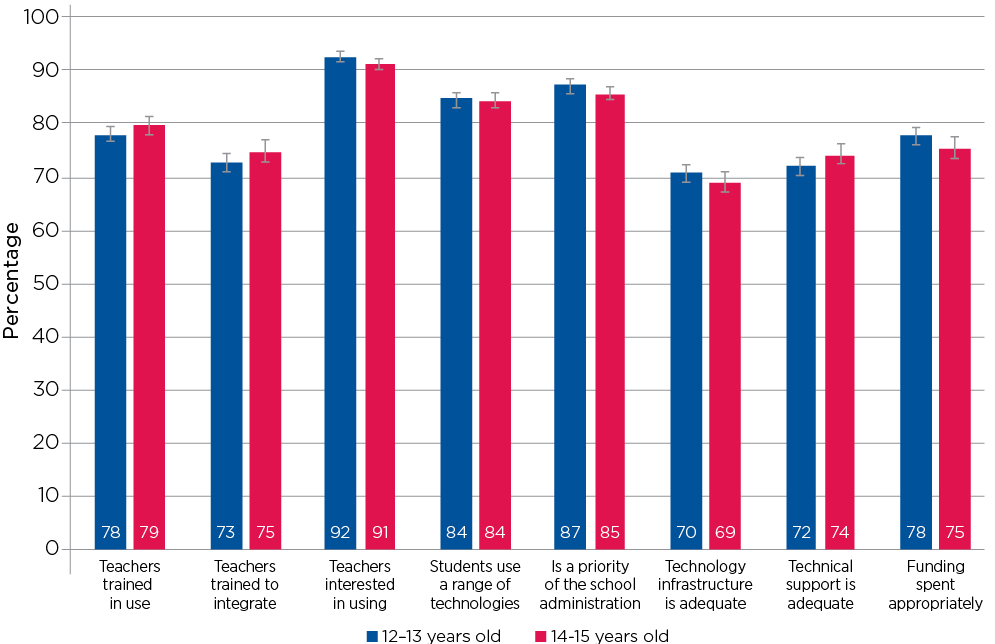
Note: n = 3,084 (Wave 5) and n = 2,513 (Wave 6).
Source: LSAC Waves 5-6, K cohort (teacher reports), weighted
Notes: Logistic regression models, odds ratios reported. * p < .05; ** p < .01; *** p < .001.
Source: LSAC Wave 5, K cohort, weighted
After taking into account other factors, English teachers working in Catholic schools reported significantly more positive views about all aspects of the use of educational technology in their school than their counterparts in government schools. Teachers in independent schools also reported significantly more favourable views than teachers in government schools on many items, including teacher training levels, teachers' interest in technology, the adequacy of technical support and infrastructure and how appropriately funding for educational technology was spent.
On the other hand, there was very little association between school performance and teachers' views about the use of technology at their school. Only one statistically significant difference was found - compared to teachers with below average NAPLAN results, teachers in schools with average NAPLAN scores were more likely to agree that technology was a priority of the school administration, with odds of agreement 1.6 times higher.
Teaching experience was also related to teachers' views of technology use at their school. For example, compared to teachers with less than five years of experience, for teachers with at least 20 years' experience:
- The odds of agreeing that teachers were interested in using technology in classroom instruction were 3.7 times higher.
- The odds of agreeing that students used a range of technologies in the classroom were more than doubled.
- The odds of agreeing that technology was a priority of the school administration were 1.8 times higher.
These findings differ from another study, conducted in Greece, which found that highly experienced primary and secondary school teachers tended to hold more negative views about ICT use in the classroom (Jimoyiannis & Komis, 2007). However, teachers in the Greek study were asked about their personal beliefs about ICT as a teaching and learning tool, while teachers in LSAC were asked about technology use within their schools, so the results are not directly comparable.
School educational advantage, as measured by ICSEA, was not significantly associated with teachers' views on technology use, once other factors were accounted for. This is likely to be at least partly due to the association between the ICSEA measure and other characteristics of the school, particularly school sector.
After accounting for teaching experience and the characteristics of the school, there were very few significant associations between English teachers' views about technology according to whether they were teaching in a major city or a remote area. Compared to teachers in major cities:
- The odds of teachers in inner regional locations agreeing that funding for school technology use had been spent appropriately were 27 percentage points lower.
- The odds of teachers in outer regional locations agreeing that teachers were interested in using technology in the classroom were almost halved.
These results suggest that while teachers' views about technology use at school do differ depending on whether they are teaching at a government, Catholic or independent school, other characteristics of the school, including whether it is a high performing school in terms of NAPLAN results, and the level of school socio-economic advantage, do not have a strong influence on teachers' views about the adequacy of the technology infrastructure of the school, or teachers' training in in the use of technology.
Summary
Australian teachers appear to have embraced the use of educational technology in their classrooms. The LSAC data show that, in primary school classrooms, computers were most commonly used to assist students to develop their skills in specific academic areas; while in secondary school English classrooms, ICT was regularly used to practise basic skills, prepare written text and correspond with others.
The use of educational technology became more frequent as students got older. This increase in technology use is likely to have resulted from a variety of factors, including an increase in the availability of educational technology over the study period, age-related factors such as differing curriculum requirements for ICT use in different year levels, and differing expectations of older and younger students' ICT capabilities.
On the whole, teachers had positive views about the use of educational technology in their schools. The vast majority of teachers reported that their school administration viewed educational technology as a priority, and that teachers were interested in using ICT and integrating it into their teaching. However, inadequate infrastructure and technical support were seen as an issue for a sizeable minority.
Teachers' use of technology varied considerably with student age, teacher experience, the school sector and geographic location. More experienced teachers were more likely to integrate technology into their classroom activities. Among secondary school English teachers, those working in Catholic and independent schools were more likely to use ICT in the classroom than those in government schools. Interestingly, among teachers of 12–13 year olds in 2012, school academic performance (measured by NAPLAN) and school educational advantage (measured by ICSEA) were generally not related to teachers' use of technology in the classroom, once other factors were taken into account.
These findings reflect patterns of teacher's ICT use during a period of rapid change and growth in ICT use in Australian schools. The study data (collected between 2006 and 2014) spans the period just prior to, during and immediately after the implementation of the Digital Education Revolution (DER, 2008 to 2013). The introduction of this government-funded educational reform package is likely to have affected our findings. For instance, while the DER was largely targeted at students in Years 9-12, it has been credited as having beneficial flow-on effects for students in other year levels, such as improvements to school IT infrastructure (e.g. internet access) and increasing recognition among educators of the merits of incorporating ICT use in teaching (Dandolo Partners, 2013). Therefore, the implementation of the DER is likely to have contributed to the increase in technology use observed at different ages. The collection of the LSAC data also coincides with the early stages of Bring Your Own Device (BYOD) programs, which may, in part, explain some of the increases in rates of educational technology use over time.
While this chapter focused on the frequency of teachers' ICT use in the classroom, it is important to note that it may be not how often but how effectively ICT is used to support teaching goals that makes its use successful (Kervin, Verenikina, Jones, & Beath, 2013). With this in mind, improving teacher's expertise and confidence in integrating technology into their everyday teaching and providing them with the resources and support to do so may have benefits for students.
References
Australian Curriculum, Assessment and Reporting Authority (ACARA). (2012). Guide to understanding ICSEA. Sydney: ACARA. Retrieved from www.acara.edu.au/verve/_resources/guide_to_understanding_icsea.pdf
Buabeng-Andoh, C. (2012). Factors influencing teachers' adoption and integration of information and communication technology into teaching: A review of the literature. International Journal of Education and Development using Information and Communication Technology, 8, 136-155.
Dandolo Partners. (2013). DER mid-program review: Assessing progress of the DER and potential future directions. Final report. Canberra: Department of Education.
De Bortoli, L., Buckley, S., Underwood, C., O'Grady, E., & Gebhardt, E. (2013). ICILS 2013: Australian students' readiness for study, work and life in the digital age. Melbourne: Australian Council for Educational Research (ACER).
Dwyer, J. (2007). Computer-based learning in a primary school: Differences between the early and later years of primary schooling. Asia-Pacific Journal of Teacher Education, 35, 89-103. doi: 10.1080/13598660601111307
Gilakjani, A. P. (2013). Factors contributing to teachers' use of computer technology in the classroom. Universal Journal of Educational Research, 1, 262-267.
Janssen, K. C., & Phillipson, S. (2015). Are we ready for BYOD? An analysis of the implementation and communication of BYOD programs in Victorian schools. Australian Educational Computing, 30, 1-14.
Jimoyiannis, A., & Komis, V. (2007). Examining teachers' beliefs about ICT in education: Implications of a teacher preparation programme. Teacher Development, 11, 149-173.
Kervin, L., Verenikina, I., Jones, P., & Beath, O. (2013). Investigating synergies between literacy, technology and classroom practice. Australian Journal of Language and Literacy, 36, 135-147.
Lau, B. T., & Sim, C. H. (2008). Exploring the extent of ICT adoption among secondary school teachers in Malaysia. International Journal of Computing and ICT Research, 2, 19-36.
Moyle, K. (2010). Building innovation: Learning with technologies (Australian Education Review No. 56). Melbourne: ACER.
Organisation for Economic Cooperation and Development (OECD). (2013). What makes urban schools different? (PISA in Focus No. 28). Paris: OECD. Retrieved from www.oecd.org/pisa/pisaproducts/pisainfocus/pisa in focus n28 (eng)--FINAL.pdf
Orlando, J. (2014). Teachers' changing practices with information and communication technologies: an up-close longitudinal analysis. Research in Learning Technology, 22, 21354. doi: 10.3402/rlt.v22.21354
Russell, M., Bebell, D., O'Dwyer, L., & O'Connor, K. (2013). Examining teacher technology use: Implications for preservice and inservice teacher preparation. Journal of Teacher Education, 54, 297-310.
Smerdon, B., Cronen, S., Lanahan, L., Anderson, J., Iannotti, N., & Angeles, J. (2000). Teachers' tools for the 21st Century: A report on teachers' use of technology, NCES 2000-102. Washington, DC: US Department of Education. National Center for Education Statistics.
Thomson, S. (2015). Australian students in a digital world. (Policy Insights No. 3). Melbourne: ACER.
1 See Dandolo Partners (2013) for details of the DER reform package, and Janssen & Phillipson (2015) for a description of BYOD programs.
2 While acknowledging that some students may have to travel a considerable distance between home and school, this analysis presumes that the majority of students attend a school relatively close to their home, and that the school they attend is in a similar geographical location to their home.
3 This analysis was limited to teachers of 12–13 year olds in 2012, as teachers' views were very similar in 2012 and 2014, and matched school-level NAPLAN and ICSEA data were not available for teachers of 14-15 year olds.
Acknowledgements
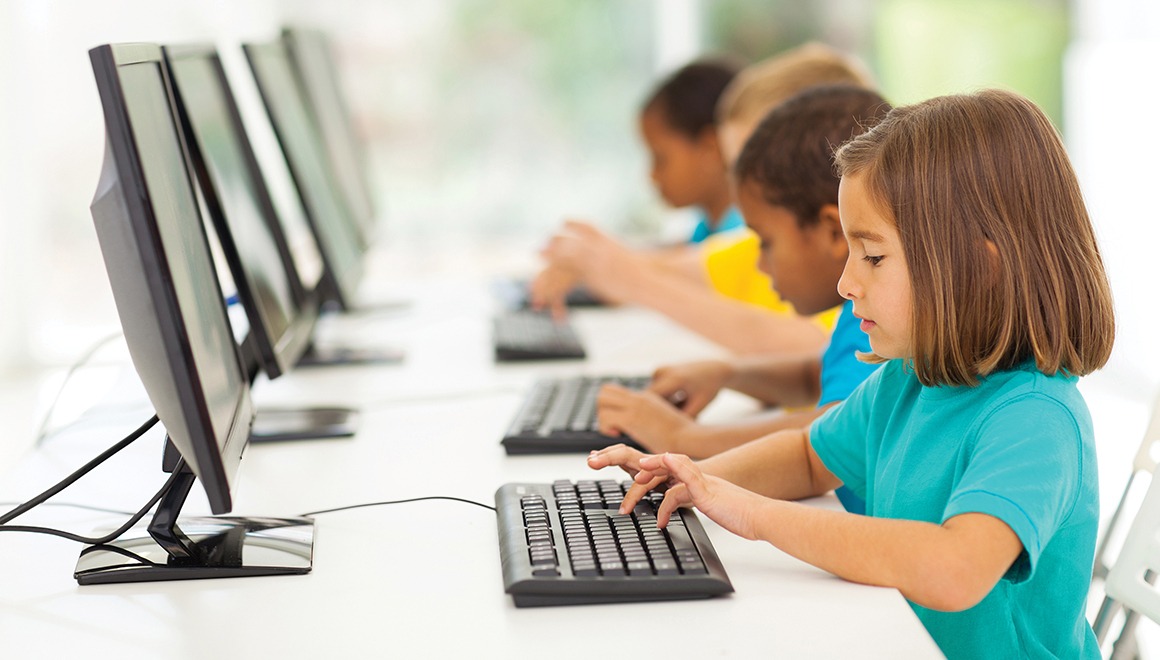
Featured image: © GettyImages/michaeljung
Publication details
Download Publication
Share


