3. The physical health of Australian children
3. The physical health of Australian children

Key messages
Overview
As children make the transition from childhood to adolescence, they undergo rapid developmental changes that affect their physical, emotional, mental and social wellbeing (Patton et al., 2016). Good physical health in adolescence is important to support the body’s changes and development, and to allow full participation in learning, leisure and relationships. Adolescence is also a time to form habits that support long-term health and wellbeing. Being active, eating a varied and nutritious diet and getting a good night’s sleep have been identified as important behaviours to support health into adulthood (Harris, King, & Gordon-Larsen, 2005).1
Health in adolescence is also important in the longer term. Children and adolescents with poorer physical health markers such as being overweight, poor diet, lack of physical activity and hypertension have a greater risk of developing chronic diseases such as cancer, cardiovascular disease and diabetes leading to early mortality in adulthood (World Health Organization, 2014).
This chapter uses the data collected in the Child Health CheckPoint (Box 3.1), a LSAC biomarker module, and provides a snapshot of some basic dimensions of physical health of Australian children at age 11–12 years in the following areas:
- diet and physical activity
- physical health markers: weight status, hypertension, hearing and vision.
The Child Health CheckPoint focused on measures of non-communicable diseases (Clifford et al., 2019) (also known as chronic diseases, they are the result of a combination of genetic, physiological, environmental and behavioural factors). Most of these (physical activity, weight status, hypertension, hearing and vision) were measured by trained technicians and/or specialised equipment, providing an accurate assessment of these key aspects of children’s physical health not previously available in LSAC. Together, these markers provide a broad overview of the health of Australia’s 11–12 year olds.
It should be acknowledged that this is not a comprehensive or exhaustive overview of child physical health. There are many other important health indicators collected in the Child Health CheckPoint that are not examined in this chapter (e.g. bone health, respiratory health, dental health and allergies) (Clifford, Davies, & Wake, 2019), which would add to the overall picture of physical health. Therefore, this chapter should be viewed only as ‘selected findings’ – a taste of the vast potential of the CheckPoint data. In addition, the chapter examines the distribution of the physical health behaviours and markers across different demographic groups, as well as assessing the impact of these basic dimensions of physical health on children’s general wellbeing and quality of life.
Box 3.1: What is CheckPoint?
The Child Health CheckPoint assessment was a comprehensive suite of direct physical measurements and biospecimen collection offered to the B cohort when they were 11–12 years old, conducted by the CheckPoint team at the Murdoch Children’s Research Institute. The main aim of the CheckPoint assessment was to take a comprehensive, objective and cross-sectional measure of child health during the transition from childhood to adolescence in order to explore the relationships between environmental, genetic and social factors and a wide range of health measures. All contactable and consenting LSAC families in the B cohort were invited to take part (n = 3,513). Recruitment began in December 2014, and data were collected between February 2015 and March 2016 (between LSAC Waves 6 and 7). A total of 1,874 children and their parents participated in the CheckPoint assessment (50% of the B cohort) (Clifford et al., 2019).
The CheckPoint assessment included data collection on key physical health markers (e.g. cardiovascular health, weight status, vision) and health indicators (e.g. physical activity, diet), using state-of-the-art equipment and self-report questionnaires. It also collected blood samples (stored for biochemical and genetic analyses), along with urine, saliva, toenail and hair samples.
Main Assessment Centres containing the required equipment were set up and moved around the country every few weeks. In total, the study visited over 30 cities across Australia. The one-day visit involved attending 15 different stations for data collection on different aspects of health (Figure 3.1). Where it was not possible for families to travel to the Main Assessment Centres in major cities, Mini Assessment Centres (n = 153, 8.2% of CheckPoint participants) were set up in regional cities where there was a concentration of LSAC participants, and home visits (n = 365, 19.5% of CheckPoint participants) were also conducted where needed.
Figure 3.1: Assessment stations in the Child Health CheckPoint
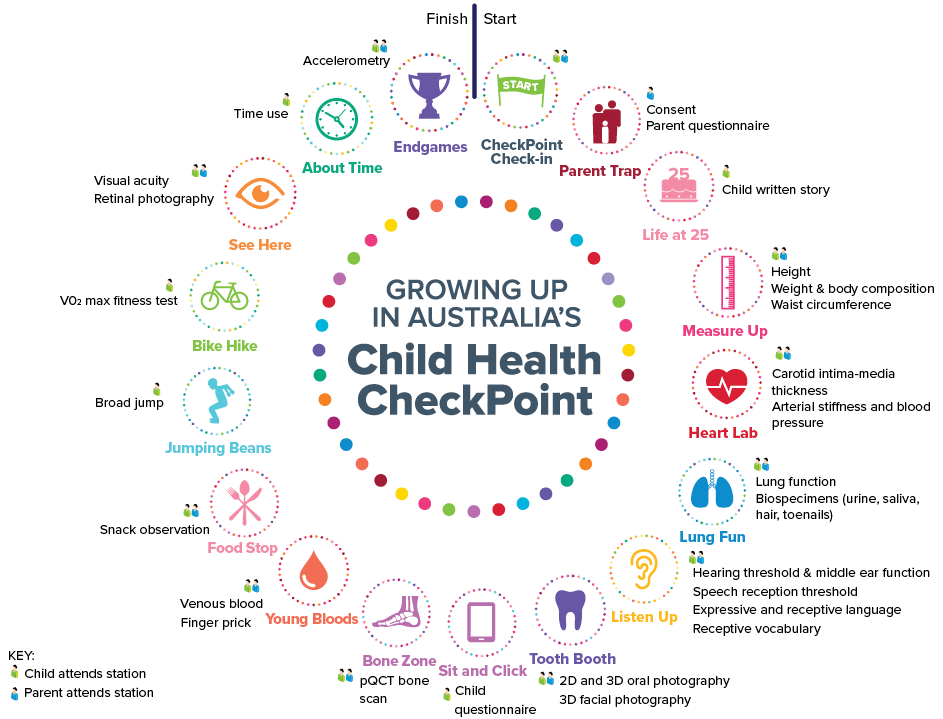
Source: Clifford, S., Davies, S., Gillespie, A., Lange, K., & Wake, M. (2018). Longitudinal Study of Australian Children’s Child Health CheckPoint Data User Guide – March 2018. Melbourne: Murdoch Children’s Research Institute. doi: 10.25374/MCRI.5687590
See Clifford et al. (2019) for a comprehensive description of the rationale, methodology and equipment used in CheckPoint.
3.1 Diet and physical activity
Having a healthy diet and being physically active are related to a range of health outcomes. The types of food eaten and the physical activity undertaken in early adolescence is a result of a whole set of influences acting on an individual. These influences range from genetic factors to family, peer, school and societal environments (Viner et al., 2012).
Physical activity
For children, regular physical activity produces positive physical, psychosocial and cognitive health effects (Ahn & Fedewa, 2011; Poitras et al., 2016), as well as benefits to school functioning and academic achievement (Watson, Timperio, Brown, Best, & Hesketh, 2017). In Australia, it is recommended that children aged between five and 12 years participate in at least 60 minutes of moderate to vigorous physical activity per day, comprising mainly aerobic activities (Department of Health, 2019).
In CheckPoint, more than half of children did not meet the current guidelines for 60 minutes of moderate to vigorous physical activity per day (52% on weekdays and 65% on weekends; Table 3.1). Children recorded an average of 64 minutes of physical activity on weekdays and 52 minutes per day on weekends. The proportion of children not meeting physical activity guidelines was lower than that previously reported for children aged 9-12 in Australia, which showed that 82% of children did not meet the guidelines in 2011/12 (Australian Institute of Health and Welfare [AIHW], 2019).
More girls than boys were not meeting the guidelines for moderate to vigorous physical activity.
- On weekdays, 67% of girls and 37% of boys were not participating in the recommended amount of physical activity.
- On weekends, 73% of girls and 58% of boys were not doing enough physical activity.
This sex difference may be due to boys perceiving more peer and adult support or being provided with more opportunities to engage in physical activity than girls as they move into adolescence (Edwardson, Gorely, Pearson, & Atkin, 2013; Telford, Telford, Olive, Cochrane, & Davey, 2016). At this age, girls and boys, who have often played sport and done physical education alongside each other, begin to diverge in some aspects of strength and speed (Tonnessen, Svendsen, Olsen, Guttormsen, & Haugen, 2015). This might cause some girls to think they are less competent than boys and to lose motivation for team activities (Telford et al., 2016).
| % of children not meeting guidelines | ||
|---|---|---|
| Weekday | Weekend | |
| All 11-12 year olds | 51.7 | 65.2 |
| Sex | ||
| Male (n = 955) | 37.4 | 57.8 |
| Female (n = 919) | 66.6* | 72.6* |
| Language other than English at home | ||
| English (n = 1,723) | 50.2 | 64.1 |
| Non-English (n = 151) | 65.5 | 74.2 |
| Parent education | ||
| No degree (n = 817) | 51.2 | 69.6 |
| Degree (n = 1,049) | 52.1 | 60.3* |
| Equivalised parent income1 | ||
| Bottom third (n = 387) | 50.2 | 67.9 |
| Middle third (n = 559) | 49.9 | 60.8 |
| Top third (n = 675) | 50.6 | 59.8 |
| Remoteness area | ||
| Major cities (n = 1,318) | 52.4 | 65.6 |
| Inner regional (n = 379) | 50.4 | 62.9 |
| Outer regional or remote (n = 177) | 50.7 | 67.4 |
Notes: * Statistically significant difference between categories for a demographic characteristic at p < 0.05 level. Where 95% confidence intervals for the groups being compared do not overlap, this indicates that the differences in values are statistically significant. Physical activity, sex and remoteness area were obtained from the CheckPoint dataset, and parent education, equivalised parent income and language other than English at home were obtained from LSAC Wave 6. Parent education was defined according to (i) whether one or both parents had a degree or (ii) neither parent had a degree. Equivalised parent income is the combined income of resident parents, adjusted for the number of people in the family using an equivalising factor of 1 for the first adult + 0.5 for all other adults (over 15) in the immediate family + 0.3 for all children under the age of 15. Sample size was smaller due to missing observations on one of the measures comprising the equivalised parent income, 1,201 and 1,160, for weekdays and weekends, respectively.
Source: CheckPoint dataset, weighted
Box 3.2: Physical activity – The ‘Endgames’ station
| Domain | Subdomains | Measurement | Outcome(s) | |
|---|---|---|---|---|

|
Physical activity | Activity tracking | Wrist-worn activity trackers (accelerometers) worn for 8 consecutive days | Minutes spent in moderate to vigorous activity were calculated for all weekdays and all weekend days using the Phillips cut points (Phillips, Parfitt, & Rowlands, 2013). |
According to the Department of Health (2019) guidelines, children were divided into two categories:
- those who met physical activity guidelines; that is, engaged in 60 or more minutes of moderate to vigorous activity per day
- those who did less than 60 minutes of moderate to vigorous activity per day, and therefore did not meet the guidelines.
There were differences in physical activity on weekends according to the child's parents' level of education. Forty per cent of children who had at least one parent with a degree met the guidelines for physical activity on weekends. This was more than children of less-educated parents (where neither had a degree) for which only 30% met the guidelines. This finding supports previous research showing that adolescents aged 15-16 with more highly educated parents were more physically active (Kantomaa, Tammelin, Nayha, & Taanila, 2007).
Although some Australian research has found that children and adolescents living in outer regional or remote areas were more likely to meet physical activity guidelines than those living in major cities (Australian Institute of Health and Welfare, 2018b; Bell et al., 2016; Dollman, Maher, Olds, & Ridley, 2012), the CheckPoint data found no difference between these groups (Table 3.1). This is likely due to the composition of the CheckPoint sample, which did not include children from very remote areas.
Adolescents’ diets
Poor diet in childhood and adolescence is related to worse health and increased risk of many diseases. The Australian Dietary Guidelines recommend that 11–12 year olds consume two serves of fruit and at least five serves of vegetables daily and drink plenty of water (National Health and Medical Research Council [NHMRC], 2013). This section examines four markers of a healthy diet: amount of fruit consumption and vegetable consumption, frequency of breakfast consumption and water intake.
Water is required for most bodily functions, including regulating body temperature and helping digestion, and regular intake is important for good health (Department of Health and Human Services, 2014). It is recommended that children and young adolescents aged 9–13 years drink about 5–6 cups of fluid a day (NHMRC, Australian Government Department of Health and Ageing, & New Zealand Ministry of Health, 2006), preferably in the form of plain water (NHMRC, 2013). Fruit and vegetables contain fibre, vitamins and minerals, and both are an important part of a healthy diet (Department of Health and Human Services, 2011). Fruit and vegetable consumption can help to reduce obesity, maintain a healthy weight, lower cholesterol, and reduce the risk of cardiovascular disease, stroke, diabetes, high blood pressure and cancer (Department of Health and Human Services, 2011). Eating breakfast on a regular basis also provides health benefits, including better nutritional profiles, a lower likelihood of being overweight and better cognitive function (Rampersaud, Pereira, Girard, Adams, & Metzl, 2005).
In the Child Health CheckPoint, children completed a questionnaire regarding their usual intake of various foods including fruit and vegetable consumption, water intake, and breakfast consumption, as part of a series of questions asked at the ‘Sit and Click’ station (Boxes 3.3–3.5).
Box 3.3: Fruit and vegetable consumption – the ‘Sit and Click’ station
| Domain | Subdomains | Question | |
|---|---|---|---|

|
Diet | Vegetable consumption
Fruit consumption |
A self-report questionnaire was used to assess diet.
Response categories were: ‘I don’t eat fruit/vegetables’; ‘Less than 1 serve a day’; ‘1 serve’; ‘2 serves’; ‘3 serves’; ‘4 serves’; ‘5 serves’; ‘6 serves or more’. |
According to the Australian Dietary Guidelines (NHMRC, 2013), children were divided into those who were meeting the guidelines and not.
For vegetables:
- those who consume five or more serves of vegetables a day
- those who consume less than five serves of vegetables a day, and therefore do not meet the guidelines.
For fruits:
- those who consume two or more serves of fruit a day
- those who consume less than two serves of fruit a day, and therefore do not meet the guidelines.
Box 3.4: Breakfast consumption – the ‘Sit and Click’ station
| Domain | Subdomains | Question | |
|---|---|---|---|

|
Diet | Breakfast consumption |
Response categories were: ‘Never’; ‘Less than once a week’; ‘About 1–2 times a week’; ‘About 3–4 times a week’; ‘About 5–6 times a week’; ‘Everyday’. |
Children were divided into two categories for breakfast consumption:
- those who reported having breakfast 5–6 times a week or everyday
- those who reported having breakfast four or less times a week.
Note: Children were not asked what they were eating for breakfast.
Box 3.5: Water intake – the ‘Sit and Click’ station
| Domain | Subdomains | Question | |
|---|---|---|---|

|
Diet | Water intake |
Response categories were: ‘I don’t drink water’; ‘Less than one cup a day’; ‘About 1 cup a day’; ‘About 2 cups a day’; ‘About 3 cups a day’; ‘About 4 cups a day’; ‘About 5 cups or more a day’. |
Children were divided into two categories for water consumption:
- those who drank five cups or more a day
- those who drank four cups or less a day.
Notes: * Statistically significant difference between categories for a demographic characteristic at p < 0.05 level. Where 95% confidence intervals for the groups being compared do not overlap, this indicates that the differences in values are statistically significant. Fruit/vegetable consumption, breakfast consumption, water intake, sex and remoteness area were obtained from the CheckPoint dataset, and parent education, equivalised parent income and language other than English at home were obtained from LSAC Wave 6. Parent education was defined according to (i) whether one or both parents had a degree or (ii) neither parent had a degree. Equivalised parent income is the combined income of resident parents, adjusted for the number of people in the family using an equivalising factor of 1 for the first adult + 0.5 for all other adults (over 15) in the immediate family + 0.3 for all children under the age of 15. Sample size varied by demographics due to missing cases.
Source: CheckPoint dataset, weighted
More boys than girls were not meeting the guidelines for fruit consumption (Table 3.2). Almost three in 10 boys (29%) were not consuming the recommended number of servings of fruit, compared to less than two in 10 girls (19%). This finding is consistent with other research showing girls tend to consume fruit more frequently or in higher quantities than boys (Rasmussen et al., 2006), possibly because girls prefer eating fruit more than boys do (Bere, Brug, & Klepp, 2008).
Less than two in 10 children who had one or both parents with a degree were not meeting the guidelines for fruit consumption (19%), compared to almost three in 10 children who had both parents without a degree qualification (28%). Sufficient fruit consumption has also previously been related to parent education, with children whose parents are more educated being more likely to have healthy diets (including a high frequency of fruit and vegetable consumption) in childhood and adolescence (Gasser, Mensah, Kerr, & Wake, 2017).
Over four in five children (82%) consumed breakfast at least five times a week, with 72% consuming breakfast daily. Children’s frequency of breakfast consumption differed according to their parents’ level of education (Table 3.2). Around one quarter of children who had both parents without a degree (24%) consumed breakfast four times a week or less, compared to around one in 10 (11%) who had one or both parents with a degree. This finding supports previous research that showed that compared to children whose mothers had low levels of education, children whose mothers were highly educated were more likely to eat breakfast every day (van Ansem, Schrijvers, Rodenburg, & van de Mheen, 2014).
In LSAC’s Child Health CheckPoint, approximately 65% of children consumed four or less cups of water a day.2 Although previous studies have found demographic differences in water consumption (Drewnowski, Rehm, & Constant, 2013; Jomaa, Hwalla, Constant, Naja, & Nasreddine, 2016), in CheckPoint, there were no differences in water consumption according to key demographic characteristics (Table 3.2).
3.2 Physical health markers
Physical health markers are direct measurements taken on children in the CheckPoint assessment. Since they are objectively measured and do not rely on information gathered from the children, their parents or other adults, they provide an accurate picture of the current physical health status of 11–12 year olds. The Child Health CheckPoint collected data on a large number of key health markers, of which weight status, hypertension, vision and hearing are examined here.
Weight status
Body mass index (BMI) is a commonly used way to estimate a person’s weight status that takes into consideration the person’s height. In children and adolescents, BMI is used to find out if a child or adolescent is underweight, of a healthy weight, overweight or obese (Box 3.6).
In LSAC’s Child Health CheckPoint, 7% of children were underweight, 66% were of a normal weight, 21% were overweight (but not obese) and 6% were obese. These findings are similar to those from the AIHW, which estimated from BMI measurements that approximately one in three (31%) children aged 10–13 in Australia in 2015 were overweight or obese, with no differences by sex (AIHW, 2017a; AIHW, 2017b). Being overweight or obese during puberty increases the risk of being overweight or obese in adulthood, and is related to a range of poorer health outcomes including diabetes, cardiovascular disease, hormonal imbalances and cancer (Jasik & Lustig, 2008; Sanders, Han, Baker, & Cobley, 2015).
Among the 27% of children classified as overweight or obese in CheckPoint, there were differences according to parent education and income (Figure 3.2).
- Around one in three (32%) children who had neither parent with a degree were overweight or obese, compared to around one in five (21%) children who had one or both parents with a degree.
- Around one in three (31%) children in the lowest third of equivalised parent income were overweight or obese, compared to around one in five (20%) in the highest third of equivalised parent income.
These findings are consistent with other research showing children from families with low educational attainment or low income are at higher risk of obesity (Brophy et al., 2009). There were no differences in being overweight or obese according to sex, remoteness area or speaking a language other than English at home.
Not eating breakfast is related to being overweight and obese in adolescents (Szajewska & Ruszczynski, 2010). In CheckPoint, there was a difference in the proportion of children who were overweight or obese, according to the frequency at which they consumed breakfast. Over one third (35%) of children who consumed breakfast four times a week or less were overweight or obese, compared to around one quarter (25%) of children who consumed breakfast at least five times a week.
Box 3.6: Overweight and obesity – ‘Measure Up’ station
| Domain | Subdomains | Measurement | Outcome(s) | |
|---|---|---|---|---|

|
Weight and obesity | 1. Height
2. Weight 3. BMI |
Invicta stadiometer (height)
Bioelectrical impedance analysis (BIA) (weight) |
BMI score classified as:
|
Body mass index (BMI) is defined as weight (kg) divided by height (m2). For study children, underweight, normal weight, overweight and obese were defined according to International Obesity Task Force BMI cut-offs (Cole & Lobstein, 2012). These cut-offs account for age and sex. Children were divided into two categories for weight status: underweight or normal weight versus overweight or obese. Overweight is equivalent to adult BMI values of 25 to less than 30 and obesity is equivalent to adult BMI values of 30 or higher.
Figure 3.2: Percentage of children who were overweight or obese, by key demographic characteristics
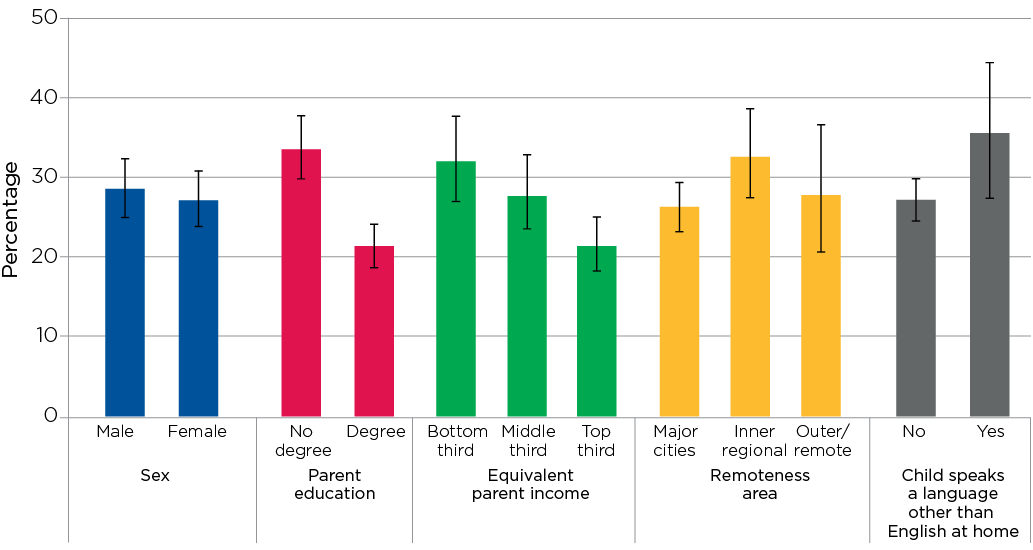
Notes: 95% confidence intervals are shown by the ‘I’ bars at the top of each column. Where confidence intervals for the groups being compared do not overlap, this indicates that the differences in values are statistically significant. n = 1,871 for sex, remoteness area and language other than English at home; n = 1,863 for parent education and n = 1,619 for equivalised parent income. Overweight/obesity, sex and remoteness area were obtained from the CheckPoint dataset, and parent education, equivalised parent income and child’s language other than English at home were obtained from LSAC Wave 6. Parent education was defined according to (i) whether one or both parents had a degree or (ii) neither parent had a degree. Equivalised parent income is the combined income of resident parents, adjusted for the number of people in the family using an equivalising factor of 1 for the first adult + 0.5 for all other adults (over 15) in the immediate family + 0.3 for all children under the age of 15.
Source: CheckPoint dataset, weighted
Credit: Longitudinal Study of Australian Children 2019 (creativecommons.org/licenses/by/4.0/)
Hypertension
Hypertension or high blood pressure is a modifiable risk factor (Noubiap et al., 2017) associated with an increased risk of stroke, cardiovascular disease and death (Brunstrom & Carlberg, 2018; World Heart Federation, 2017). Children who are overweight or obese or do less physical activity are at a higher risk of hypertension (Karatzi et al., 2018; Larkins, Teixeira-Pinto, & Craig, 2018). High blood pressure in children is concerning because it is likely to continue into adulthood and is associated with damage to the heart at an early point in life (Theodore et al., 2015). It has been estimated that more than one in 10 Australian children aged 5–17 years (13%) have elevated or high blood pressure – 7% have pre-hypertension (elevated blood pressure) and 6% have hypertension (high blood pressure) (Larkins et al., 2018).
In the Child Health CheckPoint, children’s blood pressure was measured at the ‘Heart Lab’ station (Box 3.7). Three per cent of children had pre-hypertension and 4% had hypertension. Differences in the percentages of children with pre-hypertension or hypertension were observed according to parent education (Figure 3.3). Around one in 10 children (9%) with hypertension reported both parents did not have a degree, compared to around one in 25 children (4%) who reported that one or both parents had a degree. Socio-economic differences in another cardiovascular measure, carotid intima-media thickness, have also been found using Child Health CheckPoint data (Liu et al., 2019). Other research has shown that higher parent education or higher socio-economic status is associated with lower blood pressure (Larkins et al., 2018; Shi, de Groh, & Morrison, 2012).
In CheckPoint, there was a substantial difference in the proportion of children with hypertension or pre-hypertension, according to whether or not they were overweight or obese. Around one in six children (16%) who were overweight or obese had either pre-hypertension or hypertension, compared to around one in 25 (4%) who were underweight or of a normal weight.
Box 3.7: Hypertension – ‘Heart Lab’ station
| Domain | Subdomains | Measurement | Outcome(s) | |
|---|---|---|---|---|
|
|
Cardiovascular health | Blood pressure | Pulse wave analysis (PWA) using a blood pressure cuff wrapped around the right upper arm | Systolic and/or diastolic brachial hypertension status that was converted to a standardised z-score and percentile,1 based on age, sex and height. |
Note: 1These percentiles were created using normative data from a sample of children in the United States (National High Blood Pressure Education Program Working Group on High Blood Pressure in Children and Adolescents, 2004).
LSAC children were divided into one of two categories:
- not hypertensive
- pre-hypertensive/hypertensive (scoring at the 90th or higher percentile for systolic and/or diastolic blood pressure).
Figure 3.3: Percentage of children with pre-hypertension or hypertension, by key demographic characteristics
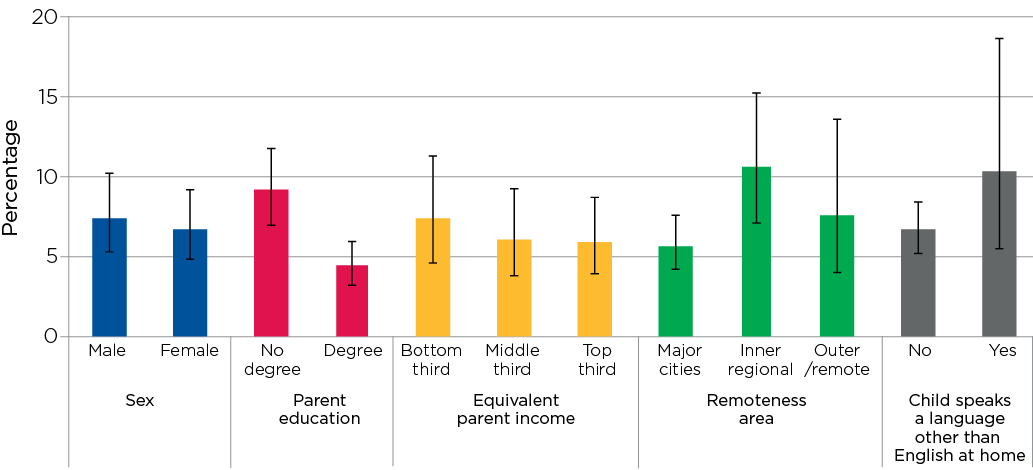
Notes: 95% confidence intervals are shown by the ‘I’ bars at the top of each column. Where confidence intervals for the groups being compared do not overlap, this indicates that the differences in values are statistically significant. n = 1,776 for sex, remoteness area and language other than English at home; n = 1,768 for parent education and n = 1,535 for equivalised parent income. Hypertension, sex and remoteness area were obtained from the CheckPoint dataset, and parent education, equivalised parent income and language other than English at home were obtained from LSAC Wave 6. Parent education was defined according to (i) whether one or both parents had a degree or (ii) neither parent had a degree. Equivalised parent income is the combined income of resident parents, adjusted for the number of people in the family using an equivalising factor of 1 for the first adult + 0.5 for all other adults (over 15) in the immediate family + 0.3 for all children under the age of 15.
Source: CheckPoint dataset, weighted
Credit: Longitudinal Study of Australian Children 2019 (creativecommons.org/licenses/by/4.0/)
Hearing
Hearing loss can be caused by genetic factors, prenatal exposure to infectious disease, trauma, disease (e.g. obesity, cardiovascular disease, diabetes and meningitis), and exposure to noise (such as a one-time exposure to an extremely loud noise or repeated or continuous exposure to loud sounds). Hearing loss can be classified as slight (16–25 decibels (dB) hearing loss) through to profound (greater than 90dB loss).3 Substantial hearing loss at the upper end of this spectrum may lead to difficulties for children at school and in social settings, and children with hearing loss often report reduced quality of life, lower self-esteem and decreased motor skills (Rajendran, Roy, & Jeevanantham, 2012; Theunissen et al., 2014). Slight or mild hearing loss may have fewer implications for everyday life in childhood but may progress to greater hearing loss or indicate the first stage of age-related hearing loss.
Children’s hearing was assessed at the ‘Listen Up’ station in the Child Health CheckPoint and any hearing loss in one or both ears, from slight to profound, was determined (Box 3.8).
The Child Health CheckPoint data show that around 14% of children had any hearing impairment in one ear and one in 10 children had a hearing impairment in both ears. This finding compares to previous research on hearing loss in a wide range of countries reporting that around 13% of children 18 years and younger have at least slight hearing loss in both ears within the speech frequencies (Wang et al., 2019b).
More children who spoke a language other than English at home, compared to those who only spoke English at home, had a hearing impairment in one or both ears (49% vs 21%) (Figure 3.4). This difference may be a reflection of known disparities in the prevalence of unilateral hearing loss between different ethnic groups (Su & Chan, 2017).
Box 3.8: Hearing – The ‘Listen Up’ station
| Domain | Measurement | Outcome(s) | |
|---|---|---|---|

|
Hearing | Air-conduction Pure Tone Audiometry (PTA) | Hearing thresholds at different frequencies (1, 2, 4 and 8 kilohertz (kHz)) were tested.
Slight to profound hearing impairment (hearing thresholds ≥16 dB hearing loss in one or both ears) was derived from threshold data. Hearing impairment was based on the three-frequency pure tone average or ‘Fletcher Index’ because of its relevance to the speech spectrum (i.e. 1, 2 and 4 kHz). |
Children were divided into one of three categories:
- no hearing loss
- slight to profound hearing impairment in one ear
- slight to profound hearing impairment in both ears.
In Figure 3.4, two of these categories were combined: 'slight to profound hearing impairment in one ear' and 'slight to profound hearing impairment in both ears'.
Figure 3.4: Percentage of children with slight to profound hearing impairment in one or both ears, by key demographic characteristics
Notes: 95% confidence intervals are shown by the ‘I’ bars at the top of each column. Where confidence intervals for the groups being compared do not overlap, this indicates that the differences in values are statistically significant. n = 1,488 for sex, remoteness area and language other than English at home; n = 1,481 for parent education and n = 1,285 for equivalised parent income. Hearing, sex and remoteness area were obtained from the CheckPoint dataset, and parent education, equivalised parent income and language other than English at home were obtained from LSAC Wave 6. Parent education was defined according to (i) whether one or both parents had a degree or (ii) neither parent had a degree. Equivalised parent income is the combined income of resident parents, adjusted for the number of people in the family using an equivalising factor of 1 for the first adult + 0.5 for all other adults (over 15) in the immediate family + 0.3 for all children under the age of 15.
Source: CheckPoint dataset, weighted
Credit: Longitudinal Study of Australian Children 2019 (creativecommons.org/licenses/by/4.0/)
Vision
The degree of visual impairment ranges from near-normal vision/mild impairment (some difficulty reading street signs or newspaper print) through moderate visual impairment (difficulty reading large print text or loss of facial feature discrimination) to total impairment (blindness) (Welp, Woodbury, McCoy, & Teutsch, 2016). Vision problems can affect a young person’s mobility, independence, quality of life and performance or engagement at school (Welp et al., 2016). Identification and treatment of vision impairments with proper visual acuity screenings, preventive eye-care services and proper eye-protection practices may be of great help to children. In the Child Health CheckPoint, children’s sharpness or clarity of vision, or visual acuity (VA),4 was measured at the ‘See Here’ station (Box 3.9).
In LSAC’s Child Health CheckPoint, 12% of children aged 11–12 years had a visual impairment in one or both eyes. This is consistent with previous research on Australian children that found that around 11% of 12 year olds had mild or worse visual impairment in one or both eyes. Of these cases, 18% were non-correctable with glasses or contact lenses (Robaei, Huynh, Kifley, & Mitchell, 2006), which is of concern because non-correctable visual impairment has been shown to reduce quality of life in adults, even when the impairment is mild (Chia et al., 2004).
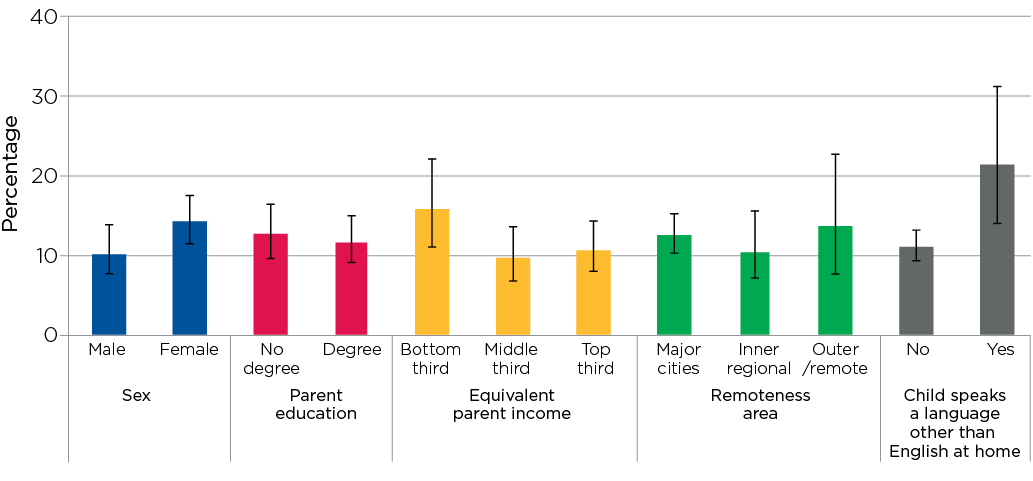
More children who spoke a language other than English at home, compared to those who only spoke English at home, had a visual impairment (21% vs 11%) (Figure 3.5). This difference could be due to known differences in the prevalence of vision problems between ethnic groups (Theophanous et al., 2018; Xiao, Morgan, Ellwein, & He, 2015).
Box 3.9: Vision – The ‘See Here’ station
| Domain | Subdomains | Measurement | Outcome(s) | |
|---|---|---|---|---|
|
|
Vision | Visual acuity (VA) | Computerised adaptive Freiburg Visual Acuity and Contrast Test (FrACT 3.8.2) (Bach, 2007) | Visual acuity was tested for each eye separately, without glasses with VA scores calculated for each eye. |
Children were divided into two categories for visual acuity:
- no visual impairment
- any visual impairment (in one or both eyes).
Figure 3.5: Percentage of children with a visual impairment in one or both eyes, by key demographic characteristics
Notes: 95% confidence intervals are shown by the ‘I’ bars at the top of each column. Where confidence intervals for the groups being compared do not overlap, this indicates that the differences in values are statistically significant. n = 1,486 for sex, remoteness area and language other than English at home; n = 1,479 for parent education and n = 1,284 for equivalised parent income. Vision, sex and remoteness area were obtained from the CheckPoint dataset, and parent education, equivalised parent income and language other than English at home were obtained from LSAC Wave 6. Parent education was defined according to (i) whether one or both parents had a degree or (ii) neither parent had a degree. Equivalised parent income is the combined income of resident parents, adjusted for the number of people in the family using an equivalising factor of 1 for the first adult + 0.5 for all other adults (over 15) in the immediate family + 0.3 for all children under the age of 15.
Source: CheckPoint dataset, weighted
Credit: Longitudinal Study of Australian Children 2019 (creativecommons.org/licenses/by/4.0/)
3.3 Wellbeing
Wellbeing is characterised by the psychological, cognitive, social and physical functioning and capabilities that children need to live a happy and fulfilling life (Organisation for Economic Cooperation and Development [OECD], 2017), and is strongly related to physical health (Gu, Chang, & Solmon, 2016; Poitras et al., 2016). Children who experience physical health problems often report feeling that their wellbeing and quality of life are reduced (Anderson et al., 2017; Varni, Seid, & Kurtin, 2001; Wang et al., 2019a).
The Child Health CheckPoint data showed that there were some differences in certain aspects of the wellbeing of children according to dietary indicators, physical activity and physical health markers described in this chapter (Table 3.3):
Box 3.10: General wellbeing – The ‘Sit and Click’ station
| Domain | Measure |
|---|---|
|
|
The Generic Core Scale of the Paediatric Health Related Quality of Life Inventory (PedsQL) V.4.0. (Varni et al., 2001) was used to assess general wellbeing, physical and psychological functioning. For each scale, response options on a five-point scale, ranging from never to almost always, were transformed to a 0–100 scale, with higher scores indicating higher wellbeing. |
General wellbeing
Study children were asked how much each of the following statements sounded like them in the last month:
- I feel happy.
- I feel good about myself.
- I feel good about my health.
- I get support from my family or friends.
- I think good things will happen to me.
- I think my health will be good in the future.
Physical functioning
Study children were asked how often the following activities have been difficult for them in the last month:
- walk about 100 metres
- run
- play sport or do exercise
- lift something heavy
- have a bath or shower by myself
- help around the house.
As well as how often they:
- get aches and pains
- have low energy.
Psychosocial functioning
Study children were asked how often a series of activities relating to how difficult emotional, social and school functioning have been for them in the last month. For example:
- I feel afraid.
- I have trouble sleeping.
- I have trouble getting along with other kids.
- other kids do not want to be my friend.
- it is hard to pay attention in class.
- I have trouble keeping up with my school work.
Notes: * Statistically significant difference between categories for a particular health measure at p < 0.05 level. Where 95% confidence intervals for the groups being compared do not overlap, this indicates that the differences in values are statistically significant.
Source: CheckPoint dataset, weighted
Diet and physical activity
There were small to moderate differences in the mean levels of general wellbeing between children who did not meet the guidelines for physical activity on weekends or fruit consumption or who skipped breakfast at least four times a week and other children (approximately 0.1 to 0.4 standard deviation (SD) lower for those who did not meet the guidelines for physical activity on weekends and fruit consumption or who skipped breakfast at least four times a week; Table 3.3, second column). While Table 3.3 shows some statistically significant differences, it is worth noting that no other factors have been taken into account and further research is required to establish the causal relationship (if any) between the variables. For instance, while it is plausible that physical activity leads to greater wellbeing and psychosocial functioning, the reverse case, in which poor psychosocial functioning (in the form of stress and lack of sleep, for example) leads to reduced physical activity, is also possible.
There were small differences in the mean levels of physical functioning between children who did not eat a regular breakfast or eat enough fruit, or who drank four or less cups of water a day and other children (approximately 0.3 SD lower for those did not eat a regular breakfast or eat enough fruit, or who drank four or less cups of water a day) (Table 3.3, third column). These findings highlight the importance of a healthy diet for growth and physical capabilities (Department of Health & Human Services, 2012). There were also small differences in the mean levels of physical functioning between children who did and did not meet the guidelines for physical activity on weekdays or weekends (approximately 0.2 SD lower for those who did not meet the guidelines for physical activity; Table 3.3, third column).
There were small to medium differences in the mean levels of psychosocial functioning between children who did not eat breakfast or enough fruit and those who did (approximately 0.4 SD lower for children who did not eat breakfast or enough fruit) (Table 3.3, fourth column). These results suggest that a poor diet affects emotional and social aspects of children's lives. There were also small differences in the mean levels of psychosocial functioning between children who did and did not meet the guidelines for physical activity on weekends (approximately 0.2 SD lower for those who did not meet the guidelines for physical activity; Table 3.3, fourth column).
Physical health markers
There were small differences in the mean levels of general wellbeing and physical functioning between children who were overweight or obese and those who were not overweight (approximately 0.3 SD lower for overweight or obese children). This result is supported by a large body of literature, which demonstrates that obesity is associated with poorer mental health, low HRQoL and psychological problems (Anderson et al., 2017; Tevie & Shaya, 2015), with one study showing that the reduction in HRQoL among severely obese 5–18 year olds was comparable to that of children diagnosed with cancer (Schwimmer, Burwinkle, & Varni, 2003).
There were no differences in general wellbeing, physical functioning or psychosocial functioning, according to hypertension status, vegetable consumption,5 hearing or vision status. It should also be noted that while regular breakfast consumption was associated with greater wellbeing, this did not account for breakfast quality, only frequency of consumption, and research suggests that the quality may change this relationship (Ferrer-Cascales et al., 2018).
Summary
In 2015 and 2016, a sub-sample of the LSAC study population completed the Child Health CheckPoint, a one-off comprehensive physical health assessment, involving objective physical measurements and child and parent self-report. This chapter has used CheckPoint data to provide a picture of the physical health of Australian children at age 11-12.
The data showed that large numbers of Australian children at this age did not meet current recommendations for diet and physical activity. The chapter shows that diet and physical activity are linked to wellbeing. These findings confirm data published by the AIHW (2018a), highlighting the need for renewed strategies into effective policies and programs focusing on the health and wellbeing of children and adolescents that support their access to healthy foods and physical activity.
There is a growing understanding of how social, economic and cultural factors influence a child’s diet and physical activity. Attempts to simply ‘educate’ individuals about the importance of health behaviours for long-term health are likely to have minimal impact if they are not embedded in a broader framework of structural policy changes (World Health Organization, 1986). For example, educational approaches alone have been ineffective in curbing the obesity epidemic (Gill & Boylan, 2012; Wake, 2018).
Supporting concerns raised by public health researchers for many years (Ng et al., 2014), the Child Health CheckPoint found that almost three in 10 Australian children were overweight or obese. Overweight and obese children reported lower levels of wellbeing and physical functioning on average than their normal or underweight peers and they were also substantially more likely to have hypertension or pre-hypertension. The negative long-term effects of being overweight or obese in childhood, and the related economic cost, make this issue a public health priority (e.g. Black, Hughes, & Jones, 2018). The higher prevalence of being overweight or obese in groups with lower levels of income and education suggests that policy efforts might be directed more towards addressing the effect of structural inequalities, although the high rates of being overweight or obese in the most advantaged groups (around one in five children) suggest universal efforts are also required.
Figure 3.6: 92% of children were not meeting the recommendation of eating at least five serves of vegetables a day
Credit: Longitudinal Study of Australian Children 2019 (creativecommons.org/licenses/by/4.0/)
Also of interest, the CheckPoint data showed that 24% of children had a hearing impairment and 12% had a vision impairment, although this had no significant effect on wellbeing. This may be due to ongoing advances in corrective technologies and devices, although future research could explore the implications of hearing and vision impairments on learning and schooling.
The Child Health CheckPoint has generated a valuable resource for researchers and policy makers, providing data on diet, physical activity and a range of physical health markers, including those presented in this chapter. These provide an important overview of the physical health and wellbeing of Australia’s 11–12 year olds and information on the likelihood of future health issues developing later in life. There are many avenues for further research to investigate possible mechanisms or pathways by which structural, demographic, behavioural and social factors contribute to differences in these health measures (Clifford et al., 2019; Wake et al., 2014). Given the breadth of the Child Health CheckPoint dataset, additional research could examine some of the other health markers measured in this study. Further data collected in LSAC as this cohort of children grows older can be used to determine how the measures collected in the CheckPoint relate to good or poor health and social outcomes at later stages of life.
References
- Ahn, S., & Fedewa, A. L. (2011). A meta-analysis of the relationship between children’s physical activity and mental health. Journal of Pediatric Psychology, 36(4), 385–397.
- Anderson, Y. C., Wynter, L. E., Treves, K. F., Grant, C. C., Stewart, J. M., Cave, T. L. et al. (2017). Assessment of health-related quality of life and psychological well-being of children and adolescents with obesity enrolled in a New Zealand community-based intervention programme: An observational study. BMJ Open, 7(8), e015776.
- Australian Institute of Health and Welfare (AIHW). (2017a). Data tables: Overweight and obesity in Australia: A birth cohort analysis. Canberra: AIHW. Retrieved from www.aihw.gov.au/reports/overweight-obesity/overweight-obesity-australia-...
- AIHW. (2017b). Overweight and obesity in Australia: A birth cohort analysis (Cat. no. PHE 215). Canberra: AIHW.
- AIHW. (2018a). Australia’s health 2018 (Australia’s health series no. 16. AUS 221). Canberra: AIHW.
- AIHW. (2018b). Physical activity across the life stages (Cat. No. PHE 225). Canberra: AIHW.
- AIHW. (2019). Physical activity across the life stages, Data – Australian Institute of Health and Welfare. Canberra: AIHW. Retrieved from https://www.aihw.gov.au/reports/physical-activity/physical-activity-acro...
- Bach, M. (2007). The Freiburg Visual Acuity Test-variability unchanged by post-hoc re-analysis. Graefe’s Archive for Clinical and Experimental Ophthalmology, 245(7), 965–971.
- Bell, L., Ullah, S., Olds, T., Magarey, A., Leslie, E., Jones, M. et al. (2016). Prevalence and socio-economic distribution of eating, physical activity and sedentary behaviour among South Australian children in urban and rural communities: baseline findings from the OPAL evaluation. Public Health, 140, 196–205.
- Bere, E., Brug, J., & Klepp, K. I. (2008). Why do boys eat less fruit and vegetables than girls? Public Health Nutrition, 11(3), 321–325.
- Black, N., Hughes, R., & Jones, A. M. (2018). The health care costs of childhood obesity in Australia: An instrumental variables approach. Economics and Human Biology, 31, 1–13.
- Brophy, S., Cooksey, R., Gravenor, M. B., Mistry, R., Thomas, N., Lyons, R. A., & Williams, R. (2009). Risk factors for childhood obesity at age 5: Analysis of the millennium cohort study. BMC Public Health, 9, 467–473.
- Brunstrom, M., & Carlberg, B. (2018). Association of blood pressure lowering with mortality and cardiovascular disease across blood pressure levels: A systematic review and meta-analysis. JAMA Internal Medicine, 178(1), 28–36.
- Chia, E. M., Wang, J. J., Rochtchina, E., Smith, W., Cumming, R. R., & Mitchell, P. (2004). Impact of bilateral visual impairment on health-related quality of life: The Blue Mountains Eye Study. Investigative Opthalmology & Visual Science, 45(1), 71–76.
- Clifford, S., Davies, S., Gillespie, A., Lange, K., & Wake, M. (2018). Longitudinal Study of Australian Children’s Child Health CheckPoint Data User Guide – March 2018. Melbourne: Murdoch Children’s Research Institute. doi: 10.25374/MCRI.5687590
- Clifford, S. A., Davies, S., & Wake, M. (2019). Child Health CheckPoint: Cohort summary and methodology of a physical health and biospecimen module for the Longitudinal Study of Australian Children. BMJ Open, 9(Suppl 3), 3–22.
- Cole, T. J., & Lobstein, T. (2012). Extended international (IOTF) body mass index cut-offs for thinness, overweight and obesity. Pediatric Obesity, 7(4), 284–294.
- Department of Health. (2019). Australia’s physical activity and sedentary behaviour guidelines and the Australian 24-hour movement guidelines. Canberra: Department of Health. Retrieved from www.health.gov.au/internet/main/publishing.nsf/Content/health-pubhlth-st...
- Department of Health and Human Services. (2011). Fruit and vegetables – Better Health Channel. Melbourne: Department of Health and Human Services, State Government of Victoria. Retrieved from www.betterhealth.vic.gov.au/health/healthyliving/fruit-and-vegetables
- Department of Health and Human Services. (2012). Breakfast – Better Health Channel. Melbourne: Department of Health and Human Services. Retrieved from www.betterhealth.vic.gov.au/health/healthyliving/breakfast
- Department of Health and Human Services. (2014). Water: a vital nutrient – Better Health Channel. Melbourne: Department of Health and Human Services. Retrieved from www.betterhealth.vic.gov.au/health/healthyliving/water-a-vital-nutrient
- Dollman, J., Maher, C., Olds, T. S., & Ridley, K. (2012). Physical activity and screen time behaviour in metropolitan, regional and rural adolescents: A sectional study of Australians aged 9–16 years. Journal of Science and Medicine in Sport, 15(1), 32–37.
- Drewnowski, A., Rehm, C. D., & Constant, F. (2013). Water and beverage consumption among children age 4–13y in the United States: Analyses of 2005–2010 NHANES data. Nutrition Journal, 12, 85.
- Edwardson, C. L., Gorely, T., Pearson, N., & Atkin, A. (2013). Sources of activity-related social support and adolescents’ objectively measured after-school and weekend physical activity: Gender and age differences. Journal of Physical Activity & Health, 10(8), 1153–1158.
- Ferrer-Cascales, R., Sánchez-SanSegundo, M., Ruiz-Robledillo, N., Albaladejo-Blázquez, N., Laguna-Pérez, A., & Zaragoza-Martí, A. (2018). Eat or Skip Breakfast? The Important Role of Breakfast Quality for Health-Related Quality of Life, Stress and Depression in Spanish Adolescents. International Journal Of Environmental Research And Public Health, 15(8).
- Gasser, C. E., Mensah, F. K., Kerr, J. A., & Wake, M. (2017). Early life socioeconomic determinants of dietary score and pattern trajectories across six waves of the Longitudinal Study of Australian Children. Journal of Epidemiology and Community Health, 71(12), 1152–1160.
- Gill, T. P., & Boylan, S. (2012). Public Health Messages: Why Are They Ineffective and What Can Be Done? Current Obesity Reports, 1(1), 50–58.
- Gu, X., Chang, M., & Solmon, M. A. (2016). Physical activity, physical fitness, and health-related quality of life in school-aged children. Journal of Teaching in Physical Education, 35(2), 117–126.
- Harris, K. M., King, R. B., & Gordon-Larsen, P. (2005). Healthy Habits among Adolescents: Sleep, Exercise, Diet, and Body Image. In K. A. Moore, & L. Lippman (Eds.), What do children need to flourish?: conceptualizing and measuring indicators of positive development. Boston, MA: Springer.
- Jasik, C. B., & Lustig, R. H. (2008). Adolescent obesity and puberty: The “perfect storm”. Annals of the New York Academy of Sciences, 1135, 265–279.
- Jomaa, L., Hwalla, N., Constant, F., Naja, F., & Nasreddine, L. (2016). Water and Beverage Consumption among Children Aged 4–13 Years in Lebanon: Findings from a National Cross-Sectional Study. Nutrients, 8(9), 554.
- Kantomaa, M. T., Tammelin, T. H., Nayha, S., & Taanila, A. M. (2007). Adolescents’ physical activity in relation to family income and parents’ education. Preventive Medicine, 44(5), 410–415.
- Karatzi, K., Moschonis, G., Botelli, S., Androutsos, O., Chrousos, G. P., Lionis, C., & Manios, Y. (2018). Physical activity and sedentary behavior thresholds for identifying childhood hypertension and its phenotypes: The Healthy Growth Study. Journal of the American Society of Hypertension : JASH, 12(10), 714–722.
- Larkins, N. G., Teixeira-Pinto, A., & Craig, J. C. (2018). The prevalence and predictors of hypertension in a national survey of Australian children. Blood Pressure, 27(1), 41–47.
- Liu, R. S., Dunn, S., Grobler, A. C., Lange, K., Becker, D., Goldsmith, G. et al. (2019). Carotid artery intima–media thickness, distensibility and elasticity: population epidemiology and concordance in Australian children aged 11–12 years old and their parents. BMJ Open, 9(Suppl 3), 23.
- National Health and Medical Research Council. (2013). Australian Dietary Guidelines. Canberra: NHMRC.
- NHMRC, Australian Government Department of Health and Ageing, & New Zealand Ministry of Health. (2006). Nutrient Reference Values for Australia and New Zealand. Canberra: NHMRC.
- National High Blood Pressure Education Program Working Group on High Blood Pressure in Children and Adolescents (2004). The fourth report on the diagnosis, evaluation, and treatment of high blood pressure in children and adolescents. Pediatrics, 114(2 Suppl), 555–576.
- National Rural Health Alliance. (2014). Hearing loss in rural Australia. Deakin West, ACT: National Rural Health Alliance. Retrieved from www.ruralhealth.org.au/sites/default/files/publications/nrha-factsheet-h...
- Ng, M., Fleming, T., Robinson, M., Thomson, B., Graetz, N., Margono, C. et al. (2014). Global, regional, and national prevalence of overweight and obesity in children and adults during 1980-2013: A systematic analysis for the Global Burden of Disease Study 2013. Lancet, 384(9945), 766–781.
- Noubiap, J. J., Essouma, M., Bigna, J. J., Jingi, A. M., Aminde, L. N., & Nansseu, J. R. (2017). Prevalence of elevated blood pressure in children and adolescents in Africa: A systematic review and meta-analysis. The Lancet. Public Health, 2(8), e375–e386.
- OECD. (2017). PISA 2015 Results (Volume III): Students’ Well-Being. Paris: OECD Publishing.
- Patton, G. C., Sawyer, S. M., Santelli, J. S., Ross, D. A., Afifi, R., Allen, N. B. et al. (2016). Our future: A Lancet commission on adolescent health and wellbeing. The Lancet, 387(10036), 2423–2478.
- Phillips, L. R. S., Parfitt, G., & Rowlands, A. V. (2013). Original research: Calibration of the GENEA accelerometer for assessment of physical activity intensity in children. Journal of Science and Medicine in Sport, 16, 124–128.
- Poitras, V. J., Gray, C. E., Borghese, M. M., Carson, V., Chaput, J. P., Janssen, I. et al. (2016). Systematic review of the relationships between objectively measured physical activity and health indicators in school-aged children and youth. Applied Physiology, Nutrition, and Metabolism = Physiologie Appliquée, Nutrition et Métabolisme, 41(6 Suppl 3), S197–S239.
- Rajendran, V., Roy, F. G., & Jeevanantham, D. (2012). Postural control, motor skills, and health-related quality of life in children with hearing impairment: A systematic review. European Archives of Oto-Rhino-Laryngology, 269(4), 1063–1071.
- Rampersaud, G. C., Pereira, M. A., Girard, B. L., Adams, J., & Metzl, J. D. (2005). Breakfast habits, nutritional status, body weight, and academic performance in children and adolescents. Journal of the American Dietetic Association, 105(5), 743–760.
- Rasmussen, M., Krolner, R., Klepp, K. I., Lytle, L., Brug, J., Bere, E., & Due, P. (2006). Determinants of fruit and vegetable consumption among children and adolescents: A review of the literature. Part I: Quantitative studies. The International Journal of Behavioral Nutrition and Physical Activity, 3, 22–41.
- Robaei, D., Huynh, S. C., Kifley, A., & Mitchell, P. (2006). Correctable and non-correctable visual impairment in a population-based sample of 12-year-old Australian children. American Journal of Ophthalmology, 142(1), 112–118.
- Sanders, R. H., Han, A., Baker, J. S., & Cobley, S. (2015). Childhood obesity and its physical and psychological co-morbidities: A systematic review of Australian children and adolescents. European Journal of Pediatrics, 174(6), 715–746.
- Schwimmer, J. B., Burwinkle, T. M., & Varni, J. W. (2003). Health-Related Quality of Life of Severely Obese Children and Adolescents. JAMA, 289(14), 1813–1819.
- Shi, Y., de Groh, M., & Morrison, H. (2012). Increasing blood pressure and its associated factors in Canadian children and adolescents from the Canadian Health Measures Survey. BMC Public Health, 12, 388.
- Su, B. M., & Chan, D. K. (2017). Prevalence of Hearing Loss in US Children and Adolescents: Findings From NHANES 1988–2010. JAMA Otolaryngology Head & Neck Surgery, 143(9), 920–927.
- Szajewska, H., & Ruszczynski, M. (2010). Systematic review demonstrating that breakfast consumption influences body weight outcomes in children and adolescents in Europe. Critical Reviews in Food Science & Nutrition, 50(2), 113–119.
- Telford, R. M., Telford, R. D., Olive, L. S., Cochrane, T., & Davey, R. (2016). Why Are Girls Less Physically Active than Boys? Findings from the LOOK Longitudinal Study. PLoS ONE, 11(3), e0150041.
- Tevie, J., & Shaya, F. T. (2015). Association between mental health and comorbid obesity and hypertension among children and adolescents in the US. European Child & Adolescent Psychiatry, 24(5), 497–502.
- Theodore, R. F., Broadbent, J., Nagin, D., Ambler, A., Hogan, S., Ramrakha, S. et al. (2015). Childhood to early-midlife systolic blood pressure trajectories: Early-life predictors, effect modifiers, and adult cardiovascular outcomes. Hypertension, 66(6), 1108–1115.
- Theophanous, C., Modjtahedi, B. S., Batech, M., Marlin, D. S., Luong, T. Q., & Fong, D. S. (2018). Myopia prevalence and risk factors in children. Clinical Ophthalmology, 12, 1581–1587.
- Theunissen, S. C., Rieffe, C., Netten, A. P., Briaire, J. J., Soede, W., Kouwenberg, M., & Frijns, J. H. (2014). Self-esteem in hearing-impaired children: The influence of communication, education, and audiological characteristics. PLoS One, 9(4), e94521.
- Tonnessen, E., Svendsen, I. S., Olsen, I. C., Guttormsen, A., & Haugen, T. (2015). Performance development in adolescent track and field athletes according to age, sex and sport discipline. PLoS One, 10(6), e0129014.
- van Ansem, W. J., Schrijvers, C. T., Rodenburg, G., & van de Mheen, D. (2014). Maternal educational level and children’s healthy eating behaviour: Role of the home food environment (cross-sectional results from the INPACT study). The International Journal of Behavioral Nutrition and Physical Activity, 11, 113.
- Varni, J. W., Seid, M., & Kurtin, P. S. (2001). Peds-QL 4.0: Reliability and validity of the Pediatric Quality of Life Inventory version 4.0 generic core scales in healthy and patient populations. Medical Care, 39(8), 800–812.
- Viner, R. M., Ozer, E. M., Denny, S., Marmot, M., Resnick, M., Fatusi, A., & Currie, C. (2012). Adolescence and the social determinants of health. The Lancet, 379(9826), 1641–1652.
- Wake, M. (2018). The failure of anti-obesity programmes in schools. BMJ, 360, k507.
- Wake, M., Clifford, S., York, E., Mensah, F., Gold, L., Burgner, D., & Davies, S. (2014). Introducing Growing Up in Australia’s Child Health Checkpoint: A physical health and biomarkers module for the Longitudinal Study of Australian Children. Family Matters, 95, 15–23.
- Wang, J., Quach, J., Sung, V., Carew, P., Edwards, B., Grobler, A. et al. (2019a). Academic, behavioural and quality of life outcomes of slight to mild hearing loss in late childhood: A population-based study. Archives of Disease in Childhood. doi: 10.1136/archdischild-2019-316917
- Wang, J., Sung, V., Carew, P., Burt, R. A., Liu, M., Wang, Y. et al. (2019b). Prevalence of childhood hearing loss and secular trends: A systematic review and meta-analysis. Academic Pediatrics, 19(5), 504–514.
- Watson, A., Timperio, A., Brown, H., Best, K., & Hesketh, K. D. (2017). Effect of classroom-based physical activity interventions on academic and physical activity outcomes: A systematic review and meta-analysis. The International Journal of Behavioral Nutrition and Physical Activity, 14(1), 114.
- Welp, A., Woodbury, R. B., McCoy, M. A., & Teutsch, S. M. (Eds.). (2016). Making eye health a population health imperative: Vision for tomorrow. Washington, DC: The National Academies Press (US).
- World Health Organization. (1986). The Ottawa Charter for Health Promotion. Geneva, Switzerland: WHO. Retrieved from www.who.int/healthpromotion/conferences/previous/ottawa/en/
- World Health Organization. (2014). Health for the world’s adolescents: a second chance in the second decade: summary. Geneva, Switzerland: WHO.
- World Heart Federation. (2017). Stroke and hypertension – World Heart Federation. Geneva, Switzerland: World Heart Federation. Retrieved from www.world-heart-federation.org/resources/stroke-and-hypertension/
- Xiao, O., Morgan, I. G., Ellwein, L. B., & He, M. (2015). Prevalence of amblyopia in school-aged children and variations by age, gender, and ethnicity in a multi-country refractive error study. Ophthalmology, 122(9), 1924–1931.
1 Details around duration and quality of sleep among 6–17 year olds are presented in chapter 4 of the current edition.
2 Forty-four per cent of Australian children are drinking three or less cups of water per day and 6% are drinking one cup or less per day.
3 The term dB (decibel) and the dB scale are used worldwide for the measurement of sound levels. A soft whisper is around 30dB, ordinary conversation is around 60dB and city traffic is around 90dB.
4 Visual acuity is a measure reflecting the distance between the eye and object at the point where the object becomes blurry (Welp et al., 2016).
5 It is probable that no statistically significant difference in wellbeing was found between vegetable eaters and non-eaters due to the small numbers of children meeting vegetable consumption guidelines (less than eight per cent of the sample).
Acknowledgements
Disclaimer
In August 2021, the National Centre for Longitudinal Data (NCLD) alerted the authors to a significant error in the accelerometry data from the Child Health CheckPoint module of LSAC. Child Health CheckPoint discovered that accelerometry data were processed using incorrect cutpoints, resulting in the underestimating of light, moderate and vigorous PA, and the overestimating of sedentary time. This systematic error affects all derived children's accelerometry data from the CheckPoint cohort. As a result, AIFS have re-run analyses with the corrected data included in data release 9.1 C1 and updated the physical activity findings in this chapter. Further information about this data correction is available in the CheckPoint data issues paper.
Featured image: © GettyImages/monkeybusinessimages
Publication details
Download Publication
Share


