9. Shaping futures: School subject choice and enrolment in STEM
9. Shaping futures: School subject choice and enrolment in STEM
Choosing school subjects is a pivotal decision for students in Years 11 and 12 because of the difference it makes to education and training pathways and future employment opportunities (Altonji, Blom, & Meghir, 2012; Joensen & Nielsen, 2012). For example, students who participate in particular subjects or subject combinations that lead to vocational education and training (VET) are more likely to enter the labour market without any further formal education or training (Thomson, 2005). On the other hand, students who choose other combinations of subjects, including Advanced Maths, Science and Social Sciences, are more likely to enter higher education courses - and higher education is often related to higher earning capacity (Joensen & Nielsen, 2012; Rose & Betts, 2004).
Subject choices in senior secondary school have been shown to be influenced by a range of personal and family factors. For example, students may have aspirations for future career and post-school education or training (Watt et al., 2012) that can be influenced by their self-perceived ability, talents and school achievements (Britner & Pajares, 2006; Louis & Mistele, 2012). Parental encouragement and language background have also been shown to influence subject choice (Ainley & Ainley, 2011; Fullarton & Ainley, 2000; Fullarton, Walker, Ainley, & Hillman, 2003).
Students' choices have been found to differ according to their families' socio-economic status (Shavit & Müler, 2000). Schools in regional and remote areas often have restricted subject choices compared to schools in major cities; and those in more advantaged schools may have a wider range of subjects to choose from than those in less advantaged schools (Sullivan, Perry, & McConney, 2013).
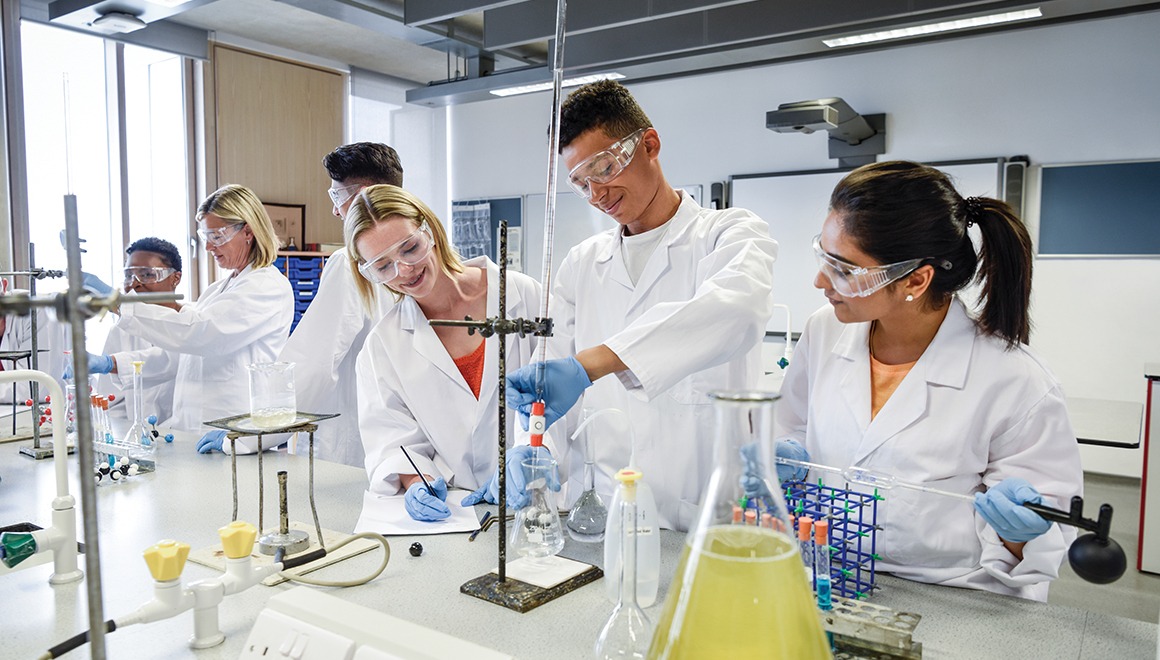
In particular, gender has been shown to strongly influence school subject choice, with boys more likely to participate in Advanced Maths, Physics and Chemistry, and girls more likely to participate in Biology and Health subjects (Fullarton et al., 2003; Riegle-Crumb & King, 2010). Evidence also shows that women are under-represented in tertiary education and high-paying jobs in Science, Technology, Engineering and Maths (STEM), and this gender imbalance can be traced back to students' choice of STEM subjects in secondary school (Ingrid, Andy, & Peter, 2007; Justman & Méndez, 2016; Lamb, Jackson, Walstab, & Huo, 2015).
School sector and type may also limit the availability of subjects on offer for students, potentially restricting choices. The school curriculum may differ depending on the school sector, as a result of differences in the teaching staff, facilities, and the amount and sources of funding the school receives. Students who attend single-sex schools, especially girls, have been shown to be more confident in taking male-dominated subjects such as Advanced Maths (Jeffrey, Forgasz, Leder, & Taylor, 2007; Mael, Alonso, Gibson, Rogers, & Smith, 2005).
This chapter uses the LSAC K cohort data from Wave 7, when children were 16-17 years old, to describe the patterns of subject selection by Year 11 and 12 students, with a particular focus on the individual, socio-economic and school characteristics of students selecting subjects in the Science, Technology and Engineering and Maths (STEM) study domain.
9.1 Subject choices in Years 11 and 12
Students in senior secondary schools in Australia have a variety of study options through which they can pursue their interests and build their skills. In Year 10, students select subjects they wish to study in Years 11 and 12 (Box 9.1). Different subject choices are often required for different educational and vocational pathways. If students wish to continue with tertiary education, they must choose academic subjects that count towards the Australian Tertiary Admission Rank (ATAR) - the primary criterion for entry into most university programs. Vocational Education and Training (VET) subjects are available for students wishing to do a trade, apprenticeship or traineeship; study at a registered training organisation; or enter the workforce after school.
Most 16-17 year olds (86%) were studying at a secondary school in 2016. Of those who were in secondary school the majority (71%) were in Year 11 and the remaining 29% were in Year 12.1
Students were typically enrolled in five or six academic subjects. Most were enrolled in an English subject and a Maths subject. Participation in these subjects is likely to be driven by the requirement for completing school and accessing university courses. For example, English is a compulsory subject in New South Wales and Victoria. In Queensland, students must meet literacy and numeracy requirements, which can be satisfied by completing at least one semester in both an English and Maths subject.
Participation rates differed markedly across subject areas (Table 9.1). For some subjects, there were significant differences in the percentages of boys and girls enrolled:
- More boys than girls participated in Advanced Maths (and Maths overall), Physics, Technology, Business and Finance.
- More girls than boys studied Biology, Creative Arts, Health, Psychology, Legal Studies and Society and Culture.
These results are consistent with previous studies of subject participation in senior secondary school, which showed that STEM subjects, such as Physics, Advanced Maths and Technology classes were dominated by boys (Ainley, Kos, & Nicholas, 2008; Fullarton et al., 2003).
Box 9.1: Subject choices in senior secondary school
In Wave 7 of LSAC, study participants in the K cohort (aged 16-17) were asked to name up to 10 Year 11 or Year 12 subjects they were studying at school. There is no common classification of Year 12 subjects in Australia (Thomson, 2005). For this chapter, responses were classified into eight study areas and 18 broad subject areas:
| Study area | Subject | Subject examples |
|---|---|---|
| English | English | English, English as a Second Language, Literature |
| Maths | Basic Maths | General Maths, Maths A |
| Intermediate Maths | Mathematical Methods, Mathematical Studies Stage 2 | |
| Advanced Maths | Specialist Maths | |
| Science | Chemistry Physics |
|
| Life and Earth sciences | Geology, Agriculture, Earth Science, Nutrition | |
| Technology and Engineering | Design Technology | Graphics, Textiles and Design |
| Information and Communication Technology (ICT) | Software Development, Computer Science | |
| Industrial Technology | Industrial Technology, Building Construction | |
| Engineering | ||
| Creative Arts | Art and Performance | Dance, Music, Drama, Theatre Studies |
| LOTE | Language other than English | French, German, Japanese, Chinese, Indonesian |
| Health and Physical Education | Physical Education | Physical Education, Outdoor Education, Sport |
| Health | Health Education, Personal Development | |
| Social Science | Business and Legal Studies | Economics, Business, Finance, Accounting, Legal Studies, Politics, Geography |
| Humanities | Ancient or Modern History, Religion, Psychology, Philosophy, Society and Culture |
VET in schools refers to subjects or programs taken as part of a senior secondary certificate that on completion provide credit towards a nationally recognised VET qualification. Students were also asked to indicate whether each of the subjects they listed was a VET subject.
Notes: Participation rates are based on students' enrolment in each subject. Students often enrolled in more than one subject in the same study area (e.g. two different Maths subjects). Therefore, the total percentages of each subject might exceed the overall percentage of enrolments in the study area. * Significant differences in the percentage of boys and girls enrolled (at the 5% significance level) are noted. # Estimate not reliable (cell count <20).
Source: LSAC Wave 7, K cohort, weighted
9.2 Factors influencing subject choice
There is a substantial body of evidence, including previous LSAC research, suggesting that the educational expectations and career aspirations of children are important factors in predicting their educational achievements (Baxter, 2017; Khattab, 2015; Yu & Daraganova, 2015). At age 14-15, when students were asked to think about the subjects they would study in Years 11 and 12, more boys than girls (17% vs 10%) said that they expected to get a trade or VET qualification; and more girls than boys said that they expected to complete an undergraduate degree (40% vs 32%). Similar proportions of boys (34%) and girls (36%) said that they expected to get a postgraduate degree (Table 9.2). Given less than 10% of Australians have postgraduate qualifications (Australian Bureau of Statistics [ABS], 2018), the observation that over a third of 14-15 year olds expected to reach this level of education is somewhat surprising. It is possible that LSAC respondents did not fully understand the distinction between undergraduate and postgraduate degrees or that these high proportions reflect the idealistic aspirations of students, which do not always align with realistic expectations (Khattab, 2015).
Career aspirations are an important consideration when choosing senior school subjects. However, LSAC data show that many 14-15 year olds (45%) still did not have a specific career that they aspired to (Table 9.2). Among those who did have a clear idea about their preferred career, there were some gender differences. For example, more boys than girls said they would like to be engineers, tradespeople or work in information and communication technology (ICT); while more girls than boys said they aspire to have a career as a health professional. These gender differences in career aspirations are likely to be reflected in school subject choices, at least to some extent.
Students tend to choose subjects that they are more proficient in (Fullarton & Ainley, 2000; Marks, 2013). For example, high performance in numeracy has been shown to be an important influence on participation in STEM subjects (Britner & Pajares, 2006; Louis & Mistele, 2012). The National Assessment Program - Literacy and Numeracy (NAPLAN) provides data on numeracy performance. According to the 2018 NAPLAN national report (Australian Curriculum Assessment and Reporting Authority, 2018), on average, boys have higher numeracy scores at all assessment points (Years 3, 5, 7 and 9) than girls.
Notes: *Indicates that the difference between the percentage of boys and girls is statistically significant at the 5% level.a Study children were asked: 'Looking ahead, how far do you think you will go with your education?' bStudy children were also asked: 'As things stand now, do you know what career or occupation you would like to have in the future?' Those who answered 'yes' to this question were asked to name their desired occupation.
Source: LSAC Wave 6, K cohort
| Boys | Girls | All | |
|---|---|---|---|
| Year 9 Numeracy scores | |||
| Mean | 616.9 | 603.4* | 610.1 |
| Total (n) | 1,029 | 1,069 | 2,098 |
Note: * Indicates that the difference between the percentage of boys and girls is statistically significant at the 5% level.
Source: LSAC Wave 7, K cohort, weighted
The LSAC data confirm that, on average, Year 9 numeracy scores were higher for boys. Although the difference is small, this may be a contributing factor in the gender difference in subject choice due to self-efficacy; students are attracted to subjects that they think they will succeed in (Tellhed, Bäckström, & Björklund, 2017).
Subject choice is also shaped by the school students attend (Anders, Henderson, Moulton, & Sullivan, 2018). Schools may offer different selections of subjects or guide their students towards certain paths. In LSAC just over half of all secondary students at 16-17 years were attending a government school, around a quarter went to a Catholic school and the remaining quarter attended an independent school. There were no significant differences in the percentage of boys and girls by school sector. However, more girls than boys attended a single-sex school (22% vs 17%). If single-sex schools offer benefits in terms of students being more confident in taking on subjects traditionally dominated by the other sex, more girls than boys are exposed to this opportunity.
There were no significant differences in the percentage of students living in major cities, regional or remote areas, so place of residence is unlikely to account for the gender differences in subject selection.
In summary, preliminary examination of the LSAC data shows that differences in education and career aspirations and attendance at single-sex schools are likely to have a stronger influence on gender differences in subject choices than prior numeracy attainment, school sector and location. Section 9.1 found gender differences in subject selection to be particularly apparent in STEM subjects, with fewer girls than boys enrolling in Maths (particularly Advanced Maths), Physics, Technology and Engineering. The next section looks in closer detail at the characteristics of boys and girls enrolling in specific STEM subjects.
9.3 Characteristics related to enrolment in STEM subjects
Maths
Maths (particularly at the intermediate or advanced level) is a prerequisite for acceptance to most science, technology, engineering and business-related university courses in Australia, making it an important gateway into STEM learning and careers. As shown in section 9.1, Maths subjects were chosen by the majority of students (86%) in Years 11 and 12 with slightly higher proportions of boys than girls taking any maths subject (83% girls and 89% boys; Table 9.4). While the numbers of boys and girls taking Basic and Intermediate Maths were similar, substantially more boys took Advanced Maths (11% compared to 6% of girls).
Students' choices of Maths subjects were generally consistent with their educational expectations and career aspirations (Table 9.4). Enrolments in Intermediate and Advanced Maths were higher among boys and girls who expected to get a degree qualification, compared to those who expected to do no post-school study. On the other hand, the enrolments in Basic Maths was higher among those who expected to do no post-school study or complete a Trade or VET qualification, compared to those who expected to obtain a degree qualification. Students' career aspirations were a strong influence on their choice of Maths subjects. Boys aspiring to be engineers, ICT specialists or scientists and girls aspiring to be doctors, vets or zoologists were more likely to choose Intermediate or Advanced Maths.
Students generally chose a Maths subject in line with their ability levels. Enrolment in more complex maths subjects increased with maths ability, measured by Year 9 NAPLAN numeracy scores. However, some students who scored in the top 25% for numeracy in Year 9 were taking a basic or intermediate level Maths subject in Year 11 or 12. For some, this might be because Advanced Maths was not required for their preferred university course, or intended career.
While there were no statistically significant differences in enrolment in Maths subjects according to school sector, enrolment in Advanced Maths was substantially higher among boys and girls attending single-sex schools, compared to those in co-educational schools. For example, less than 5% of girls attending co-educational schools chose Advanced Maths compared to 11% of girls attending all-girls schools. This finding is in line with research showing that students attending single-sex schools are more confident in taking on more academic subjects (Jeffrey et al., 2007).
Enrolment in Advanced Maths was also significantly higher among boys and girls who spoke a language other than English at home, compared to those who did not; and, for girls, enrolment in Basic Maths was lower among those who spoke a language other than English, compared to those who spoke English only.
Overall Maths enrolments did not differ according to region of residence, although boys in outer regional/remote areas were more likely to select Basic Maths than boys living in major cities (70% vs 57%). Boys living in households in the lowest 25% of socio-economic position (SEP) scale were also more likely to take Basic Maths, and less likely to take Intermediate Maths, compared to boys in the top 25% SEP.
Note: * Indicates the difference between the percentage of boys and girls enrolled is statistically significant at the 5% level. ref. Indicates reference category. ^ Indicates a significant difference from the reference category at the 5% significance level. # Estimate not reliable (cell count <20).
Source: LSAC Waves 6 and 7, K cohort, weighted
Science
Almost 60% of Year 11 and 12 students were enrolled in a science subject, with specific Science subjects having substantially different enrolment rates, ranging from 14% for Life Sciences and 15% for Physics to 32% for Biology (Table 9.5). These differences may be explained by differences in career aspirations related to particular subjects (e.g. Physics was popular among those who had aspirations to be engineers and ICT professionals, while common career aspirations among Biology students were health and medical professionals, vets and zoologists). While similar proportions of boys and girls selected Chemistry (around one in five students), more girls enrolled in Biology (40% vs 24% of boys) and more boys enrolled in Physics (22% vs 8% of girls).
Overall, participation in Science subjects was higher among students who expected to complete a degree qualification, and it and increased with higher Year 9 numeracy scores. This is in line with other research showing academic achievement was one of the dominating characteristics in determining course participation in Advanced Maths and Sciences (Thomson, 2005). Participation was also higher among boys (but not girls) attending single-sex schools, compared to those attending co-educational schools, and boys and girls in families in the top 25% for socio-economic position, compared to those in the lowest 25%.
Note: * Indicates the difference between the percentage of boys and girls enrolled is statistically significant at the 5% level. ref. indicates reference category. ^ Indicates a significant difference from the reference category at the 5% significance level. # Estimate not reliable (cell count <20).
Source: LSAC Waves 6 and 7, K cohort, weighted
Technology subjects
Technology comprises a number of different subjects including Information and Communication Technology (ICT), Engineering, Design Technology (which includes Woodwork as well as Textiles and Design), Construction, and Industrial Technology. Overall, more than one in five (22%) Year 11 and 12 students were enrolled in a Technology subject, although there were significantly higher participation rates among boys than among girls across all four Technology subject groups (Table 9.6).
The relatively small numbers of observations for students (particularly girls) enrolled in specific technology subjects may account for the lack of statistically significant differences in enrolment by educational expectations, NAPLAN score, school type or socio-demographic characteristics. There was a trend for students expecting to go on to do a university or postgraduate degree to be less likely to select technology subjects than those with lower educational expectations. For example, 25% of boys expecting to get a postgraduate degree and 29% expecting to do an undergraduate degree enrolled in a Technology or Engineering subject, compared to 41% who expected to go no further than Year 12.
As expected, students who wanted to work as engineers, ICT professionals or tradespeople were more likely to be enrolled in Technology and Engineering subjects. Those who aspired to work in creative arts and media were also more likely to enrol in Technology and Engineering subjects such as Design Technology and Construction and Industrial Technology.
Notes: * Indicates the difference between the percentage of boys and girls enrolled is statistically significant at the 5% level. ref. Indicates reference category. ^ Indicates a significant difference from the reference category is significant at the 5% significance level. # Estimate not reliable (cell count <20).
Source: LSAC Waves 6 and 7, K cohort, weighted
9.4 Gender participation in STEM subjects
The LSAC data show that fewer girls than boys select STEM subjects in Years 11 and 12, confirming previous Australian and international research (Ainley et al., 2008; Watt et al., 2012). This finding is no doubt related to the under-representation of girls in STEM-related education and occupations, and supports the argument that gender imbalances in tertiary education and high-paying jobs in STEM fields can be traced back to students' choice of STEM subjects in secondary school (Justman & Méndez, 2016; Lamb et al., 2015; Martin, 2007).
For some subjects, gender differences in the odds of enrolment remained even after accounting for educational expectations, career aspirations, earlier academic performance, characteristics of the school, language, socio-economic position and region of residence (Table 9.7).
Notes: Logistic regression, year level, language spoken at home, Year 9 NAPLAN Numeracy scores, educational expectations and career aspirations, family socio-economic status, residential location, state, school sector and single-sex school. Odds ratios reported.
* p < .05; **p < .01; ***p < .001. n = 2,001.
Source: LSAC Waves 6 and 7, K cohort, unweighted
Figure 9.1: Boys were more likely to choose STEM subjects than girls
Credit: Longitudinal Study of Australian Children 2019 (creativecommons.org/licenses/by/4.0/)
After accounting for other factors, compared to girls:
- The odds of enrolling in Advanced Maths were doubled for boys.
- The odds of studying Physics were 3.3 times higher for boys.
- The odds of studying Biology were 30 percentage points lower for boys.
- The odds of enrolling in a technology subject were more than doubled for boys.
- The odds of taking an engineering subject were almost tripled for boys.
- The odds of enrolling in Design Technology were almost five times higher for boys.
- The odds of participating in Construction and Industrial Technology were almost six times higher for boys.
Summary
While the secondary school educational system aims to offer equal and efficient education to Australian students, regardless of personal, family and social factors, significant differences exist in students' school subject participation in their final two years of school. These differences are an important influence on subsequent educational and occupational outcomes. This chapter presents the subject selections for study in Years 11 and 12 of Australian school students in 2016. Clear gender differences were observed for some subjects. Most notably, more boys than girls selected key STEM subjects. Boys outnumbered girls almost two to one in Advanced Maths, three to one in Physics and Engineering and five to one in Design Technology.
A range of individual, social, societal, school and geographical factors have been found to be related to school subject choice and many of these were examined in section 9.2. Differences in enrolments for certain subjects were observed according to educational expectations, career aspirations, prior numeracy attainment, and whether the school attended was single-sex or co-educational. Even when taking these factors into account, the gender bias in STEM subject enrolments remained: boys were significantly more likely to select STEM subjects.
Girl students' under-representation in STEM subjects in the final years of secondary school contributes to future gender segregation in tertiary education and, in the long-term, the gender gap in wage and career prospects (Gundert & Mayer, 2012; Justman & Méndez, 2016). More importantly, STEM education is vital for future economic and technological development in Australia - with STEM skills in high demand, the under-representation of girls will contribute to a shortage in the STEM-related workforce and competencies. For this reason, a broad range of programs promoting STEM for pre-school and school-aged girls have been established and delivered by government, industry and education providers (Australian Academy of Science, 2019; Department of Industry Innovation and Science, 2019).
Understanding the complex range of factors that lead to the under-representation of girls in STEM subjects is an important first step in addressing the gender imbalance. Recent Australian reviews of the issue have identified factors such as lack of role models, lack of understanding of career options, family/cultural expectations and disengagement from STEM education as key barriers (Australian Academy of Science, 2019; Hobbs et al., 2017). The National STEM School Education Strategy (2016-2026) agreed by all Commonwealth and state and territory education ministers highlights the need for action at all stages of education and emphasises the importance of reducing student disengagement from STEM in the primary and middle school years (Education Council, 2015). This is a particular problem for girls. The Academy of Science's Women in STEM Decadal Plan has an aspiration that: 'The Australian education system inspires, enables and encourages girls and women at all levels to study STEM courses and equips them with the skills and knowledge to participate in STEM and related careers of the future.' (Australian Academy of Science, 2019, p. 33). As widely recognised, and confirmed in this chapter, there is a long path ahead to achieve this vision as demonstrated by the stark gender imbalance in Australian secondary school students' STEM subject selection.
References
Ainley, J., & Ainley, M. (2011). Using longitudinal data to investigate the influence of interest in science on the uptake of science studies. Washington, DC: AERA.
Ainley, J. G., Kos, J., & Nicholas, M. (2008). Participation in science, mathematics and technology in Australian education. Melbourne: Australian Council for Educational Research (ACER).
Altonji, J. G., Blom, E., & Meghir, C. (2012). Heterogeneity in human capital investments: High school curriculum, college major, and careers. Annual Review of Economics, 4, 185-223.
Anders, J., Henderson, M., Moulton, V., & Sullivan, A. (2018). The role of schools in explaining individuals' subject choices at age 14. Great Britain: Taylor & Francis.
Australian Academy of Science. (2019). Women in STEM decadal plan. Canberra: Australian Academy of Science.
Australian Bureau of Statistics (ABS). (2018). Education and work, Australia, 'tables 1-20: Education and work', data cube: Excel spreadsheet, cat. No. 62270do001_201805. Canberra: ABS. Retrieved from www.abs.gov.au/AUSSTATS/abs@.nsf/DetailsPage/6227.0May%202018?OpenDocument
Australian Curriculum Assessment and Reporting Authority (ACARA). (2018). Naplan achievement in reading, writing, language conventions and numeracy: National report for 2018. Sydney: ACARA.
Baxter, J. (2017). The career aspirations of young adolescent boys and girls. Australian Institute of Family Studies (Ed.), Growing up in Australia: The Longitudinal Study of Australian Children, Annual Statistical Report 2016, (pp. 11-34). Melbourne: Australian Institute of Family Studies.
Britner, S. L., & Pajares, F. (2006). Sources of science self-efficacy beliefs of middle school students. Journal of Research in Science Teaching, 43(5), 485-499.
Department of Industry Innovation and Science. (2019). Advancing women in STEM. Canberra: Department of Industry Innovation and Science.
Education Council. (2015). National Stem School Education Strategy, 2016-2026. Carlton South, Vic.: Education Council.
Fullarton, S., & Ainley, J. (2000). Subject choice by students in Year 12 in Australian secondary schools. Longitudinal surveys of Australian youth research report. Washington DC: ERIC.
Fullarton, S., Walker, M., Ainley, J., & Hillman, K. (2003). Patterns of participation in Year 12. (LSAY research report no. 33). Melbourne: ACER.
Gundert, S., & Mayer, K. U. (2012). Gender segregation in training and social mobility of women in West Germany. European Sociological Review, 28(1), 59-81.
Hobbs, L., Jakab, C., V., M., Millar, V., Prain, V., Redman, C., Speldewinde, C. et al. (2017). The Invergowrie foundation STEM report, girls' future - our future. Melbourne: The Invergowrie Foundation.
Ingrid, S., Andy, R., & Peter, M. (2007). Science related careers: Aspirations and outcomes in two British cohort studies. Equal Opportunities International, 26(2), 129-143.
Jeffrey, P. L., Forgasz, H., Leder, G., & Taylor, C. A. (2007). Research versus the media: Mixed or single-gender settings? International Conference of the Australian Association for Research in Education, Fremantle, Australia.
Joensen, J. S., & Nielsen, H. S. (2012). Is there a causal effect of high school math on labor market outcomes? The Journal of Human Resources, 44(1), 171-198.
Justman, M., & Méndez, S. J. (2016). Gendered selection of STEM subjects for matriculation. Melbourne Institute of Applied Economic and Social Research, the University of Melbourne.
Khattab, N. (2015). Students- aspirations, expectations and school achievement: What really matters? Great Britain, Chichester, West Sussex: John Wiley & Sons, Ltd.
Lamb, S., Jackson, J., Walstab, A., & Huo, S. (2015). Educational opportunity in Australia 2015: Who succeeds and who misses out. Melbourne: Melbourne Institute.
Louis, R. A., & Mistele, J. M. (2012). The differences in scores and self-efficacy by student gender in mathematics and science. Netherlands: Springer Science + Business Media.
Mael, F., Alonso, A., Gibson, D., Rogers, K., & Smith, M. (2005). Single-sex versus secondary schooling: A systematic review. Washington DC: U.S. Department of Education.
Marks, G. N. (2013). Evaluating effectively maintained inequality: School and post-school transitions, socioeconomic background, academic ability and curricular placement. Social Science Research, 42(6), 1635-1649.
Martin, I. S. (2007). Science related careers: Aspirations and outcomes in two British cohort studies. Equal Opportunities International, 26(2), 129-143.
Riegle-Crumb, C., & King, B. (2010). Questioning a white male advantage in STEM: Examining disparities in college major by gender and race/ethnicity. Educational Researcher, 39(9), 656-664.
Rose, H., & Betts, J. R. (2004). The effect of high school courses on earnings. The Review of Economics and Statistics, 86(2), 497-513.
Shavit, Y., & Müler, W. (2000). Vocational secondary education, tracking, and social stratification. Boston: Springer Nature / Books.
Sullivan, K., Perry, L. B., & McConney, A. (2013). How do school resources and academic performance differ across Australia's rural, regional and metropolitan communities? Australian Educational Researcher, 40(3), 353-372.
Tellhed, U., Bäckström, M., & Björklund, F. (2017). Will I fit in and do well? The importance of social belongingness and self-efficacy for explaining gender differences in interest in STEM and heed majors. Sex Roles, 77(1-2), 86-96.
Thomson, S. (2005). Pathways from school to further education or work: Examining the consequences of year 12 course choices (Longitudinal surveys of Australian youth research report no. 42). Melbourne: ACER.
Watt, H. M. G., Shapka, J. D., Morris, Z. A., Durik, A. M., Keating, D. P., & Eccles, J. S. (2012). Gendered motivational processes affecting high school mathematics participation, educational aspirations, and career plans: A comparison of samples from Australia, Canada, and the United States. Developmental Psychology, 48(6), 1594-1611.
Yu, M., & Daraganova, G. (2015). The educational expectations of Australian children and their mothers. Australian Institute of Family Studies (Ed.), Growing up in Australia: The Longitudinal Study of Australian Children, Annual Statistical Report 2014, (pp. 105-130). Melbourne: Australian Institute of Family Studies.
1 Of the 14% of 16-17 year olds who were not at secondary school in 2016, 7% were studying at TAFE, 50% were working or looking for work, and 42% were travelling, looking after family members or doing something else. For the analysis in this chapter, the sample was restricted to secondary school students in Years 11 and 12.
Acknowledgements
Featured image: © GettyImages/JohnnyGreig
Publication details
Download Publication
Share


